experimental analysis
Article in International Journal of Refrigeration · September 2018
DOI: 10.1016/j.ijrefrig.2018.09.020 CITATIONS 8 READS 1,077 6 authors, including:
Some of the authors of this publication are also working on these related projects:
Special Issue (Frontiers in Energy Research): Advances in Refrigeration Technologies for Climate Change MitigationView project
Improvements on CO2 Vapour Compression CyclesView project Angelo Maiorino
Università degli Studi di Salerno
100PUBLICATIONS 1,289CITATIONS
SEE PROFILE
Ciro Aprea
Università degli Studi di Salerno
132PUBLICATIONS 2,083CITATIONS
SEE PROFILE
Manuel Gesù Del Duca Università degli Studi di Salerno
7PUBLICATIONS 30CITATIONS
SEE PROFILE
Rodrigo Llopis Doménech Universitat Jaume I
131PUBLICATIONS 1,519CITATIONS
Accepted Manuscript
R-152a as an alternative refrigerant to R-134a in domestic refrigerators: an experimental analysis
Angelo Maiorino , Ciro Aprea , Manuel Ges `u Del Duca , Rodrigo Llopis , Daniel S ´anchez , Ram ´on Cabello
PII: S0140-7007(18)30351-7
DOI: https://doi.org/10.1016/j.ijrefrig.2018.09.020
Reference: JIJR 4113
To appear in: International Journal of Refrigeration
Received date: 6 June 2018
Revised date: 14 September 2018
Accepted date: 15 September 2018
Please cite this article as: Angelo Maiorino , Ciro Aprea , Manuel Ges `u Del Duca , Rodrigo Llopis , Daniel S ´anchez , Ram ´on Cabello , R-152a as an alternative refrigerant to R-134a in domes-tic refrigerators: an experimental analysis, International Journal of Refrigeration (2018), doi:
https://doi.org/10.1016/j.ijrefrig.2018.09.020
This is a PDF file of an unedited manuscript that has been accepted for publication. As a service to our customers we are providing this early version of the manuscript. The manuscript will undergo copyediting, typesetting, and review of the resulting proof before it is published in its final form. Please note that during the production process errors may be discovered which could affect the content, and all legal disclaimers that apply to the journal pertain.
ACCEPTED MANUSCRIPT
HIGHLIGHT
An experimental comparison between R-134a and R-152a is presented.
A domestic refrigerator made to work with R-134a is analysed.
The annual energy consumptions of the device are reported.
The energy saving achievable after the drop-in is evaluated.
ACCEPTED MANUSCRIPT
R-152a as an alternative refrigerant to R-134a in domestic refrigerators: an
experimental analysis.
Angelo Maiorinoa,2, †, Ciro Apreaa,1, Manuel Gesù Del Ducaa, Rodrigo Llopisb,2, Daniel
Sánchezb,2, Ramón Cabellob
a Department of Industrial Engineering, University of Salerno,
Via Giovanni Paolo II 132, 84084, Fisciano (SA), Italy
bDepartment of Mechanical Engineering and Constrution, University Jaume I,
Campus de Riu Sec s/n E-12071, Castellon de la Plana, Spain Abstract
Among all sectors of refrigeration, one of the most affected by the latest international regulations is the domestic refrigeration. Although for it has been suggested some solutions, such as the construction of household refrigerator operating with the hydrocarbons, there remains the need to find a substitute for R-134a. With the aim of finding a simple implementation solution, in the present work, it is reported an experimental investigation carried out on a domestic no-frost refrigerator designed and built to operate with R-134a and for which a drop-in with R-152a has been realised. Different tests have been performed with the aim to identify the right charge of R-152a too. In line with the standard ISO 15502:2005 (2005), pull-down and 24-hours energy consumption experiments have been run to evaluate the performance of R-152a as the drop-in replacement of R-134a in a domestic refrigerator. Also, a theoretical model has been proposed with the aim to give support to the observed energy change.
Keywords: R-134a; R-152a; Domestic refrigeration; capillary tube; low GWP; Energy Analysis;
_____________
* Corresponding author: Tel. +39 (0) 89 964105; fax +39 089 964037; E-mail: [email protected] (A. Maiorino).
1 Member of IIR-IIF Commission E2.
2 Member of IIR-IIF.
Nomenclature
Symbols
COP Coefficient of Performance [\]
E Electric energy consumption [W h]
EER Energy Efficiency Ratio [\]
GWP Global Warming Potential [\]
h Specific enthalpy [kJ kg-1]
HOC Heat of Combustion [MJ kg-1]
ACCEPTED MANUSCRIPT
LFL Lower flammability limit [%]
M Molecular weight [kg kmol-1]
n Number of working cycles in 24h [\]
NBP Normal Boiling Point [°C]
P Power Absorbed [W]
p Pressure [bar]
q0 Specific Cooling Capacity [kJ kg-1]
Qref Thermal load [kJ]
RCL Refrigerant Concentration Limit [g m-3]
T Temperature [°C]
t Time [s]
v Specific volume [m3 kg-1]
VCC Volumetric Cooling Capacity [kJ m-3]
Greek symbols
∆ Increment [\]
δ Duty cycle [%]
ε Thermal effectiveness [\]
ηc Compressor's overall effectiveness [\]
λ Latent heat [kJ kg-1] Subscripts 24h along 1-day air of air ave average c cabinet cmp compressor CO cycling operations cond condenser crit critical
dis discharge of the compressor
el electric
f at freezer
i,ev at the inlet of the evaporator
K condensing
K,out at the outlet of the condenser
O evaporating
O,out at the outlet of the evaporator
OFF phase of the stop of the compressor
ON phase of working of the compressor
ove overall of the apparatus (defrost phase included)
pd during the pull-down test
PDC Post-Defrost Cycle
phase during a defined condition
r at refrigerator
ACCEPTED MANUSCRIPT
R-152a of R-152a
ref of refrigerant
s isentropic
sor surround
suc suction of the compressor
v saturated vapour condition
1. INTRODUCTION
R-152a is an old hydrofluorocarbon extensively used as aerosol spray propellant and foam-blowing agent, as component in refrigerant mixtures (R-500, R-411,…), and also considered as replacement of CFC-12 in domestic refrigerators (Bittle, 1994). However, its use in refrigeration was initially rejected due to its flammability. As pure refrigerant, it has not been entirely treated until the hydrofluorocarbons were questioned about their high GWP by the F-Gas Regulation (The European Commission, 2014) and by the Kigali amendment to the Montreal Protocol (UNEP, 2016). These agreements have reduced the permitted fluids, especially for small hermetic systems for commercial or domestic use, forcing the use of refrigerants with a lower security classification. R-152a is the unique hydrofluorocarbon included in ASHRAE Std 34 (ASHRAE, 2016) that presents a GWP value below 150, the most restrictive limit of the F-Gas Regulation; therefore no reductions, replacements or prohibitions should be applied to it.
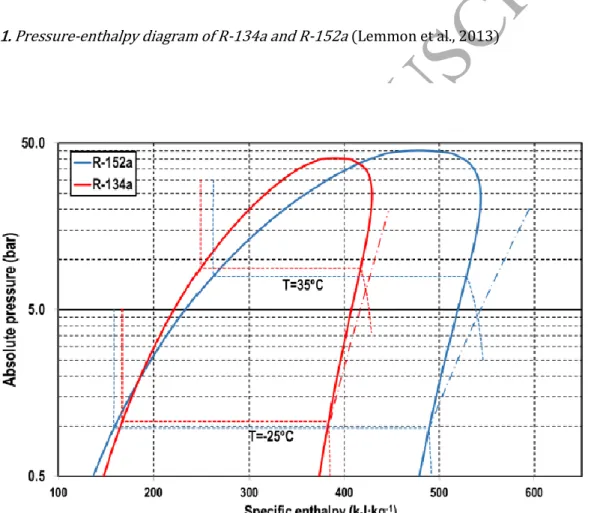
R-152a can be a good alternative for R-134a, since they present similar NBP and critical point, achieving a GWP reduction of 89.4%. Both molecules have two carbon atoms and the same kind of bonds, but they differ in quantity of fluorine and hydrogen. R-134a includes four fluorine atoms and R-152a only two; thus R-152a cannot avoid the flammable characteristics minimised by the fluorine atoms. Tab.1 collects their main thermodynamic, safety and environmental properties and Fig. 1 presents their pressure-enthalpy diagram. The most relevant differences between the fluids are: more considerable latent heat of phase-change of
R-152a (+53% respect to R-134a at To=-25 °C), higher specific vapour volume of R-152a
(+69.9% in relation to R-134a at saturation at To=-25 °C) and lower inclination of isentropic lines of R-152a. Nonetheless, if the volumetric cooling capacity (VCC) is considered, the
difference between them is below 1% for an ideal cycle at Tk=35 °C and To=-25 °C, and the
ideal COP of R-152a at the same temperatures is 5.7% higher (see Section 2). Leaving apart the flammability characteristics of R-152a, it is an excellent candidate to be used in hermetic refrigeration systems.
The first experimental attempt found to use R-152a as alternative to R-134a in domestic refrigerators was of (Sanvordenker, 1992), who tested both fluids in a calorimeter bench using different hermetic compressors. He found R-152a had no energy advantage for R-134a since there was a significant energy penalty. They measured 1.1 to 6.3% COP decrease with R-152a. However, (Pannock et al., 1994) measured in calorimeter tests 2% EER increments of R-152a versus R-134a, but they found no differences in the behaviour of a refrigerator/freezer and suggested to redesign the capillary. Capillaries were studied in detail by (Bittle et al., 1995), establishing the variables that most affect the behaviour when using R-152a.
The MAC Directive in Europe (The European Commission, 2006) limited to a GWP=150 the refrigerant in MAC systems. R-152a was considered again by the automobile industry. Theoretically, (Ghodbane, M., 1999) concluded that COP of R-152a was 10% higher than with R-134a. Kim et al. (2008) measured R-152a 20% improvement in COP and capacity using a swash-plate open-type compressor and Bryson et al.( 2011) 2% in capacity and 9% in COP
ACCEPTED MANUSCRIPT
improvements using an open-type compressor employing compressor speed and expansion adjustment. The last authors reported increments in R-152a discharge temperature. Nonetheless, R-152a was not the selection for MAC systems.
F-Gas directive has resulted in renewed interest in R-152a (The European Commission, 2014). Bolaji (2010) experimented with R-134a substitution by R-152a in single-temperature domestic refrigerator. R-134a system used hermetic compressor and adiabatic capillary tube and was tested for four refrigerant charges (60, 80, 100 and 120 g). Although the charge had a step of ±20 g, he observed that the optimal charge for both refrigerants was equal (100 g). At that charge, the pull-down time was reduced with R-152a and consumed 3.82% less energy than R-134a in 24-hour energy tests. Cabello et al. (2015) and Sánchez et al. (2017), using a
test bench for hermetic compressors evaluated R-152a in an R-134a 12.11 cm3 hermetic
compressor at evaporating temperatures of -10, 0 and 10 °C, at three condensing levels 25, 35 and 45 °C, with and without internal heat exchanger (IHX). R-152a presented a reduction of 16% of power consumption, lower capacity, but essential increments in COP, reaching 11.7% improvement without IHX and 13.2% with IHX. Also, discharge temperature was up to 4.5 K lower without IHX and up to 5.5 K lower with IHX.
Accordingly, from the revision, it is clear that R-152a could offer energy benefits in relation to R-134a and 89.4% GWP reduction in appliances with limited refrigerant charge. Also, it is worthy to notice that for domestic refrigeration it has already been proposed to replace R-134a with isobutane (R-600a). However, although this solution has already been accepted by the European market, the use of R-600a may have high barriers to the American market (US market) because of more stringent standards for fire prevention (UL Standard 250), as well as other markets might be reluctant to such a solution. By starting with those motivations, the substitution of R-134a with R-152a in the field of the domestic refrigerators can be considered.
This work, in contrast to Bolaji’s, aims to contribute by analysing R-152a as alternative for R-134a refrigeration appliances with non-adiabatic capillary tube.
An R-134a two-temperature no-frost domestic refrigerator (class A+) with non-adiabatic capillary tube and variable-speed compressor has been considered. Tests have identified the right charge of R-152a. Considering the standard ISO 15502:2005 (2005), pull-down and 24-hours energy consumption experiments have been run to evaluate the performance of R-152a as drop-in replacement of R-134a in a domestic refrigerator.
2. THEORETICAL PERFORMANCE
R-152a as alternative for R-134a was evaluated under simplified thermodynamic cycles for two standard layouts: compression system with adiabatic expansion device and compression system with non-adiabatic expansion device (wrapped along the suction line in a counter-flow way).
Specific cooling capacity was evaluated with Eq. (1). The non-adiabatic expansion device was idealised as an internal heat exchanger, with thermal effectiveness defined by Eq. (2). Isentropic discharge properties were evaluated using compressor suction conditions. VCC, Eq. (3), and COP, Eq. (4), were computed using Refprop 9.1 properties (Lemmon et al., 2013).
( , , ) ( , ) (1) ( , ) ( , , ) (2) (3) , (4)
ACCEPTED MANUSCRIPT
Analysis of behaviour was supported by operation maps in evaporating temperatures from -35 to -15 °C and in condensing temperatures from 25 to 40 °C. We fixed for all the operating conditions 1 K subcooling degree in condenser and 4 K degree of superheat in evaporator. The comparison was made attending to the VCC variation, Eq. (5), and to the COP variation, Eq. (6). An equal value of the compressor’s overall effectiveness for both refrigerants was considered.
1 1 4
1 4
1 (5)
1 1 4
1 4 1 (6)
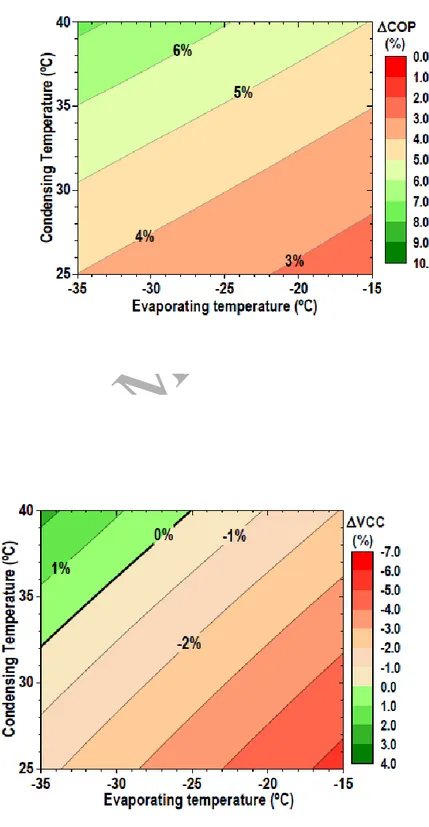
Fig. 2 presents COP (a) and VCC (b) variations between R-152a and R-134a in a single stage cycle working with an adiabatic expansion device, and Fig. 3 with a non-adiabatic expansion device with a thermal effectiveness of 86%. This value is the average of the non-adiabatic expansion device obtained experimentally (discussed later). For a device operating with adiabatic expansion device, left map of Fig. 2 confirms that R-152a offers theoretically higher COP values respect to R-134a in all the operating range. The increment ranges from 2 to 7%. However, the right map of Fig. 2 indicates that capacity of R-152a system will be reduced regarding R-134a except for operating conditions at high-temperature lift. However, for a cycle with non-adiabatic expansion device (Fig. 3), it is observed that the COP of R-152a is nearly coincident to that of R-134a (variation from -0.8 to +0.4%), but the reduction in capacity of R-152a rises to 8%.
From the theoretical results, the following observations can be made: With systems using adiabatic expansion devices (capillary tube not joined with suction line), R-152a would offer higher cycle efficiencies and similar capacity; thus, its use as alternative could be considered. That is in agreement with Bolaji’s experimental results, who measured COP increments of R-152a concerning R-134a of 4.7% (Bolaji, 2010) and similar pull-down times. However, for systems using non-adiabatic expansion devices (capillary tubes wrapped along suction line), both would have similar COP values, but R-152a would show less capacity than R-134a if compressor’s efficiencies remain at similar values. However, this last hypothesis needs to be verified, since results of Cabello et al. (2015) indicated an improvement of the compressor's efficiencies up to 2% when an R-134a compressor was run with R-152a. Accordingly, for refrigeration systems using non-adiabatic capillary tubes an experimental analysis is needed, since literature yet has not covered this segment of refrigeration systems.
3. EXPERIMENTAL SETUP
A domestic no-frost refrigerator, working with an optimal charge equal to 101 g of R-134a, has been considered to perform an experimental analysis about R-152a as an alternative refrigerant of R-134a in refrigeration systems equipped with a non-adiabatic capillary tube. This apparatus comprises two compartments, one for freezing (in the range of temperature between -16 °C and -25 °C) and the other one for fresh food preservation. These
areas have a capacity of 0.131 m3 and 0.342 m3, respectively. A single cooling circuit,
composed by a variable-speed hermetic reciprocating compressor, a forced air-cooled condenser, a non-adiabatic capillary tube and a finned tube evaporator (Tab. 2), serves both the areas. An inverter drives the compressor by a based Fuzzy logic program which acts only in answer to a change of the thermal load and it is not dependent on the kind of refrigerant.
The whole system is equipped with an adaptive defrost system, which consists of electric heaters (resistors) located in the proximity of the evaporator coils to avoid excessive ice
ACCEPTED MANUSCRIPT
growth. The defrost activities can be divided into two parts: the first one during which the compressor is switched OFF, and the electrical resistors are switched ON (hereto referred to as Defrost phase) and the other one related to the ON period of the compressor needed to reach the cycling operations condition (hereto referred to Post-Defrost phase). Several sensors (Tab. 3) have been fitted to the refrigeration system described above, and a set of instrumentation has been used to characterise the plant before and after the drop-in of R-134a with R-152a. Further details both of the apparatus and of the measurement equipment are reported in Aprea et al. (2017).
4. EXPERIMENTAL PROCEDURE
The refrigerator system has been placed inside a climate chamber, which was able to keep a surround air temperature of +25 °C ± 0.5 °C and relative humidity between 45% and 75%, according to UNI-ISO 15502 (sub-tropical areas condition). Furthermore, no thermal load inside the cabinet was considered during the experimentations.
The thermostat setting has been fixed at -18 °C (set-point temperature) with a hysteresis of ±2 °C to maintain an indoor freezer air temperature in the range between -20 °C and -16 °C. The damper in the fresh food compartment was set in such a way as to ensure an internal air temperature of +4 °C.
The comparison between R-134a and R-152a has been carried out analysing the performance of both refrigerants during pull-down phase and a 24-hours working period. Both refrigerants have been tested using manufacturer’s refrigerant lubricant (POE 68) since R-152a is fully miscible with it for all the operating temperature range of the system according to the report of Godwin and Hourahan (Godwin D., Hourahan G. C., 1993).
Electrical energy consumption and electrical power absorbed are recorded, as well as the elapsed time to reach the set-point temperature.
The 24-hours experimentations have been performed considering the cyclic working behaviour of the refrigerator, characterised by an alternation of ON and OFF period of the compressor. The collection of measurements has started when the differences between one cycle and the others are below 5%, concerning ON and OFF time. A period of defrosting process is considered during the test, as far as the standard establishes. Electrical energy consumption and electrical power absorbed are recorded. Furthermore, the average duty
cycle ( ) has been calculated as an average among the different duty cycles calculated for
each cycle ( ), excluding defrost time, according to the following formulation:
,
, , (7)
∑
(8) In Eq. 7 and 8, the subscript identifies the cycle, defines the number of cycles made by
the compressor in 24 hours, not considering the defrost period, and represent the
period during which the compressor is working and that one it is switched off, respectively. The first step of the investigation has been carried out with the aim to characterise the refrigerator system behaviour as it is designed. Then, the drop-in of R-134a with R-152a has been performed. With the aim to identify the right charge of R-152a, different pull-down and 24-hours tests have been carried out for different refrigerant charges.
ACCEPTED MANUSCRIPT
5. RESULTS AND DISCUSSION
5.1Identification of right charge of R-152a
In the case of R-134a, the refrigerator takes 6126 s (tpd=102.1 min) to reach a freezer air
temperature (Tair,f) of -18 °C minus the hysteresis value (2 °C). Using R-152a, the same temperature span is covered in different timing, depending on the charge. With a mass equal
to 77 g, it observes a tpd of 6460 s (107.7 min), which is a delay of 5.5%; while charging 93 g, it
is highlighted by a reduction of 592 s (-9.7%), that leads to a pull-down time of 5534 s (92.2 min). The changing in the mass of R-152a brings a noticeable variation in electric consumption of the system during the pull-down (Epd) test too. Increasing the charge of R-152a, the electric consumption reflects the decreasing behaviour shown by the pull-down time, pointing out a maximum reduction of -9.7% with 93 g in the mass of R-152a.
Tab. 4 shows a higher maximum electric power absorbed by the compressor during pulldown tests with each charge of R-152a than that absorbed with R-134a. This increase varies between +9% and +24%, referring to 77 g and 93 g charge in the mass of R-152a, respectively. Nevertheless, this increment in maximum electric power absorbed is not accompanied by the same behaviour of its average, for which the changing ranged from -2.7% (77 g) to 0.9% (93 g).
It has been noticed that the increasing of R-152a charge has led to higher values of maximum condensation pressure in comparison with R-134a, with a maximum increment of about 10%: from 14.5 bar to 16.0 bar. That led to consider a 93 g of mass as the maximum mass allowed in this investigation.
However, the analysis of the pull-down tests could be not enough to carry out the right charge of R-152a; hence analysis of the plant behaviour during the 24-hours operation is needed.
The values of the duty cycle, calculated for each charge according to Eq. 7 and 8, including the Post-Defrost cycle, highlight a better performance of R-152a in comparison with R-134a starting from a charge of 83 g. Considering the test with R-134a, the refrigerator shows a duty cycle equal to 65.7%. This value reduces up to 61.2% with 93 g of R-152a (-6.9%). Nevertheless, it is notable that the average electric power absorbed by the compressor during its ON time exhibits a lower value with 90 g than 93 g, as shown in Tab. 4. The difference between these values is very close to the accuracy of the energy meter used for the data collection so that it can be neglected.
The data recorded during 24-hours tests are affected by the defrost activities during which the resistance placed near to the evaporator coil are activated. After this process, the refrigerator performs a transient cycle to reach the set-point temperature inside the cabinet again. This procedure takes place at regular intervals and on time, so it cannot be excluded from the analysis. The energy consumption measured only during the Defrost phase is quite similar among the different tests (60 ± 2 Wh). Besides, it is worth to remind that during this phase the compressor does not work. Hence, neglecting the Defrost phase and including the energy consumption only related to Post-Defrost phase, the results reported in Tab. 4 have been carried out.
Focusing on the behaviour of the apparatus depending on the charge in a mass of R-152a, it is remarkable that a charge of 90 g can be considered as the optimal charge for the system, in the light of the minimum energy consumption measured equal to 768.8 Wh (-7.4%). Hence, this charge has been taken as the right charge in a mass of R-152a.
ACCEPTED MANUSCRIPT
This section contrasts the experimental operation of the refrigeration system working with 101 g of R-134a (optimal refrigerant charge according to the manufacturer) and with 90 g of R-152a, which has been selected as the optimal refrigerant charge according to the energy results of Section 5.1.
The analysis is divided into three subsections: Cycling operation, corresponding to the time in which the compressor is working ‘steadily’ on ON OFF periods; Post-defrost period, that represents the time needed to achieve the inner set-point temperature once the defrost has ended; and the energy consumption analysis, which relates both periods and the theoretical analysis presented in Section 2.
Cycling operation
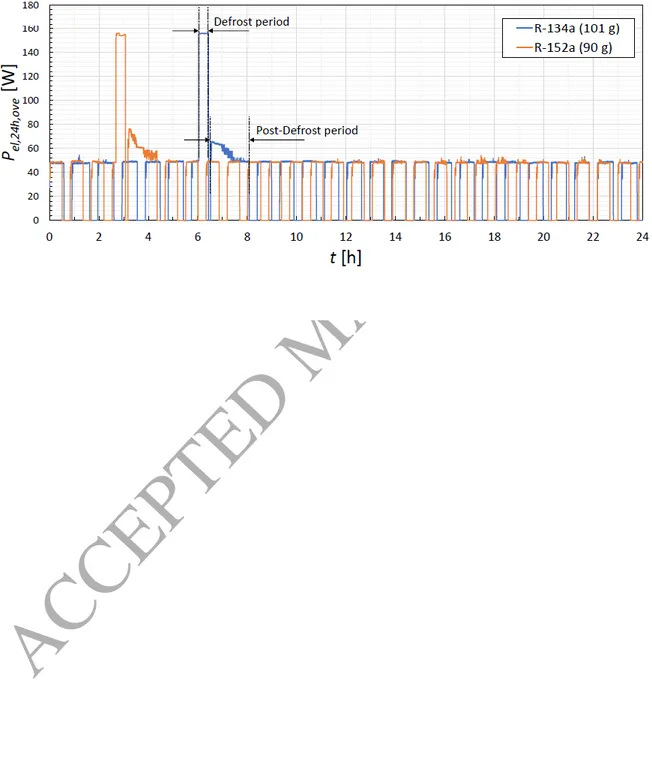
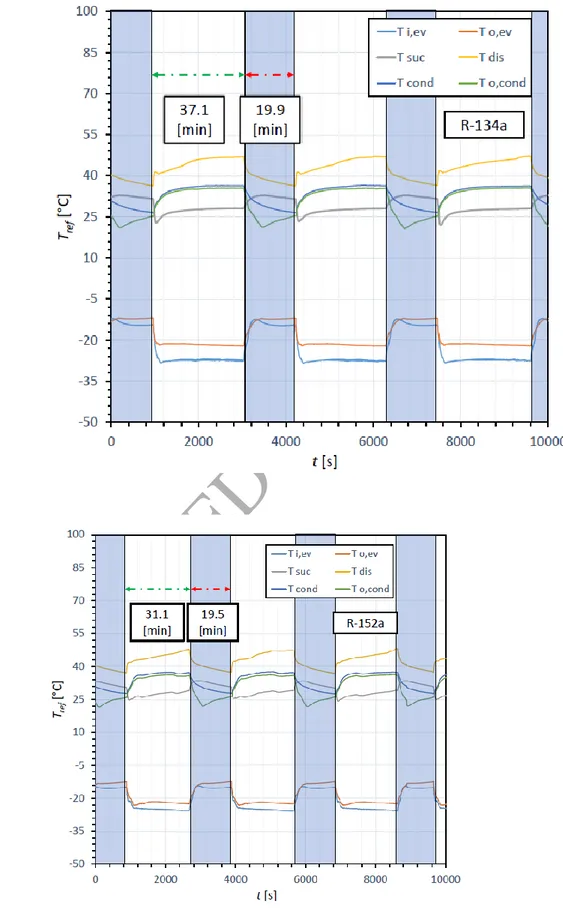
Fig. 4 represents the power consumption of the system during the 24h test for both refrigerants, where it needs to be highlighted than the refrigerator performs a more significant number of cycles with R-152a (29 cycles) in comparison with R-134a (25 cycles) in 24 hours. Between the refrigerants a reduction of the duty cycle when working with R-152a is noticeable. This effect is highlighted in Fig. 5, where the compressor takes 37.1 min to reach the setpoint temperature with 101 g R-134a and 31.1 min with 90 g R-152a. All over the 24h test, excluding the post-defrost period, the average duty cycle of the compressor, calculated following Eq. 7 and 8, is reduced -5.5% in the time when working with 90 g R-152a in relation to 101 g R-134a (Fig. 5).
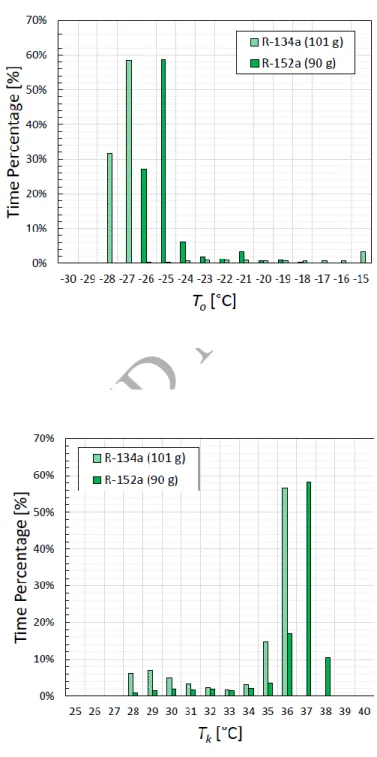
The characteristics of the cycle at low-pressure and high-pressure zones are reported in Fig. 6, concerning time percentage distributions of evaporating and condensing temperature and pressure. Focusing on phase-change temperatures, an increment of the evaporating temperature with R-152a in comparison to R-134a of +1.7 K it is highlighted, as well as an augmented condensing temperature of +2.1 K. About pressures, evaporating pressures are almost identical meanwhile condensing pressure shows a decrease of 8.7% with R-152a (8.4 bar against 9.2 bar). These pressures/temperatures are dependent on the refrigerant charge of the refrigerator, but the analysis refers to the optimal refrigerant charge for both refrigerants. From the experimental measurements, it can be affirmed that using R-152a leads to a reduction of compression ratio from 9.3 to 8.6 (-7.8%). This result suggests that the compressor could be subjected to a higher volumetric efficiency working with R-152a in comparison with R-134a, as reported in Cabello et al. (2015).
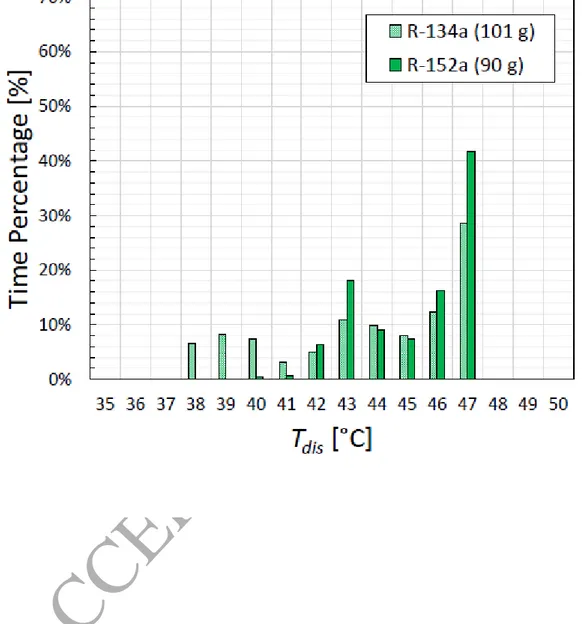
Regarding the compression phase during the ON cycles, it can be observed in Fig. 7 the differences between the discharge temperatures are small. Considering the lower slope of R-152a isentropic lines (Fig. 1), this result suggests an improvement of the isentropic efficiency of the compressor. Nonetheless, this result is bonded to the operation of the compressor fan.
After the analysis of the cycling operation of the refrigerator, it has been observed a reduction of the duty cycle of 5.5% when using 152a as the refrigerant in substitution the R-134a. Since the load conditions to the refrigerator are unchanged (constant conditions maintained by the climatic chamber), it can be concluded that the refrigerator cycle can provide larger cooling capacity with R-152a for the considered application. This result cannot be observed in the results of Cabello et al. (2015), who evaluated the refrigerants at higher evaporating levels, but the trend is similar to that obtained by Bolaji (2010) with a refrigerator with a non-adiabatic capillary tube. From our experimental observations, the following hypothesis can justify the increment of cooling capacity using R-152a:
Enhancement of the evaporator’s behaviour with 9 g R-152a. Although the optimal refrigerant charge with R-152a (90 g) leads the cycle to operate at higher evaporating temperatures (Fig. 6a), the temperature at the exit of the evaporator in Fig. 5a (To,ev, orange
line) exhibits a reduction of superheating degree after the drop-in (5.0 K for R-134a against 3.0 K for R-152a). Furthermore, the two refrigerants show a similar sub-cooling degree (1.0 K). All these effects will contribute to improving the evaporator's performance. It is also worthy to
ACCEPTED MANUSCRIPT
notice a more significant increase of the specific cooling capacity using R-152a as working fluid was measured (+56.9%, 279.9 kJkg-1 against 178.1 kJkg-1), that reflects the more considerable
latent heat of vaporisation of this refrigerant. Furthermore, it is highlighted a reduction of the quality of the refrigerant at the entrance of the evaporator, passing from 0.20 for R-134a to 0.16 for R-152a (-18.1%) that also contributes to improving the thermal behaviour of the evaporator.
Increment of the volumetric cooling capacity with 90 g of R-152a (Eq. 3). On the one
side, Cabello et al. (2015) reported an increment of the volumetric efficiency of the compressor with R-152a in relation to R-134a. Our results indicate that the compression ratio with R-152a is reduced in -7.8%, which could also indicate that the compressor will operate with enhanced volumetric efficiency. On the other side, also Cabello et al. (2015) measured a substantial reduction of refrigerant mass flow rate with R-152a due to their different specific volume at compressor suction. For the conditions established during this experimentation, it has been pointed out an increase of the specific volume (+56.5%, 0.38 m3kg-1 against 0.24 m3kg-1),
which is equivalent to a reduction of the density at the same point equal to 36.1%. The increment of the specific suction volume, in this case, is of the same order of magnitude that the increment of the specific cooling capacity in the evaporator. Accordingly, both variations lead to keep the volumetric cooling capacity to similar values using R-152a than R-134a. However, since the compression ratio is reduced when using R-152a, it leads to thinking that the increment of the volumetric cooling capacity is bonded to an improvement of the volumetric efficiency of the compressor when using R-152a.
Hence, considering all these effects, it is not possible to quantify precisely the variation of the cooling capacity of 90 g R-152a in comparison with 101 g R-134a, but the results of the 24h tests indirectly demonstrate that an increase occurs using R-152a, as the reduction of the duty cycle evidence it.
Post-defrost period
As explained in Section 3, the defrost procedure can be divided into two parts. However, as it said in Section 5.1, the energy consumption differences related to this phase between R-152a and R-134a are negligible, as well as the defrosting period variation (1415 s and 1370 s for R-134a and R-152a, respectively). The maximum temperatures reached in the freezer compartment for R-134a and R-152a during the Defrost phase are equal to 3.7 °C and 3.2 °C, respectively. This difference can also be neglected. Hence, only the Post-Defrost phase has been considered in the analysis. The Post-defrost phase starts when the electrical resistors used for defrosting log off and the compressor starts its operation, and it ends when the temperature inside the fridge reach the set-point temperature. The elapsed time to reach the setpoint temperature after the defrost period affects the daily energy consumption of the plant strongly, showing a benefit with R-152a in comparison with R-134a (-17.8% in terms of energy consumption and -24.7% in elapsed time), although the average electric power absorbed by the compressor is larger with R-152a than with R-134a (Tab. 4).
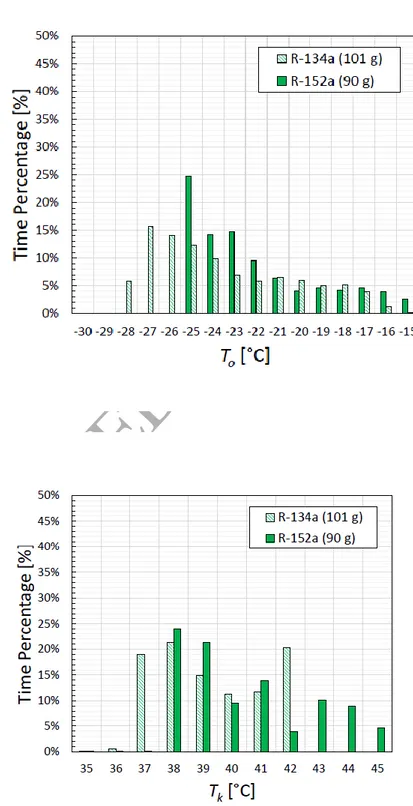
A higher evaporating temperature is shown (Fig. 8.a) with R-152a, passing from -27 °C to -25 °C (+2 K), as well as a higher maximum condensing temperature. Looking at Fig. 8.b, it can be noticed that both fluids work with an average condensing temperature of 40 °C, even though R-152a shows a higher maximum peak. Furthermore, after the drop-in, the discharge temperature during the same period remains almost unchanged (about 51 °C). This result is related to the plant used in the experimentation, which is equipped with a fan which cools the compressor.
From the experimental measurements, it must be highlighted that the use of 90 g of R-152a instead of 101 g of R-134a leads the refrigerator to reduce the post-defrosting time and the energy consumption. Since the load conditions, affected by the previous Defrost phase, are
ACCEPTED MANUSCRIPT
almost unchanged, as explained at the beginning of this sub-section, these results also indicate that the cycle working during the Post-Defrost phase with 90 g R-152a operates with higher values of cooling capacity, in the same line as during the cycling operation.
Energy consumption and relation with theoretical analysis
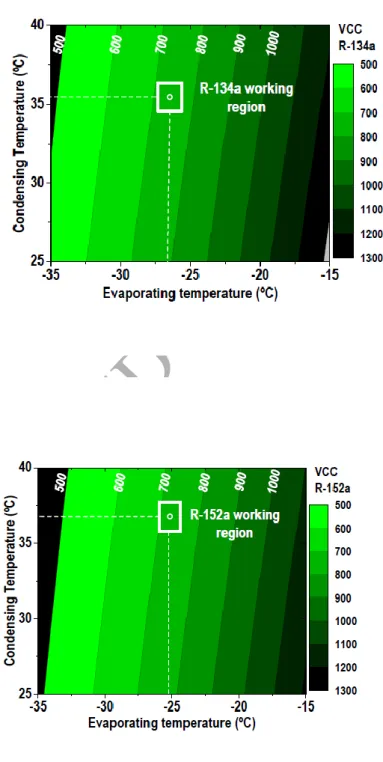
The theoretical approach, summarised in Fig. 3, indicated that for a refrigerator working with a non-adiabatic capillary tube, for coincident evaporating and condensing temperatures, the use of R-152a instead of R-134a would present nearly equivalent COP values but reduced volumetric cooling capacity. However, the optimal refrigerant mass charge of R-152a (90 g), has led the cycle to operate at higher evaporating and condensing temperatures than 101 g R-134a, as analysed during its cycling operation.
If time-averaged evaporating and condensing temperatures during the duty cycle (Fig. 6) are located in the theoretical VCC maps for both refrigerants according to Eq. 3 (Fig. 9), it can be observed that using 90 g R-152a leads the system to operate in a region with similar capacity than with R-134a. Concretely, the theoretical increase in VCC according to the maps is of 0.4%, what confirms the experimental results.
The same approach but considering the theoretical COP operation maps is presented in Figs. 9c and 9d. As it can be observed, the increased operating temperatures when using 90 g R-152a lead the cycle to also operate at higher COP values according to the theoretical COP maps. The combination of reduced duty cycle and the increment on COP will lead the refrigerator to operate with reduced energy consumption.
The change of the energy consumption during the cycling operation ( ) and during
the Post-defrost period ( ) have been evaluated in according to the following equation:
, E , , , , E , , 1 (9) , E , , , , E , , 1 (10)
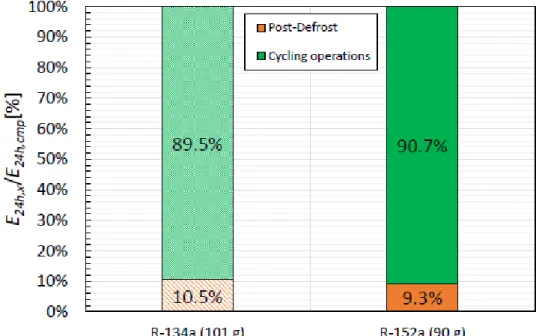
Similar values of electric power absorbed (±1%) and the reduction of the duty cycle after the drop-in of R-152a has led to decrease the daily electric energy consumption during ON/OFF periods of the system up to -6.2%. Furthermore, the reduction of the Post-defrost period has also lead the refrigerator to reduce by -17.8% the energy consumption during that period. Although this last value is higher, it needs to be highlighted that the Post-defrost phase has less impact on the overall energy consumption, as presented in Fig. 10, where it can be observed the percentage contribution of this phase concerning the total energy consumption of the refrigerator. It can also be seen in Fig. 10 that the use of 90 g R-152a even reduces the impact of the defrosting in the 24h operation about R-134a since the energy consumption proportion of this process is decreased in -1.2%.
By coupling the contributions of these two phases, the total reduction of the energy consumption reached with the substitution of 101 g R-134a with 90 g R-152a is equal to -61.1 Wh per day (-7.4%), of which -45.9 Wh is related to steady-state conditions.
Finally, assuming that the thermal load during the 24h tests ( , ) is constant for the
refrigerator working with both refrigerants, the overall COP during the 24h tests for both
refrigerants can be estimated using Eq. 11 and Eq. 12, where , and ,
are the energy consumptions of the system with R-134a and R-152a during 24h tests, respectively. Combining Eq. 11 and 12, the COP variation during the 24-hours operations can be quantified using Eq. 13.
ACCEPTED MANUSCRIPT
, , (11) , , (12) 4 , 1 4 4 , 1 4 , 1 1 (13)Solving Eq.13, a COP improvement of 8.0% is carried out with the drop-in of R-134 with 90 g R-152a, in line with the theoretical analysis (Fig.9).
The energy saving reported is a result strictly connected with the plant employed and with the experimental procedure used to define the right charge of R-152a. Besides, an energy saving is also obtainable using a reduced charge of refrigerant (starting from 83 g), that is a relevant note considering the flammability characteristics of R-152a. Furthermore, the drop-in of R-134a with R-152a allows to preserve the operative condition of the plant; hence a replacement could be made with no modifications of the cooling circuit. It is worthy to notice that the issue related to a higher discharge temperature of R-152a in comparison with that one of R-134a, discussed in the literature, is not evidenced. The latter could be explained considering that both the compressor and the condenser are cooled employing air-cooled convection.
Hence, bearing in mind the reduced GWP value of R-152a and the improvement of the performance of the plant, it can be said that such refrigerant may be one of the potential candidates to replace R-134a in domestic refrigerators equipped with a non-adiabatic capillary tube.
6. CONCLUSIONS
In this work, a theoretical and experimental comparison between R-134a and R-152a used in a domestic refrigerator has been reported.
The theoretical discussion has been carried out referring to systems equipped with adiabatic and with a non-adiabatic capillary tube at different values of evaporating and condensing temperatures. The changing of the COP and VCC values have been investigated. For systems with an adiabatic expansion device and same operating temperatures the theoretical approach showed that the substitution of R-134a by R-152a would obtain a benefit regarding COP and a slight reduction in VCC. However, the use of a non-adiabatic expansion system will equal the COP of the refrigerants and reduce the VCC of the cycle with R-152a.
By considering the test conditions and the apparatus analysed, the main results are summarised as follows:
The system preserves its behaviour after the drop-in of R-134a with R-152a, regarding
the temperature profiles inside the cabinet;
The identified right charge of R-152a, equal to 90 g (-10.9% in comparison with R-134a
charge) has allowed to reduce both daily energy consumption 7.4%) and pull-down time (-8.0%);
A reduction of duty cycle equal to -5.5% has occurred using R-152a, as well as a reduction of energy consumption during cycling operations of the plant (-6.2%);
The condensation pressure has reached a lower value with R-152a than that one
obtained with R-134a, as well as the compression ratio (8.6 bar against 9.3 bar);
The condensation temperature has been a little higher with R-152a (37 °C against 36
°C)
ACCEPTED MANUSCRIPT
Regarding the COP and the VCC, a good agreement between the experimental and the theoretical investigation has been noticed:
The COP value of the plant has increased by 8.0% with R-152a;
R-152a has led to a little higher VCC (+0.4%).
Also, the satisfying results achieved with the drop-in allow the manufacturers to convert their product easily without to re-design their industrial process in addition to adopt new items. In the same time, the manufacturer can realise a product with a better environmental impact and a good energy saving, which is safer than the HC ones.
In conclusion, R-152a can be used as a drop-in replacement of R-134a in domestic refrigerators already in use owing that the system guarantees the security constraints related to the use of an A2 refrigerant. In this case, the use of R-152a would allow obtaining an 89.4% reduction in GWP of the refrigerant, a reduction of the total refrigerant charge and a reduction of the energy consumption of the system; thus, the use of R-152a must be considered for this kind of application.
REFERENCES
Aprea, C., Greco, A., Maiorino, A., 2017. An experimental investigation of the energetic performances of HFO1234yf and its binary mixtures with HFC134a in a household refrigerator. Int. J. Refrig. 76, 109–117. https://doi.org/10.1016/J.IJREFRIG.2017.02.005 ASHRAE, 2016. Designation and safety classification of refrigerants. ANSI/ASHRAE Stand.
34-2016.
Bittle, R.R., Stephenson, W.R., Pate, M.B., 1995. Experimental evaluation of capillary tube-suction line heat exchanger performance with HFC-152a. ASHRAE Trans. 1 ed 124–135.
Bittle, R.R., 1994. An experimental evaluation of capillary tube- suction line heat exchanger performance with alternative refrigerants HFC-134a and HFC-152a 193.
Bolaji, B.O., 2010. Experimental study of R152a and R32 to replace R134a in a domestic refrigerator. Energy 35, 3793–3798. https://doi.org/10.1016/j.energy.2010.05.031
Bryson, M., Dixon, C., St Hill, S., 2011. Testing of HFO-1234yf and HFC-152a as mobile air conditioning refrigerant replacements. Ecolibrium 30–38.
Cabello, R., Sánchez, D., Llopis, R., Arauzo, I., Torrella, E., 2015. Experimental comparison between R152a and R134a working in a refrigeration facility equipped with a hermetic compressor. Int. J. Refrig. 60, 92–105. https://doi.org/10.1016/j.ijrefrig.2015.06.021 Ghodbane, M., 1999. An investigation of HFC-152a and hydrocarbon refrigerants in mobile air
conditioning. In: International Congress and Exposition. SAE Tech. Pap.
Godwin D., Hourahan G. C., S.S.R., 1993. Materials compatibility and lubricants research on CFC-refrigerant substitutes. Q. MCLR Progr. Tech. Report, Dep. Energy, US
(http://infohouse.p2ric.org/ref/22/21162.pdf).
ISO 15502:2005, 2005. ISO 15502:2005. Household refrigerating appliances -- Characteristics and test methods.
Kim, M.H., Shin, J.S., Park, W.G., Lee, S.Y., 2008. The Test Results of Refrigerant HFC-152a in an Automotive Air-Conditioning System., in: SAE 9th Alternative Refrigerant Systems Symposium, Advanced Institute of Science and Technology, Korea.
Lemmon, E.W., Huber, M.L., McLinden, M.O., 2013. NIST Standard Reference Database 23. Natl. Inst. Stand. Technol.
Pannock, J., Liu, Z., Radermacher, R., Yu, K., 1994. Evaluation of R-134a and R-152a as working fluids in a domestic refrigerator/freezer, in: ASHRAE Transactions.
Sánchez, D., Cabello, R., Llopis, R., Arauzo, I., Catalán-Gil, J., Torrella, E., 2017. Évaluation de la performance énergétique du R1234yf, du R1234ze(E), du R600a, du R290 et du R152a comme
ACCEPTED MANUSCRIPT
alternatives à faible GWP au R134a. Int. J. Refrig. 74, 267–280. https://doi.org/10.1016/j.ijrefrig.2016.09.020
Sanvordenker, K.S., 1992. HFC-152a versus HFC-134a in domestic refrigerator freezer -- Energy advantage or Energy penalty. Univ. P. (Ed.), Int. Refrig. air Cond. Conf. Purdue Univ. Purdue, EEUU.
The European Commission, 2014. Regulation (EU) No 517/2014 of the European Parliament and of the Council of 16 April 2014 on fluorinated greenhouse gases and repealing Regulation (EC) No 842/2006. https://doi.org/https://doi.org/10.4271/1999-01-0874
The European Commission, 2006. Directive 2006/40/EC of the European Parliament and of the Council of 17 May 2006 relating to emissions from air conditioning systems in motor vehicles and amending Council Directive 70/156/EEC.
UNEP, 2016. Report of the Twenty-Eighth Meeting of the Parties to the Montreal Protocol on Substances that Deplete the Ozone Layer, Kigali, Rwanda.
ACCEPTED MANUSCRIPT
Figure 2. COP (a) and VCC (b) ratio between R-152a and R-134a with adiabatic expansion device. in Eq. Eq.2
ACCEPTED MANUSCRIPT
Figure 3. COP (a) and VCC (b) ratio between R-152a and R-134a with non-adiabatic expansion device. . in Eq. 2
ACCEPTED MANUSCRIPT
ACCEPTED MANUSCRIPT
Figure 5. Refrigerant temperature profiles at different points of the plant during a sample of a 24h test (a) R-134a and b) R-152a). Green and red arrows indicate the ON and the OFF phase of the compressor, respectively. For a more efficient view refer to the online version.
ACCEPTED MANUSCRIPT
Figure 6. Time percentage distribution during the ON time of the compressor with 101 g of R-134a and 90 g of R-152a: a) Evaporating temperature, b) Condensing temperature, c) Evaporating pressure, d) Condensing pressure
ACCEPTED MANUSCRIPT
Figure 7. Time distribution of the discharge temperature during the ON time of the compressor with 101 g of R-134a and 90 g of R-152a
ACCEPTED MANUSCRIPT
Figure 8. Evaporating Temperature (a) and Condensing Temperature (b) during the post-defrost cycle with 101 g of R-134a and 90 g of R-152a
ACCEPTED MANUSCRIPT
ACCEPTED MANUSCRIPT
Figure 10. The contribution of the Post-Defrost phase and cycling operations to the overall daily energy consumption. For a more efficient view refer to the online version.
ACCEPTED MANUSCRIPT
Table 1. Main thermodynamic, safety and environmental properties of R-134a and R-152a
Fluid Chemical formula P
crit Tcrit M NBP νv * λ* VCC*
Safety Group
LFL RCL HOC GWP1
(bar) (°C) (kg·kmol1) - (ºC) (m13) ·kg- (kJ·kg1) - (kJ·m3) - (%) (g·m3) - (MJ·kg1) - WGI-AR51
R-152a CH3CHF2 45.17 113.3 66.05 24.0 - 0.309 330.78 737.2 A2 4.8 32 17.4 138
R-134a CH2FCF3 40.59 101.1 102.03 26.1 - 0.182 216.26 741.0 A1 none 210 4.2 1300
1Working Group I contribution to the IPCC Fifth Assessment Report (ASHRAE, 2016; Lemmon et al., 2013) *properties evaluated for an ideal vapour compression cycle at To=-25ºC and Tk=35ºC
Table 2. Main components of the refrigerator and their characteristics
Component Type Characteristic Value
Compressor Hermetic,
Air forced cooled Swept volume Oil
Nominal Electrical Power (at
n=4000 rpm)
6.16 cm3
POE 68 143 W
Condenser Air forced
cooled, Roll-welding
External
diameter of the tube 4.86 mm
Expansion
system capillary tube Non-adiabatic diameter Internal 0.80 mm
Evaporator Air forced
cooled, Finned tube
External
diameter of the tube 6.10 mm
Table 3. Technical specifications of the instrumentation used
Transducers Range Uncertainty
PT100 4-wires -100-500 °C ±0.15 °C
Humidity sensor -100-70 °C / 0-100 % ±0.15 °C / ±1.0%
Piezoelectric absolute 1-10 bar ±0.2%
Pressure gauge 1-30 bar ±0.5% F.S.
Energy meter 0-1 MWh ±1%
ACCEPTED MANUSCRIPT
-27-
Table 4. Main results carried out during the pull-down, the cycling operations (24 h), and the post defrost cycles. R-134a (101 g) R-152a (77 g) R-152a (80 g) R-152a (83 g) R-152a (85 g) R-152a (90 g) R-152a (93 g) Pul l-d own tpd [min] 102.1 107.7 100.4 96.1 95.8 93.9 92.2 (+5.5%) (-1.7%) (-5.9%) (-6.2%) (-8.0%) (-9.7%) Pel,pd,ave [W] 119.2 116.0 119.8 120.4 120.3 120.4 120.3 (+2.7%) (+0.5%) (+1.0%) (+0.9%) (+1.0%) (+0.9%) Pel,pd,max [W] 143.1 155.5 162.8 173.9 173.9 174.8 177.3 (+8.7%) (+13.8%) (+21.5%) (+21.5%) (+22.2%) (+23.9%) Epd [Wh] 202.8 207.9 200.4 193.5 191.8 188.4 184.8 (+2.5%) (-1.2%) (-4.6%) (-5.4%) (-7.1%) (-8.9%) 24h δcmp [%] 65.6% 70.4% 67.7% 63.4% 62.1% 61.6% 61.1% (+7.3%) (+3.1%) (-3.4%) (-5.4%) (-6.2%) (-6.9%) Pel,ave,cmp [W] 48.8 48.2 48.7 48.9 49.1 48.7 49.4 (-1.2%) (-0.2%) (+0.1%) (+0.6%) (-0.2%) (+1.2%) E24h,cmp 830.1 869.6 853.8 799.6 789.8 768.8 787.4 (+4.8%) (+2.9%) (-3.7%) (-4.9%) (-7.4%) (-5.1%) Post De fr ost C yc le tPDC [s] 94.3 - - - - 71.0 - (-24.7%) Pel,PDC,ave [W] 55.4 - - - - 60.5 - (+9.2%) EPDC [Wh] 87.1 - - - - 71.6 - (-17.8%)