2021-02-26T17:24:52Z
Acceptance in OA@INAF
AGN feedback on molecular gas reservoirs in quasars at z~2.4
Title
Carniani, S.; Marconi, Alessandro; Maiolino, R.; Feruglio, Chiara; Brusa, M.; et al.
Authors
10.1051/0004-6361/201730672
DOI
http://hdl.handle.net/20.500.12386/30661
Handle
ASTRONOMY & ASTROPHYSICS
Journal
605
Number
A&A 605, A105 (2017) DOI:10.1051/0004-6361/201730672 c ESO 2017
Astronomy
&
Astrophysics
AGN feedback on molecular gas reservoirs in quasars at z
∼
2.4
S. Carniani
1, 2, A. Marconi
3, 4, R. Maiolino
1, 2, C. Feruglio
5, M. Brusa
6, 7, G. Cresci
4, M. Cano-Díaz
8, C. Cicone
9,
B. Balmaverde
10, F. Fiore
11, A. Ferrara
10, S. Gallerani
10, F. La Franca
12, V. Mainieri
13, F. Mannucci
4, H. Netzer
14,
E. Piconcelli
11, E. Sani
16, R. Schneider
10, O. Shemmer
15, and L. Testi
13, 4, 171 Cavendish Laboratory, University of Cambridge, 19 J. J. Thomson Ave., Cambridge CB3 0HE, UK
e-mail: [email protected]
2 Kavli Institute for Cosmology, University of Cambridge, Madingley Road, Cambridge CB3 0HA, UK
3 Dipartimento di Fisica e Astronomia, Università di Firenze, via G. Sansone 1, 50019 Sesto Fiorentino (Firenze), Italy 4 INAF–Osservatorio Astrofisico di Arcetri, Largo E. Fermi 5, 50125 Firenze, Italy
5 INAF–Osservatorio Astronomico di Trieste, via G. Tiepolo 11, 34124 Trieste, Italy
6 Dipartimento di Fisica e Astronomia, Università di Bologna, viale Berti Pichat 6/2, 40127 Bologna, Italy 7 INAF–Osservatorio Astronomico di Bologna, via Ranzani 1, 40127 Bologna, Italy
8 Instituto de Astronomía, Universidad Nacional Autónoma de México, Apartado Postal 70-264, Mexico D.F. 04510, Mexico 9 INAF–Osservatorio Astronomico di Brera, via Brera 28, 20121 Milano, Italy
10 SNS – Scuola Normale Superiore, Piazza dei Cavalieri 7, 56126 Pisa, Italy
11 INAF–Osservatorio Astronomico di Roma, via Frascati 33, 00040 Monteporzio Catone, Italy
12 Dipartimento di Matematica e Fisica, Università Roma Tre, via della Vasca Navale 84, 00146 Roma, Italy 13 European Southern Observatory, Karl-Schwarzschild-str. 2, 85748 Garching bei München, Germany
14 School of Physics and Astronomy, The Sackler Faculty of Exact Sciences, Tel-Aviv University, 69978 Tel-Aviv, Israel 15 Department of Physics, University of North Texas, Denton, TX 76203, USA
16 European Southern Observatory, Alonso de Cordova 3107, Vitacura, Santiago, Chile 17 Excellence Cluster “Universe”, Boltzmannstr. 2, 85748 Garching bei München, Germany
Received 21 February 2017/ Accepted 26 June 2017
ABSTRACT
We present new ALMA observations aimed at mapping molecular gas reservoirs through the CO(3−2) transition in three quasars at z ' 2.4, LBQS 0109+0213, 2QZ J002830.4-281706, and [HB89] 0329-385. Previous [O
iii
]λ5007 observations of these quasars showed evidence for ionised outflows quenching star formation in their host galaxies. Systemic CO(3−2) emission has been detected only in one quasar, LBQS 0109+0213, where the CO(3−2) emission is spatially anti-correlated with the ionised outflow, suggesting that most of the molecular gas may have been dispersed or heated in the region swept by the outflow. In all three sources, including the one detected in CO, our constraints on the molecular gas mass indicate a significantly reduced reservoir compared to main-sequence galaxies at the same redshift, supporting a negative feedback scenario. In the quasar 2QZ J002830.4-281706, we tentatively detect an emission line blob blue-shifted by v ∼ −2000 km s−1with respect to the galaxy systemic velocity and spatially offset by 0.200(1.7 kpc) with respect to the ALMA continuum peak. Interestingly, such emission feature is coincident in both velocity and space with the ionised outflow as seen in [O
iii
]λ5007. This tentative detection must be confirmed with deeper observations but, if real, it could represent the molecular counterpart of the ionised gas outflow driven by the Active Galactic Nucleus (AGN). Finally, in all ALMA maps we detect the presence of serendipitous line emitters within a projected distance ∼160 kpc from the quasars. By identifying these features with the CO(3−2) transition, we find that the serendipitous line emitters would be located within |∆v| < 500 km s−1from the quasars, hence suggesting an overdensity of galaxies in two out of three quasars.
Key words. galaxies: high-redshift – quasars: individual: LBQS 0109+0213 – galaxies: evolution – quasars: emission lines –
quasars: individual: 2QZ J002830.4-281706 – quasars: individual: [HB89] 0329-385
1. Introduction
Both the growth of super-massive black holes (SMBHs) and star formation history of galaxies are regulated by the supply of cold gas available in the host. The molecular gas reservoir can be re-plenished through either accretion of cold gas from the halo or wet mergers.
Intense bursts of star formation, such as those observed in sub-millimetre galaxies (SMGs), and in the host galaxies of pow-erful active galactic nuclei (AGN) can be induced by mergers, interactions and disk instabilities (see, e.g.Alexander & Hickox 2012). Several studies have suggested that SMGs and quasars (QSOs) represent two distinct stages of galaxy evolution (e.g.
Hopkins et al. 2008). SMGs would correspond to the starburst
phase when galaxies are dust obscured and therefore emit mainly at far-infrared wavelengths. QSOs are unobscured sys-tems where the gas has been expelled by energetic outflows, which eventually quench both SMBH growth and star formation (SF) (Di Matteo et al. 2005).
The discovery of ubiquitous massive, powerful galaxy-wide outflows in QSO host galaxies supports the QSO feedback sce-nario depicted above. Studies based on millimetre observations of local QSO hosts have estimated molecular outflow mass-loss rates exceeding the star formation rates by almost two orders of magnitude in the most powerful sources (Cicone et al. 2014). Massive outflows can deplete the host galaxies of their cold gas content in approximately a few Myr, that is, on timescales even shorter than the depletion time scales due to gas consumption
Table 1. Properties of the three quasars from literature.
Ionised outflow properties
QSO z RA Dec Log10(LAGNerg/s) MBH SFR v R M[OIII] M˙[OIII]
[1010M ] [M yr−1] [km s−1] [kpc] [107M ] [M yr−1] (1) (2) (3) (4) (5) (6) (7) (8) (9) (10) (11) LBQS0109 2.35 01:12:16.99 +02:29:47.7 47.5 1.0 50 1850 0.4 1.2 60 2QZJ0028 2.40 00:28:30.42 –28:17:05.4 47.3 1.2 100 2300 0.7 3.8 140 HB8903 2.44 03:31:06.41 –38:24:04.6 47.5 1.3 90 1450 1.9 0.7 6
Notes. (1) ID of the object. (2) Redshifts estimated from the narrow [O
iii
]λ5007 emission (Carniani et al. 2015b). (3, 4) Coordinates (J2000.0). (5) AGN bolometric luminosities derived by using the relation LAGN∼ 6 λL(λ5100Å) fromMarconi et al.(2004). (6) Black hole masses from Shemmer et al.(2004) andWilliams et al.(2017). (7) SFR estimated from Hα emission (Carniani et al. 2016). (8, 9) [Oiii
]λ5007 Outflow velocity and inferred by using the spectro-astrometric method described inCarniani et al.(2015b). (10) Outflow masses inferred from [Oiii
]λ5007 by assuming Te∼ 104K and ne∼ 500 cm−3. (11) Outflow mass-loss rates calculated as ˙Mo= Mo/τdyn= Movo/Ro.by star formation (Maiolino et al. 2012; Cicone et al. 2014). However, although these observations are in overall agreement with AGN feedback models (see Fabian 2012, and references therein), we are still missing the smoking gun evidence that the AGN-driven outflows are effectively quenching star formation: what we are seeking is a clear and unambiguous indication that star formation is indeed inhibited in the galaxy regions swept by the outflows.
Several SINFONI/VLT observations of z ∼ 1.5−2.5 QSOs indicate the presence of fast, galaxy-wide ionised outflows with a conical morphology that are spatially anti-correlated with the brightest actively star forming region in the host galaxy (Cano-Díaz et al. 2012;Carniani et al. 2015b;Cresci et al. 2015;
Carniani et al. 2016). These results suggest that the fast winds are simultaneously expelling gas from the host galaxies and quenching star formation in the region swept by the outflow. However, we note that, at optical wavelengths, observations may be affected by differential extinction effects, and so we cannot fully rule out the presence of obscured emission powered by star formation in the region affected by the ionised outflow. In con-clusion, it is still debated whether the observed absence of star formation signatures in the outflow region is real and related to gas depletion by feedback or if it is caused by dust obscuration.
In this context, observations at (sub-)millimetre wavelengths are crucial to definitely establish whether star formation is inhib-ited by fast outflows. Through the carbon monoxide (CO) line emission we can directly trace the cold molecular gas that fuels the star formation activity, and thus confirm or reject negative-feedback scenarios.Brusa et al.(2015b) reported the detection of CO(3−2) emission with the IRAM Plateau de Bure Interfer-ometer (PdBI) in XID2028, one of the z ∼ 2 QSOs exhibit-ing spatial anti-correlation between narrow Hα emission, tracexhibit-ing star formation, and ionised AGN-driven outflows (Cresci et al. 2015). The modest molecular mass inferred from the CO(3−2) line detection indicates that the gas in the host galaxy has been already depleted or dispersed by QSO feedback. However the angular resolution (∼400) of these PdBI observations is not suf-ficient to spatially resolve the CO(3−2) emission in XID2028, hence not allowing an accurate determination of the location of the molecular gas reservoir with respect to the ionised outflow (Brusa et al. 2015b).
We have recently undertaken an Atacama Large Mil-limetre/submillimetre Array (ALMA) programme target-ing two QSOs of the sample by Carniani et al. (2015b),
LBQS0109+0213 (hereafter LBQS0109),
2QZJ002830.4-281706 (hereafter 2QZJ0028), and [HB89] 0329-385 (hereafter HB8903) in which the spatial distribution of their narrow Hα
and [O
iii
]λ5007 emissions with respect to the location of the [Oiii
]λ5007 outflow supports a negative-feedback scenario (Cano-Díaz et al. 2012; Carniani et al. 2016). The aim of the ALMA observations presented in this paper is to map the molecular gas in the host galaxies through the CO(3−2) emission (rest frequency νrest = 345.8 GHz) and comparethe spatial distribution of the molecular gas with that of the fast-outflowing ionised gas. The paper is organised as follows: Sect.2 describes the target properties, and Sect. 3summarises the ALMA observations. In Sects.4–6we present our results on LBQS0109, 2QZJ0028, and HB8903, respectively. A discussion of the molecular gas content in all host galaxies is included in Sect.7and, our conclusions are summarised in Sects.8and9.
In this work we adopt a ΛCDM cosmological model with
H0 = 67.3 km s−1Mpc−1, ΩM = 0.315, ΩΛ = 0.685
(Planck Collaboration XVI 2014). According to this model, 100
at z= 2.4 corresponds to a physical scale of 8.35 kpc.
2. Sample selection
The selected targets, LBQS0109, 2QZJ0028, and HB8903, are part of a large high-luminosity (L > 1047 erg/s) QSO sample at
z > 2 (Shemmer et al. 2004; Netzer et al. 2004), characterised by [O
iii
]λ5007 equivalent widths of EW > 10 Å and relatively bright in the H band, that is, H < 16.5 mag. The properties of the three targets are listed in Table1.To investigate the properties of the AGN-driven outflows, we have observed the three QSOs in the H (1.45−1.85 µm) and K (1.95−2.45 µm) bands with the Spectrograph for INtegral Field Observations in the Near Infrared (SINFONI) in seeing lim-ited mode (angular resolution ∼0.600). The kinematical analysis
of the [O
iii
]λ5007 emission line revealed fast (>1000 km s−1) ionised outflows extended a few kpc from the galaxy centre (Cano-Díaz et al. 2012;Carniani et al. 2015b). In addition, the nuclear spectrum of 2QZJ0028, which has also been recently observed with SINFONI assisted by adaptive optics (angular resolution ∼0.1500), is characterised by a broad, blueshifted Hβ absorption trancing nuclear outflowing gas with density higher than 109cm−3and velocity up to 10 000 km s−1(Williams et al. 2017).Intriguingly, the presence of extended outflows appears to be spatially anti-correlated with the narrow Hα emission compo-nent tracing star formation in the host galaxy (Cano-Díaz et al. 2012;Carniani et al. 2016). These results have been interpreted as evidence for negative feedback in action, where star forma-tion is quenched in the region where AGN-driven outflows in-teract with the host galaxy. If excluding dust-extinction effects,
the reduction of star formation activity in the outflow region can be caused by a lack of a substantial molecular gas reservoir, that may have been expelled by the outflow itself, or to heating and turbulence effects related to the feedback process that may lower the star formation efficiency of the gas.
3. Observations
LBQS0109, 2QZJ0028, and HB8903 were observed at the Band 3 frequencies (∼100 GHz, corresponding to λ ∼ 3 mm) with the ALMA array between July 2015 and July 2016. The on-source time was about 40 min with 40−44 12-m antennas for all sources. The antennas were distributed in a semi-compact configuration with a maximum baseline length of ∼1.5 km. The average precipitable water vapour (PWV) values during the ob-servations were 3 mm, 2.2 mm and 0.8 mmm for the three tar-gets, respectively.
The millimetre observations, carried out in frequency di-vision mode, have a total bandwidth of 7.5 GHz divided into four spectral windows of ∼1.875 GHz with a channel width of 1.9 MHz (∼5.7 km s−1). One of the four spectral windows was
tuned to the expected central frequency of the CO(3−2) line, that is, 103.2 GHz for LBQS0109, 101.6 GHz for 2QZJ0028, and 100.5 GHz for HB8903. The redshifts of the three QSOs were estimated from the narrow [O
iii
]λ5007 and Hα emission lines (Cano-Díaz et al. 2012;Carniani et al. 2016).The data were calibrated using the CASA software ver-sion v4.5.2 (McMullin et al. 2007). The phase calibrators were J0038-2459 and J0108+0135 for LBQS0109 and 2QZJ0028, re-spectively. Ceres and J0238+166 were used as flux calibrators, while bandpass calibrations were carried out through the obser-vations of J2258-2758 and J0238+1636. The flux, bandpass and phase calibrator for HB8903 was J0334-4008. All final images were reconstructed by using the CASA task
clean
.Continuum images at 3 mm were obtained using the line-free channels of the four spectral windows. By using a nat-ural weighting we achieved for all sources a sensitivity of 12 µJy/beam for the first two QSOs and 18 µJy/beam for HB8903. The final images have an angular resolution of about 0.600, which corresponds to 5 kpc at z ∼ 2.4, and a spatial scale per pixel of 0.100.
We subtracted the continuum emission by fitting an UV-plane model to the line-free channels of each spectral win-dow using the
uvcontsub
task. We generated the final cubes from the continuum subtracted data using theclean
task with the parameterweighting = briggs
androbust
= 0.5, which offers a compromise between high-resolution and highest sensi-tivity per beam. In all sources, we achieved a 1σ sensisensi-tivity of 240−280 µJy/beam per spectral bin of 30 km s−1 with a beam size of about 0.600× 0.500. The angular resolution of ALMAim-ages matches well that of the SINFONI observations (∼0.600). The source size and the flux density of the continuum emis-sion of the three sources are inferred by fitting a 2D elliptical Gaussian profile to the visibility data in CASA by using the
uvmodelfit
task. The line properties were estimated in theim-age plane instead.
In this work we are interested in comparing ALMA and SINFONI observations, hence we verified the astrometry ac-curacy of both datasets. The absolute positions of the QSOs in the ALMA field are consistent with the Sloan-Digital-Sky-Survey (SDSS) and Two-Micron-All-Sky-Sloan-Digital-Sky-Survey (2MASS) po-sitions within the astrometric uncertainty of about 0.100. As no
astrometric calibrations of SINFONI were observed for the three targets, we had to align the peak of the H- and K-band SINFONI
continuum emission with the centroid position obtained from 2MASS images in the same bands (H and K).
4. LBQS0109
The ALMA 3 mm continuum emission map of LBQS0109 is shown in panel (a) of Fig.1overlaid onto the SINFONI H-band continuum image. LBQS0109 has a flux density of 165 µJy and is detected at the ∼14σ level (σ= 12 µJy) in the ALMA contin-uum map.
The emission at 3 mm is spatially resolved with a beam-deconvolved size of (0.5±0.1)00×(0.3±0.2)00with PA= (85±11)◦
(Table2). We note that the emission is elongated in the same di-rection (east-west) of the ionised outflow traced by the broad [O
iii
]λ5007 component (Carniani et al. 2015b), which is indi-cated as a blue arrow in Fig.1a.The radio emission of log10(L8.4/W Hz−1) = 24.83 ± 0.22
at 8.4 GHz (Hooper et al. 1995) measured with the Very Large Array indicates that LBQS0109 is just below the limit to be clas-sified as radio-loud QSO (log10(L8.4/W Hz−1) > 25). Therefore
the elongated continuum emission at 3 mm may be associated with a radio jet co-spatial with the ionised outflow. However, two photometric measurements at 3 mm, which corresponds to λrest∼ 0.9 mm in the rest frame, and at 8.4 GHz (λrest∼ 10 mm),
are not sufficient to perform a spectral energy distribution (SED) fitting decomposition. Indeed a typical galaxy SED from radio-to-infrared wavelengths can be modelled as a linear sum of dust continuum, thermal bremsstrahlung and synchrotron emission (see in detailYun & Carilli 2002) but we would need more pho-tometric data to disentangle the various components. Therefore it is not possible to establish whether dust or synchrotron emis-sion dominates the sub-mm continuum in LBQS0109.
Assuming that the continuum emission at 3 mm is mainly associated with dust thermal emission, we estimated an upper limit on the dust content of LBQS0109. Since dust is rarely optically thick at millimetre wavelengths a part from a few extreme starburst galaxies (e.g. Soifer et al. 1999; Klaas et al. 2001;Matsushita et al. 2009), we have adopted the optically thin approximation for our unobscured QSO. The total dust mass is thus given by:
Mdust =
SνD2 L
Bν(Td)κν
, (1)
where Sν is the flux density at the rest frame frequency ν, DL
is the luminosity distance of the target, Bν(Td) is the black-body
function at the dust temperature Tdand κνis the absorption
coef-ficient. FollowingPalau et al.(2013), the equation can be simply rewritten as Mdust = 3.25 × 10⁹ M e0.048ν/Td− 1 ν3κ ν Sν mJy ! DL Mpc !2 , (2)
where the rest frame frequency ν is in GHz, κνis in cm2g−1and
Tdis in K. We adopt a κν= 0.45 × (ν/250 GHz)βcm2g−1with a
fixed emissivity index β = 2.0. We note that κνdepends on the
properties of dust grain and can suffer from large uncertainties. Using a dust temperature Td = 40−60 K (Beelen et al. 2006),
the dust mass from the 3 mm continuum emission is around 5−8×10⁸M
. We stress that the inferred dust mass is more likely
an upper limit because a fraction of the continuum emission in this wavelength band can be also associated to non-thermal syn-chrotron radiation.
In addition, the ALMA continuum map of the field sur-rounding LBQS0109 reveals the presence of three serendipitous
(a)
Background: SINFONI H-band
Contours: ALMA continuum
1h12m17.1s
17.0s
16.9s
2°29'49"
48"
47"
46"
RA [J2000]
Dec [J2000]
(b)
2.88 2.89 2.90Wavelegth [mm]
2.91 2.92 2.93 2.94 0.3 0.2 0.1 0.0 0.1 0.2 0.3 0.4 0.5Flux [mJy]
3000 2000 1000Velocity [km/s]
0 1000 2000 3000(c)
1h12m17.1s 17.0s 16.9s 2°29'49" 48" 47" 46" RA [J2000] Dec [J2000] 0.15 0.10 0.05 0.00 0.05 0.10 0.15 0.20Jy/beam km/s
Fig. 1.LBQS0109: a) white contours show the ALMA 3 mm continuum emission in correspondence of LBQS0109 at an angular resolution of 0.6400
× 0.5300
. Contours correspond to −2, 2, 3, 4 and 5 times the noise per beam (12 µJy). The colour background image shows the continuum emission in H band from SINFONI observations. The blue arrow indicates the direction of the ionised outflow revealed by the kinematic analysis of the broad [O
iii
]λ5007 line (Carniani et al. 2015a). b) CO(3−2) spectrum extracted from an aperture as large as the synthesised beam size of the ALMA observations and re-binned to 120 km s−1. The vertical green solid and dotted lines mark the expected CO(3−2) central wavelength basedon the redshift of the narrow Hα and [O
iii
]λ5007 component, respectively (Carniani et al. 2016). The dashed red curve shows the best fit Gaussian profile. c) CO(3−2) surface brightness map. Black solid contours are at the levels of 2σ, 3σ, 4σ and 5σ of the CO(3−2) flux map, where σ is 0.03 Jy/beam km s−1. The 2σ negative contours are indicated by the black dashed curves. The synthesised beam is shown in the bottom-left cornerof the map.
Table 2. Millimetre properties of LBQS0109, 2QZJ0028 and HB8903.
LBQS0109 2QZJ0028 HB8903 σ3mm[µJy/beam] 12 12 18 S3mm[µJy] 160 ± 16 168 ± 14 5692 ± 12 Major-axis3 mm[00]a 0.5 ± 0.1 – 0.102 ± 0.006 Axis-ratio3 mma 0.5 ± 0.4 – 1.00 ± 0.06 PA3 mm[◦]a 85 ± 11 – −90 ± 60 Mdust[109 M ]b 0.5–0.8 0.6–0.9 20–30 λCO(3−2)[mm] 2.9094 ± 0.0004 – – zCO(3−2) 2.3558 ± 0.0005 – – FWHMCO(3−2)[km s−1] 400 ± 60 – – SCO(3−2)∆v [Jy km s−1]c 0.34 ± 0.03 <0.09 <0.08 L0 CO(3−2)[10 10K km s−1pc2]c 1.04 ± 0.33 <0.3 <0.3 LCO(3−2)[107L ]c 1.4 ± 0.2 <0.4 <0.3 Mgas(αCO= 0.8) [1010 M ]c,d 0.8 ± 0.5 <0.2 <0.2 Mgas(αCO= 4) [1010M ]c,d 4.0 ± 2.4 <1.2 <1.0
Notes.(a)Beam-deconvolved size estimated in the UV-plane by using the
UVMODELFIT
task.(b)Under the assumption that the continuumemission at 3 mm is completely associated to thermal dust continuum emission. We assume a Td= 40–60 K and a β = 2.0.(c)For 2QZJ0028 and
HB8903, we assume a line width of 400 km s−1and the upper limits correspond to a 3σ level.(d)Assuming a r
31= 1.0 ± 0.5. The statistical errors
sources within 1500(∼120 kpc) from the QSO and with a signal-to-noise ratio (S /N) > 4. The three sources are also visible with a level of confidence >5σ in the line channels. By assuming that the line emission detected at the positions of these sources cor-responds to the CO(3−2) transition, we propose that they are physically associated with LBQS0109, with a∆z = 0.002. The properties inferred from the analysis of these serendipitous de-tections are reported in AppendixA. The three detections do not have optical counterparts in the SDSS images. A detailed discus-sion of this over-density system is presented in Sect.8.
The CO(3−2) spectrum of LBQS0109 is shown in Fig.1b, and the vertical green dotted line shows the expected cen-tral wavelength corresponding to the redshift measured from the SINFONI data by using the narrow [O
iii
]λ5007 emission. The full-width at half maximum (FWHM) and centroid of the CO(3−2) line in LBQS0109, derived from a single Gaussian fit, are 400 ± 60 km s−1and λobs= 2.9094 ± 0.0004 mm (zCO(3−2)=2.3558 ± 0.0005). We note that both the FWHM and the redshift are consistent with the narrow [O
iii
]λ5007 and Hα components (FWHM[OIII]= 490 ± 90 km s−1, FWHMHα= 250 ± 200 km s−1,z[OIII] = 2.3558 ± 0.0008, and zHα = 2.357 ± 0.002) tracing SF
in the host galaxy (Carniani et al. 2016). The agreement strongly indicates that most of the CO emission is tracing molecular gas in the host galaxy.
Panel (c) of Fig. 1 shows the map integrated over the line emission in which the peak is detected at ∼7σ (σ = 0.03 Jy/beam km s−1). The integrated flux, extracted from the region of the map with a level of confidence higher than 2σ, is SCO(3−2)∆v = 0.34 ± 0.03 Jy km s−1, corresponding to a line
luminosity of LCO(3−2)= (1.4 ± 0.2) × 107 L at z = 2.35. The
CO line emission is spatially resolved with an estimated size of (0.93 ± 0.08)00× (0.82 ± 0.07)00, that is (7.7 ± 0.7) kpc × (6.8 ±
0.6) kpc.
Although the CO(3−2) line emission is resolved by our ALMA observations, we cannot perform a detailed pixel-by-pixel kinematic analysis because of the low S/N of the data. However, we note that the CO line extracted in the southern re-gion has a FWHM = 280 km s−1that is smaller than that
mea-sured in the nuclear region (see Table 1). This discrepancy will be discussed in more detail in Sect.4.2.
4.1. Molecular and stellar mass estimates
Consistently with recent high-redshift (z > 2) observations of AGN host galaxies (Sharon et al. 2016), we assume an r31 ≡
L0CO(3−2)/L0CO(1−0) ratio of, r31 = 1.0 ± 0.5, yielding an
esti-mated CO(1–0) line luminosity of, L0
CO(1−0) = (1.0 ± 0.6) ×
1010K km s−1pc2for LBQS0109.
The conversion factor αCO between CO(1-0) line
luminos-ity and H2mass depends on the interstellar medium conditions.
In general an αCO = 4 M /K km s−1 pc2 is assumed for
main-sequence (MS) galaxies and an αCO = 0.8 M /K km s−1 pc2
value is adopted for compact luminous systems, such as star-burst galaxies, SMGs and QSOs (Downes & Solomon 1998;
Carilli & Walter 2013;Bolatto et al. 2013). Since the molecular ISM conditions of our targets are still unknown, we estimate two limiting values for the molecular gas mass (Mgas), corresponding
to the two αCOchoices mentioned above. The resulting Mgas
val-ues are listed in Table 2 and their associated statistical errors include both ALMA flux calibration and r31uncertainties.
We now explore the consequences of the possibility that the host galaxy of LBQS0109 lies on the main sequence (MS) of star forming galaxies. Typical MS galaxies at z ∼ 2 have
E N
Fig. 2.Left: CO(3−2) spectra extracted from four regions (shown in right panel) placed at different positions with respect to the location of the QSO. The spectra have been rebinned to a channel size of 120 km s−1. The CO line emission is faint or absent in the lower-right
spectrum which was extracted from a region south-west of the QSO. Right: CO(3−2) map and contours at the same level of Fig. 1c. The black dotted squares correspond to the regions from where we extracted the four spectra shown in the left panel. The beam of the CO(3−2) map is shown in the bottom-right corner.
molecular gas fractions of fmol−gas = Mgas/(Mgas+M?) ' 0.44
(Tacconi et al. 2010). For LBQS0109 and assuming αCO =
4 M /km s−1pc2, this gas fraction would result in a stellar mass
estimate of, M?= 1.3 × 10¹¹ M . This M?value, combined with
the BH mass of MBH = 1010 M inferred by Shemmer et al.
(2004), yields for LBQS0109 MBH/M? ' 0.1. This ratio is
much larger than those observed in massive galaxies in the lo-cal Universe (Kormendy & Ho 2013). A similar MBH/M? has
been recently inferred byTrakhtenbrot et al.(2015) for an un-obscured AGN at z = 3.328, CID947, where it is believed that the SMBH has grown more efficiently than the host galaxy. In LBQS0109 the star-formation activity may have been shut-off due to the negative-feedback exerted by the QSO, as we further argue below. It is also possible of course that the host galaxy of LBQS0109 is not on the z ∼ 2 MS, in which case the above estimate of MBH/M?would not be valid.
4.2. Morphology of the CO(3–2) emission
The CO(3−2) map of LBQS0109 shown in Fig. 1c exhibits a complex morphology: the molecular emission is not distributed symmetrically around the QSO. Figure 2 shows the CO(3−2) spectra extracted from four regions placed at different positions with respect to the location of the QSO. The CO(3−2) emission in the south-west region is almost absent, while the line spec-tra exspec-tracted from the other three regions have similar fluxes and profiles. We note that the synthesised beam is oriented from north-east to south-west. Thus, the signal visible towards the west and south relative to centre suggests that the molecular emission the molecular emission is either spatially unresolved or faint along the direction of the ALMA beam.
In the left panel of Fig. 3 we compare the distribution of CO(3−2) with the velocity map of the broad blue-shifted [O
iii
]λ5007 component tracing the ionised outflow in the QSO host galaxy (Carniani et al. 2015b,2016). The CO(3−2) emis-sion is partially dislocated with respect to the regions where the outflow traced by [Oiii
]λ5007 is fastest. In addition, the [Oiii
]λ5007 channel map, obtained integrating the continuum subtracted SINFONI datacube on the blue wing, indicates that the ionised outflow is elongated from north-east to south-west (cyan contours in the middle panel) where the CO(3−2) emission is faint (or spatially unresolved). Finally, the right panel of Fig.3Background: [OIII]5007 vel. map Contours: CO(3-2) 1h12m17.0s 2°29'48.5" 48.0" 47.5" 47.0" 46.5" RA [J2000] Dec [J2000]
Background: ALMA continuum
Contours: CO(3-2)
Contours: blue [OIII] wing
1h12m17.0s 2°29'48.5" 48.0" 47.5" 47.0" 46.5" RA [J2000] Dec [J2000]
Background: narrow [OIII] Contours: CO(3-2) 1h12m17.0s 2°29'48.5" 48.0" 47.5" 47.0" 46.5" RA [J2000] Dec [J2000]
Fig. 3.LBQS0109: from left to right: [O
iii
]λ5007 velocity map by Carniani et al. (2015b), ALMA continuum map at 3 mm, and narrow [OIII] emission tracing SF in the host galaxy (Carniani et al. 2016). White contours trace the flux map of CO(3−2) emission at the levels 3, 4 and 5σ. The red cross indicates the centroid of the H-band continuum emission. The cyan contours in the middle panel shows the flux map of the blue [Oiii
]λ5007 wings collapsing the SINFONI cube over the velocity range −1750 < v < −1950 km s−1.shows the surface brightness of the narrow [O
iii
]λ5007 compo-nent tracing SF in the LBQS0109 host galaxy and the CO(3−2) flux map in white contours. We refer to Carniani et al. (2016) for further arguments supporting the identification of the narrow [Oiii
]λ5007 emission with emission powered by star formation in the quasar host galaxy. It is interesting to note a similarity between the CO and the narrow [Oiii
]λ5007 surface brightness distributions. Both emission lines are faint or absent along the direction of the ionised outflow, while they are clearly visible in the other regions. These results support a scenario in which fast outflows are cleaning up the galaxy of its molecular gas, hence quenching SF in the region where the outflow breaks in the host galaxy ISM.In Sect.4we noted that the CO(3−2) profile extracted from an aperture placed south of the QSO (see Fig.1) is narrower than that observed in the nuclear region. Such a discrepancy suggests that the motion of the gas in the external regions is less turbulent than in the QSO centre which is influenced by the nuclear fast winds. This residual gas fuels the SF in the region of the host galaxy is not affected by AGN-driven outflows.
The current ALMA CO(3−2) observations trace molecular gas only in region within 2 kpc from the centre, while the nar-row [O
iii
]λ5007 component is extended up to ∼8 kpc. Unfortu-nately, higher sensitivity ALMA observations would be needed to compare the distribution of molecular gas and [Oiii
]λ5007 emission in the external regions at a distance >2 kpc from the QSO, and to verify whether the extended structures are consis-tent with the Schmidt-Kennicutt relation between SFR and gas density (Kennicutt 1998).5. 2QZJ0028
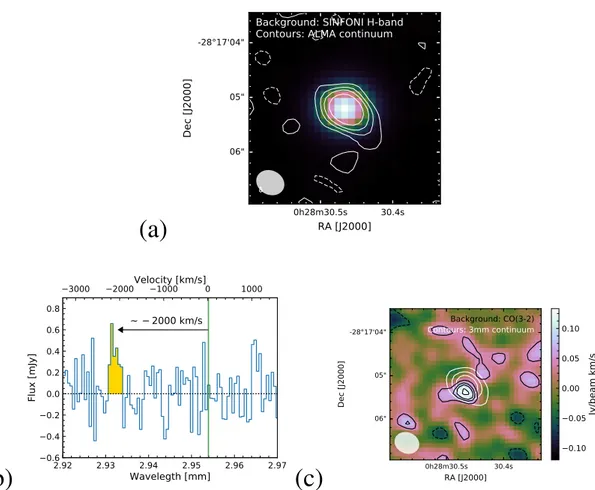
Panel (a) of Fig.4 shows in white contours the spatially unre-solved continuum emission map of 2QZJ0028at 3 mm, while the coloured background is the SINFONI continuum emission in the Hband. The peak at 3 mm has a S /N = 14 and the integrated flux density of the source is 170 ± 12 µJy.
We cannot perform a radio-to-FIR SED fitting decomposi-tion because we have only one photometric point. However, by assuming that the emission at 3 mm is mainly associated to dust thermal emission we can infer the dust mass as we did for LBQS0109 in Sect.4. We thus estimate Mdust = 6−9 × 10⁸M
We have performed a blind search in the ALMA continuum map around the QSO and we have detected a millimetre contin-uum source with a confidence level of 5σ and a flux density of
61 µJy at 3 mm. Such source is located at a distance of 118 kpc from the quasar (AppendixA).
At the redshift of 2QZJ0028 we do not detect any CO(3−2) emission line at a significance level higher than 3σ (panel (b) Fig.4). By assuming a CO line width similar to that measured in LBQS0109 (FWHM= 400 km s−1), we can estimate a 3σ up-per limit on the CO(3−2) integrated line flux of 0.09 Jy km s−1,
which corresponds to an upper limit on the CO(3−2) line lu-minosity of 0.6 × 10⁷ L
. Following the same method as in
Sect. 4.1, we derive two different 3σ upper limit estimates for the total molecular gas mass, based on different αCO
prescrip-tions: MCO(αCO = 0.8) < 0.2 × 10¹⁰ M and MCO(αCO= 4) <
1.2 × 10¹⁰M .
5.1. Possible association of offset CO(3–2) emission with a molecular outflow
The total spectrum extracted at the location of 2QZJ0028 from a beam-sized aperture shows an emission feature at a velocity of ∼−2000 km s−1relative to the expected CO(3−2) frequency based on the QSO redshift (Fig.4b). Figure4 (panel c) shows the map extracted from the spectral range centred at 2.9316 mm (∼−2000 km s−1) and with a spectral width of 250 km s−1. This map clearly shows an unresolved source whose peak is detected with S /N= 5.2 and is spatially offset by ∼0.200(1.3 kpc) towards south-east relative to the QSO centre. Although we cannot com-pletely rule out that this detection is spurious, we note that (as discussed in Appendix A) the number of positive peaks at >5σ is 1.5 times larger than the number of negative peaks, suggesting that one third of the positive peaks might represent real sources. Similarly, the emission feature at ∼1000 km s−1 should not be
considered as real because in the integrated map the emission peak has a S/N of only 3.8; at that S/N the number of positive peaks is similar to that of negative ones, strengthening the idea that it is simply a noise fluctuation. In any case, deeper observa-tions are needed to confirm the reliability of our CO detection at the velocity of ∼−2000 km s−1.
Under the assumption that such detection is real and associ-ated to the CO(3−2) transistion, Table3summarises the prop-erties of the line. Both the central velocity and the positional offset of the blue-shifted CO feature are consistent with the ve-locity (∼2300 km s−1) and location of the ionised outflow traced by the broad [O
iii
]λ5007 emission. This is clearly shown in left panel of Fig.5where we compare the flux map of this tentative CO(3−2) component with the ionised gas velocity map obtained(a)
Background: SINFONI H-band
Contours: ALMA continuum
0h28m30.5s 30.4s -28°17'04" 05" 06"
RA [J2000]
Dec [J2000]
(b)
2.92 2.93 Wavelegth [mm]2.94 2.95 2.96 2.97 0.6 0.4 0.2 0.0 0.2 0.4 0.6 0.8 Flux [mJy] 2000 km/s 3000 2000Velocity [km/s]1000 0 1000(c)
Background: CO(3-2) Contours: 3mm continuum 0h28m30.5s 30.4s -28°17'04" 05" 06" RA [J2000] Dec [J2000] 0.10 0.05 0.00 0.05 0.10 Jy/beam km/sFig. 4.2QZJ0028: a) white contours show the continuum emission from 2QZJ0028 at 3 mm with a bean of 0.6400
× 0.5300
. Contours are at the level of 3, 5 and 7 times the noise per beam (12 µJy). The color background image shows the continuum emission in H-band from SINFONI data of 2QZJ0028. b) ALMA spectrum extracted from an aperture as large as the beam size and rebinned to 60 km s−1. The vertical dashed green
line mark the expected positions for CO(3−2) emission line at the redshifted of the narrow Hα component (Cano-Díaz et al. 2012): the line is not detected. An emission line is detected at a velocity of ∼ −2000 km s−1with respect to the redshift of 2QZJ0028. c) CO(3−2) surface brightness.
Black solid contours are at the levels of 2σ, 3σ, 4σ and 5σ, where σ is 0.03 Jy/beam km s−1. The white contours show the continuum emission at
3 mm at the levels of 3, 6, and 9 times the sensitivity of the continuum map. The synthesised beam is shown in the bottom-left corner. Table 3. Properties of the faint blueshifted CO detection in 2QZJ0028.
λCO(3−2)[mm] 2.9316 ± 0.0004 FWHMCO(3−2)[km/s] 250 ± 90 SCO(3−2)∆v [Jy km s−1] 0.12 ± 0.02 L0 CO(3−2)[10 10K km s−1pc2] 0.37 ± 0.06 LCO(3−2)[107L ] 0.5 ± 0.1
from the SINFONI observations. Such a remarkable agreement strongly suggests that the blue-shifted CO(3−2) component de-tected by ALMA is real and that it traces a molecular outflow.
The middle panel of Fig. 5 shows the flux map of the CO(3−2) emission outlined over the ALMA continuum emis-sion (background image). In this panel, we plot the surface brightness of the broad [O
iii
]λ5007 emission line obtained by collapsing the SINFONI data-cube in a velocity range −2500 < v < −2300 km s−1, where our spectro-astrometrytechnique has revealed the presence of an extended outflow (Carniani et al. 2015b). The CO blueshifted emission overlaps with the blueshifted [O
iii
]λ5007 emission suggesting that we may be tracing an outflowing molecular component associated with the ionised outflow. The radius of the ionised outflow, es-timated by using the spectroastrometry method, is ∼0.7 kpc, which is consistent, within astrometric error (∼0.9 kpc), with the spatial offset (∼1.6 kpc) measured between the line and contin-uum emission at 3 mm.The non detection of CO emission at systemic velocity and the host galaxy position can be explained by the different ex-citation of the molecular gas in the star formation regions and in the outflow. For instance, from recent ALMA observations of a jet-driven molecular outflow, Dasyra et al. (2016) found that the CO(4−3) emission is more excited along the jet propaga-tion axis than in the rest of the galaxy disk. If the same excita-tion ratio describes the case of 2QZJ0028 then the emission at the systemic velocity would not be detected with our observa-tions. Blueshifted CO emission like our own without any coun-terpart at the systemic velocity has been detected in quasars by
Banerji et al.(2017). On the other hand, the non detection of CO emission at the systemic velocity may also indicate that a large fraction of the molecular gas in the host galaxy is accelerated by the AGN-driven outflow and the sensitivity of the current ALMA observations is not sufficient to detect the residual quiescent gas, even assuming the same excitation ratio for the outflow and star-formation regions. Future deeper ALMA observations of higher and lower rotational CO transitions are fundamental to confirm or rule out the hypothesis that the blue-shifted emission is real and traces molecular outflows in 2QZJ0028.
Outflowing clumps have already been observed by
Cicone et al.(2015) in a QSO at z ∼ 6.4 (SDSS J1148+5251). They find clumps of [CII] emission extended up to ∼30 kpc from the nucleus and with velocities >1000 km s−1. In addi-tion, the spectral fitting to the [CII] extended emission exhibits
Background: [OIII]5007 vel. map Contours: CO(3-2) 0h28m30.5s 30.4s -28°17'04.5" 05.0" 05.5" 06.0" RA [J2000] Dec [J2000]
Background: ALMA continuum
Contours: CO(3-2) Contours: blue [OIII] wing
0h28m30.5s 30.4s -28°17'04.5" 05.0" 05.5" 06.0" RA [J2000] Dec [J2000] Background: narrow H Contours: CO(3-2) 0h28m30.5s 30.4s -28°17'04.5" 05.0" 05.5" 06.0" RA [J2000] Dec [J2000]
Fig. 5.2QZJ0028: from left to right: [O
iii
]λ5007 velocity map by Carniani et al. (2015b), ALMA continuum map at 3 mm, and narrow Hα emission tracing SF in the host galaxy (Cano-Díaz et al. 2012). White contours trace the flux map of CO(3−2) emission at the levels 3, 4 and 5σ. The red cross indicates the centroid of the H-band continuum emission. The cyan contours in the middle panel shows the flux map of the blue [Oiii
]λ5007 wings collapsing the SINFONI cube over the velocity range −2500 < v < −2300 km s−1.the presence of narrow (σv ∼ 100−200 km s−1) and fast (v >
1000 km s−1) clumps similar to that observed in 2QZJ0028. In the local Universe, the presence of outflowing clumps of molec-ular gas has been revealed by CO(2−1) and CO(3−2) observa-tions of Markarian 231 (Fig. 1 byFeruglio et al. 2015), a QSO host and ultra-luminous IR galaxy (ULIRG) in the local Uni-verse, as well as in a few other nearby QSOs (e.g.Cicone et al. 2014). In several cases, the CO line profiles show the presence of a blue and red wing composed by several “bumps” with dif-ferent intensity and velocity. Such profiles may be generated by molecular outflows with a multi-clump morphology.
The sensitivity of our current ALMA observations is likely not sufficient to appreciate both the blue and red wings of the CO line as observed in local molecular outflows (e.g. Cicone et al. 2012;Feruglio et al. 2010,2015), but it allows us to marginally detect only the brightest knot of the clumpy molecular outflow. Since the velocity and the positional offset are consistent with those of the [O
iii
]λ5007outflow, we hypothesise that most of the blueshifted [Oiii
]λ5007 emission is co-spatial with the molec-ular outflow clump. We also note that the CO emission is lo-cated in the region where the Hα emission is missing (right panel of Fig.5). Such an anti-correlation supports the notion that the AGN-driven outflow drives gas out of the galaxy and exhausts the fuel necessary to SF.An alternative interpretation to the outflow scenario could be that the detected blue-shifted CO emission is associated with a merging companion galaxy. However, our SINFONI observa-tions (Cano-Díaz et al. 2012;Carniani et al. 2015b) do not show any merging signature. Additional data are required to further dismiss or validate this possibility.
6. HB8903
Figure 6a shows the 3 mm continuum emission of HB8903, which is detected with a high S/N of approximately 300. The total 3 mm flux density of the QSO is 5.738 ± 0.018 mJy (in-cluding calibration uncertainties) that is, about 30 times higher than that measured in the two previous QSOs (see Table 2). From a 2D-Gaussian fitting in the UV-plane we estimate a beam-deconvolved size of about 0.100.
HB8903 has been identified as a radio-loud
QSO (Shemmer et al. 2004) with a luminosity of log10(L8.4/WHz−1) ' 27.7 at 8.4 GHz (Healey et al. 2007).
Therefore, the 3 mm flux is probably dominated by synchrotron emission which does not allow us an estimate of the far-infrared emission associated with the dust. Similarly to the analysis
performed in the previous sections, we estimate an upper limit on the dust mass of Mdust = 2−3 × 10¹⁰ M , depending on dust
temperature.
The CO(3−2) line is not detected at the location of the QSO as shown in the panels (b) and (c) of Fig.6. To estimate a 3σ upper limit on the line flux, we assume a line width as large as that observed in LBQS0109 (FWHM= 400 km s−1) yielding
SCO(3−2)∆v < 0.08 Jy km s−1(Table2). We then infer an upper
limit on the molecular gas mass of Mgas(αCO = 0.8) < 0.2 ×
1010M
and Mgas(αCO= 4) < 1.0×10¹⁰M for the two different
CO-to-H2conversion factor, respectively.
In the ALMA field of view of HB8903, we also detect two additional sources with likely molecular line emission: one lo-cated 4.900 (∼40 kpc at z = 2.44) to the north-east of the QSO
and the other 16.600(∼140 kpc at z = 2.44) to the south-west of the QSO. The properties of these galaxies are discussed in AppendixA. As already observed in LBQS0109, even the QSO HB8903 could be located in a overdensity at z ' 2.4 (see Sect.8)
7. Lack of molecular gas
Figure7shows the best-fit relations bySargent et al.(2014) be-tween molecular gas mass and SFR for massive (M?> 1010M )
main-sequence galaxies and starburst at low and high redshift (z < 4). The SFRs of our three QSOs are estimated from the nar-row Hα emission (Cano-Díaz et al. 2012;Carniani et al. 2016) assuming a Chabrier initial mass function (Chabrier 2003). Since the Hα emissions are not corrected for reddening, the inferred SFRs are lower limits for both targets.
In the Mgas-SFR plane, all three sources are placed below the
relation extrapolated for star-forming galaxies. In fact, a main-sequence star-forming galaxy with SFR = 50 M yr−1 has a
molecular gas mass of Mgas = 4 × 10¹⁰ M that is similar to
Mgas(αCO= 4) of LBQS0109, but it is at least five times higher
if we assume a conversion factor αCO= 0.8 (see Table2). The
inferred molecular gas masses are comparable with the expecta-tion based onSargent et al.(2014).
We can estimate the depletion timescale, which is defined as the rate at which the gas is converted into stars: τdep =
Mgas/SFR. Because the SFR from Hα are lower limits, we
in-fer an upper limit of τdep < 160–800 Myr for LBQS0109,
τdep < 30–120 Myr for 2QZJ0028 and τdep < 20–110 Myr for
HB8903, depending on αCO. The depletion timescales are
sim-ilar to those observed in starburst and SMG galaxies (Yan et al. 2010;Bothwell et al. 2013) and reddened QSOs (Banerji et al. 2017) at z ∼ 2.5, suggesting that the three host galaxies may
(a)
Background: SINFONI H-band
Contours: ALMA continuum
3h31m06.5s 06.4s 06.3s -38°24'03" 04" 05" 06"
RA [J2000]
Dec [J2000]
(b)
2.96 2.97Wavelegth [mm]
2.98 2.99 3.00 0.3 0.2 0.1 0.0 0.1 0.2 0.3 0.4 0.5Flux [mJy]
2000 1000Velocity [km/s]
0 1000 2000(c)
3h31m06.5s 06.4s 06.3s -38°24'03" 04" 05" 06" RA [J2000] Dec [J2000] 0.10 0.05 0.00 0.05 0.10 Jy/beam km/sFig. 6.HB8903: a) white contours show the continuum emission from HB8903 at 3 mm with a beam of 0.6200
× 0.4600
(the synthesised beam is shown in the bottom-left corner). Contours are at the level of 25, 50, 100 and 200 times the noise per beam (18 µJy). The colour background image shows the continuum emission in H-band from SINFONI data of HB8903. b) ALMA spectrum extracted from an aperture as large as the beam size and rebinned to 120 km s−1. The vertical dashed and solid green line mark the expected positions for CO(3−2) emission line at the redshifted
of the narrow Hα and [O
iii
]λ5007 component, respectively (Carniani et al. 2016): the line is not detected. c) CO(3−2) map obtained by integrating the cube under the two vertical dotted line indicated in the panel b (i.e. −200 km s−1< v < 200 km s−1). Negative and positive contours are in stepsof 1σ, which is 0.027 Jy/beam km s−1. The synthesised beam is shown in the bottom-left corner.
10 100 1000 SFR [M /yr] 107 108 109 1010 1011 1012 1013 1014 Mga s [M ] MS STARBURST QSOs CO= 0. 8 M / K km/s pc2 CO= 4. 0 M / K km/s pc2 MS galaxies SB and SMG galaxies
Fig. 7.Inverse, integrated version of the Kennicutt-Schmidt relation be-tween SFR and molecular mass gas. The solid black line is the best-fit relation for MS galaxies and the dashed shows the relation of the star-burst galaxies (Sargent et al. 2014). Filled black circles corresponds to our three QSOs assuming a conversion factor αCO= 0.8 and open circles
are derived supposing a αCO= 4.
still be in a starburst phase and the star formation activity is not affected by AGN-driven outflows.
However the low molecular gas mass may also indicate that a fraction of the gas reservoir is expelled away from the galaxy by AGN-driven feedback, and, at the same time, the fast winds induce high pressure in the rest of the gas, triggering star for-mation in the region unaffected by AGN activity (Silk 2013). This scenario is similar to that observed in the QSO XID2028 at redshift z ∼ 1.5, where the presence of ionised outflow has been observed through [O
iii
]λ5007 emission (Brusa et al. 2015a; Perna et al. 2015; Cresci et al. 2015) and the small gas reservoir, respect to a MS star-forming galaxy with similar M?, is explained by negative-feedback (Brusa et al. 2015b). Also,Kakkad et al.(2017) have recently reported a lower gas fraction for a sample of AGN at z ∼ 1.5 compared with a sample of galax-ies without an AGN that is matched in redshift, stellar mass, and star-formation rate. In addition, Fiore et al. (2017) have found that the molecular gas depletion timescale and the molecular gas fraction of a sample of 15 galaxies hosting powerful AGN driven winds are between three and ten times smaller than those of main-sequence galaxies with similar star-formation rate, stel-lar mass and redshift. According to such negative-feedback sce-nario, the molecular gas should be removed in the host region with the high velocity outflow. Instead, the anti-correlation be-tween CO emission and ionised outflow direction indicates that a fraction of the gas has been already expelled from the galaxy.
Deeper ALMA observations will confirm this scenario also in 2QZJ0028.
Although the three QSOs have similar properties, such as SFR, LAGN, MBH, the CO(3−2) at the systemic velocity of the
host galaxies is visible only in one of the three targets. This dis-crepancy may be due to a different CO(3−2) excitation in the other two host galaxies. In 2QZJ0028 and HB8903 the CO(3−2) may be less excited than that in LBQS0109 and the current sensitivity is not sufficient to detect the emission line in the host galaxy. In addition the dense molecular clouds invested by AGN-driven wind develop Kelvin-Helmholtz instabilities (Hopkins & Elvis 2010;Ferrara & Scannapieco 2016). These in-stabilities develop shocks responsible for higher gas excitation likely resulting into the strong CO(3−2) blueshifted emission that we observe in 2QZJ0028. A similar result is recently re-ported by Dasyra et al.(2016) and Morganti et al. (2015) who observed CO(4−3) and CO(2−1) emission in a local Seyfert galaxy, IC 5063. Most of the CO(4−3) emission has been de-tected in the outflow regions, while the CO(2−1) is mainly emitted in the host galaxy location. In the outflow regions the CO(4−3)/CO(2−1) flux ratio approaches 16 (×3 higher than that observed in the rest of the host galaxy ). In this regard, we also note that CO observations in the distant Universe (z > 1) show that the CO spectral line energy distribution of normal star-forming galaxies are less excited than those of SMGs and QSOs. The ratio between mid-J and low-J CO transition mea-sured in SMGs and QSOs is higher than that observed in normal galaxies by a factor >1.5 (Carilli & Walter 2013;Gallerani et al. 2014;Mashian et al. 2015;Daddi et al. 2015).
8. Overdensity
ALMA observations have revealed the presence of six com-panion sources within a projected distance ∼160 kpc from the quasars (Appendix A). In five out of the six sources we also de-tect a line emission that may be identified with CO(3−2) tran-sition at similar redshifts of the QSOs. The CO(3−2) lines in these sources have luminosities of 0.6–23 K km s−1 pc2,
result-ing in a molecular masses of 0.5–90 × 1010 M that are even
higher than those measured in the QSOs themselves. The molec-ular mass and the high SFR (∼1000 M yr−1), inferred from the
continuum emission is comparable to those observed in star-bursts and submillimetre galaxies (SMGs). In one case, the line emission is even spatially resolved by the ALMA beam and the gradient of velocity indicates a dynamical mass of Mdyn =
2 × 10¹¹sin2(i), which is similar to those observed in high-z
SMGs (e.g.Carniani et al. 2013).
Recent galaxy evolution models predict that the rate of galaxy mergers and interactions increases in the redshift range 1 < z < 3, driving extreme starburst events and rapid ac-cretion onto the massive black holes in the galaxy centre (Di Matteo et al. 2005;Sijacki et al. 2011;Valiante et al. 2011). These predictions have been supported by new extragalactic sur-veys at millimetre and submillimetre ranges having uncovered a population of dusty star-forming galaxies at high redshift.
Silva et al.(2015) found an overdensity of submillimetre galax-ies in 17 out of 49 QSOs at redshift z ∼ 2. A similar scenario has been recently reported byBanerji et al.(2017) who detected two millimetre-bright galaxies within 200 kpc from a QSO at z = 2.5. An overdensity system is also observed in BR 1202-0725, which is mainly composed by a QSO and a submillime-tre galaxy at z ∼ 4.7 (Salomé et al. 2012; Wagg et al. 2012;
Carilli et al. 2013; Carniani et al. 2013; Williams et al. 2014).
Overall, these results support the hypothesis that submillime-tre galaxies and QSOs represent different stages of galaxy evo-lution after a merger (Carniani et al. 2013). The detections of massive companions sources in the ALMA field of view have been also observed in QSOs at higher redshifts (z ∼ 4.8−6;
Trakhtenbrot et al. 2017;Decarli et al. 2017) indicating that ma-jor mergers are important drivers for rapid early SMBH growth. The detections of these seredentipitous sources in our ALMA observations suggest that the three QSOs are located in a overdensity. Assuming that a SMBH of 1010 M
is associated
to a dark halo of mass of 1013 M (e.g.Ferrarese 2002), we
es-timate a virial radius of about 500 kpc for the three QSOs. This is larger than the projected distance between the QSOs and the serendipitous companions. We therefore conclude that the QSOs and the serendipitous sources may represent a complex merg-ing system at redshift z ∼ 2.3−2.5. Future millimetre observa-tions at different wavelength bands will confirm the redshift of the serendipitous galaxies and their nature.
9. Summary
We have presented new ALMA 3mm observations aimed at map-ping CO(3−2) in three z ∼ 2.4 quasars, LBQS0109, 2QZJ0028, and HB8903, showing evidence for ionised outflows quenching star formation (Cano-Díaz et al. 2012; Carniani et al. 2015b,
2016). Below, we summarise the main results of this work: – The ALMA observations reveal the presence of
serendipi-tous galaxies, three of those are detected both in continuum (at 3 mm) and in line emission, within a projected distance of 160 kpc from the QSOs. Assuming the emission line de-tected in these galaxies can identified with the CO(3−2) tran-sition, we conclude that LBQS0109 and HB8903 reside in overdense systems, as often found for QSOs at similar and higher redshifts.
– The CO(3−2) emission at the systemic velocity of the QSO is detected in only one of the three targets, that is, LBQS0109. The CO profile has a velocity and line width consistent with the narrow [O
iii
]λ5007 and Hα components tracing SF in the host galaxy. In addition the CO emission is spatially resolved by the ALMA beam and is not symmetrically distributed around the location of the QSOs, but absent or faint in the outflow region. This is suggestive of a scenario in which the AGN-driven outflow is removing the ionised and molecular gas from the host galaxy.– In 2QZJ0028 we tentatively detect a faint CO(3−2) emis-sion blueshifted by 2000 km s−1relative to the redshift of the
host galaxy and spatially coincident with the ionised outflow emission. If confirmed by follow-up observations, this CO emission may be tracing a molecular cloud at high velocity that has been ejected away from the galaxy by AGN-driven outflows. Also, our analysis would suggest that the molecu-lar gas in the outflow region is more highly excited than the rest of molecular gas in the host galaxy. An alternative inter-pretation to the outflow scenario could be that the detected CO emission is associated to a faint companion galaxy. Fu-ture deeper ALMA observations of CO(3−2) and higher (or lower) rotation transition will be fundamental in confirming the redshift of this detection and analyse the excitation state of the molecular gas. If the outflow scenario will be con-firmed, the new ALMA observations will allow us to esti-mate the molecular outflow mass rate and compare this value with that estimated from ionised gas in the same QSO.
– Assuming a αCO= 0.8 M /km s−1pc2, the inferred molecular
gas mass in both host galaxies is clearly below what observed in MS galaxies with similar SFR and consistent with those observed in other high-z QSO and SMGs.
We conclude that AGN-driven outflows in our sample are remov-ing ionised and molecular gas from the host galaxy and quench-ing the star formation. The interaction of the fast winds with the LBQS0109 host galaxy is clearly visible in the outflow region, where the CO emission is faint. This result supports our previ-ous studies of these QSOs showing Hα emission quenched in the outflow region.
Acknowledgements. This paper makes use of the following ALMA data: ADS/JAO.ALMA#2013.0.00965.S; which can be retrieved from the ALMA data archive:https://almascience.eso.org/alma-data/archive. ALMA is a partnership of ESO (representing its member states), NSF (USA) and NINS (Japan), together with NRC (Canada) and NSC and ASIAA (Taiwan), in coop-eration with the Republic of Chile. The Joint ALMA Observatory is operated by ESO, AUI/NRAO and NAOJ. S.C. and R.M. acknowledge financial support from the Science and Technology Facilities Council (STFC). R.M. acknowledges ERC Advanced Grant 695671 “QUENCH”. M.B. acknowledges support from the FP7 Career Integration Grant “eEASy”: Supermassive black holes through cosmic time: from current surveys to eROSITA-Euclid Synergies (CIG 321913). C.C. acknowledges funding from the European Union’s Horizon 2020 research and innovation programme under the Marie Skłodowska-Curie grant agreement No. 664931. R.S. acknowledges support from the European Research Council under the European Union (FP/2007-2013)/ERC Grant Agreement No. 306476. C.F. acknowledges funding from the European Union’s Horizon 2020 research and innovation programme under the Marie Skłodowska-Curie grant agreement No. 664931.
References
Alexander, D. M., & Hickox, R. C. 2012,New Astron. Rev., 56, 93
Banerji, M., Carilli, C. L., Jones, G., et al. 2017,MNRAS, 465, 4390
Beelen, A., Cox, P., Benford, D. J., et al. 2006,ApJ, 642, 694
Bolatto, A. D., Wolfire, M., & Leroy, A. K. 2013,ARA&A, 51, 207
Bothwell, M. S., Smail, I., Chapman, S. C., et al. 2013,MNRAS, 429, 3047
Brusa, M., Bongiorno, A., Cresci, G., et al. 2015a,MNRAS, 446, 2394
Brusa, M., Feruglio, C., Cresci, G., et al. 2015b,A&A, 578, A11
Cai, Z.-Y., Lapi, A., Xia, J.-Q., et al. 2013,ApJ, 768, 21
Cano-Díaz, M., Maiolino, R., Marconi, A., et al. 2012,A&A, 537, L8
Carilli, C. L., & Walter, F. 2013,ARA&A, 51, 105
Carilli, C. L., Riechers, D., Walter, F., et al. 2013,ApJ, 763, 120
Carniani, S., Marconi, A., Biggs, A., et al. 2013,A&A, 559, A29
Carniani, S., Maiolino, R., De Zotti, G., et al. 2015a,A&A, 584, A78
Carniani, S., Marconi, A., Maiolino, R., et al. 2015b,A&A, 580, A102
Carniani, S., Marconi, A., Maiolino, R., et al. 2016,A&A, 591, A28
Chabrier, G. 2003,PASP, 115, 763
Cicone, C., Feruglio, C., Maiolino, R., et al. 2012,A&A, 543, A99
Cicone, C., Maiolino, R., Sturm, E., et al. 2014,A&A, 562, A21
Cicone, C., Maiolino, R., Gallerani, S., et al. 2015,A&A, 574, A14
Cresci, G., Mainieri, V., Brusa, M., et al. 2015,ApJ, 799, 82
Daddi, E., Dannerbauer, H., Liu, D., et al. 2015,A&A, 577, A46
Dasyra, K. M., Combes, F., Oosterloo, T., et al. 2016,A&A, 595, L7
Decarli, R., Walter, F., Venemans, B. P., et al. 2017,Nature, 545, 457
Di Matteo, T., Springel, V., & Hernquist, L. 2005,Nature, 433, 604
Downes, D., & Solomon, P. M. 1998,ApJ, 507, 615
Fabian, A. C. 2012,ARA&A, 50, 455
Ferrara, A., & Scannapieco, E. 2016,ApJ, 833, 46
Ferrarese, L. 2002,ApJ, 578, 90
Feruglio, C., Maiolino, R., Piconcelli, E., et al. 2010,A&A, 518, L155
Feruglio, C., Fiore, F., Carniani, S., et al. 2015,A&A, 583, A99
Fiore, F., Feruglio, C., Shankar, F., et al. 2017,A&A, 601, A143
Gallerani, S., Ferrara, A., Neri, R., & Maiolino, R. 2014,MNRAS, 445, 2848
Healey, S. E., Romani, R. W., Taylor, G. B., et al. 2007,ApJS, 171, 61
Hooper, E. J., Impey, C. D., Foltz, C. B., & Hewett, P. C. 1995,ApJ, 445, 62
Hopkins, P. F., & Elvis, M. 2010,MNRAS, 401, 7
Hopkins, P. F., Hernquist, L., Cox, T. J., & Kereš, D. 2008,ApJS, 175, 356
Kakkad, D., Mainieri, V., Brusa, M., et al. 2017,MNRAS, 468, 4205
Kennicutt, Jr., R. C. 1998,ApJ, 498, 541
Klaas, U., Haas, M., Müller, S. A. H., et al. 2001,A&A, 379, 823
Kormendy, J., & Ho, L. C. 2013,ARA&A, 51, 511
Maiolino, R., Gallerani, S., Neri, R., et al. 2012,MNRAS, 425, L66
Marconi, A., Risaliti, G., Gilli, R., et al. 2004,MNRAS, 351, 169
Mashian, N., Sturm, E., Sternberg, A., et al. 2015,ApJ, 802, 81
Matsushita, S., Iono, D., Petitpas, G. R., et al. 2009,ApJ, 693, 56
McMullin, J. P., Waters, B., Schiebel, D., Young, W., & Golap, K. 2007, in Astronomical Data Analysis Software and Systems XVI, eds. R. A. Shaw, F. Hill, & D. J. Bell,ASP Conf. Ser., 376, 127
Morganti, R., Oosterloo, T., Oonk, J. B. R., Frieswijk, W., & Tadhunter, C. 2015,
A&A, 580, A1
Netzer, H., Shemmer, O., Maiolino, R., et al. 2004,ApJ, 614, 558
Palau, A., Sánchez Contreras, C., Sahai, R., Sánchez-Monge, Á., & Rizzo, J. R. 2013,MNRAS, 428, 1537
Perna, M., Brusa, M., Cresci, G., et al. 2015,A&A, 574, A82
Planck Collaboration XVI. 2014,A&A, 571, A16
Salomé, P., Guélin, M., Downes, D., et al. 2012,A&A, 545, A57
Sargent, M. T., Daddi, E., Béthermin, M., et al. 2014,ApJ, 793, 19
Sharon, C. E., Riechers, D. A., Hodge, J., et al. 2016,ApJ, 827, 18
Shemmer, O., Netzer, H., Maiolino, R., et al. 2004,ApJ, 614, 547
Sijacki, D., Springel, V., & Haehnelt, M. G. 2011,MNRAS, 414, 3656
Silk, J. 2013,ApJ, 772, 112
Silva, A., Sajina, A., Lonsdale, C., & Lacy, M. 2015,ApJ, 806, L25
Soifer, B. T., Neugebauer, G., Matthews, K., et al. 1999,ApJ, 513, 207
Tacconi, L. J., Genzel, R., Neri, R., et al. 2010,Nature, 463, 781
Takeuchi, T. T., Kawabe, R., Kohno, K., et al. 2001,PASP, 113, 586
Trakhtenbrot, B., Urry, C. M., Civano, F., et al. 2015,Science, 349, 168
Trakhtenbrot, B., Lira, P., Netzer, H., et al. 2017,ApJ, 836, 8
Valiante, R., Schneider, R., Salvadori, S., & Bianchi, S. 2011,MNRAS, 416, 1916
Wagg, J., Wiklind, T., Carilli, C. L., et al. 2012,ApJ, 752, L30
Williams, R. J., Wagg, J., Maiolino, R., et al. 2014,MNRAS, 439, 2096
Williams, R. J., Maiolino, R., Krongold, Y., et al. 2017,MNRAS, 467, 3399
Yan, L., Tacconi, L. J., Fiolet, N., et al. 2010,ApJ, 714, 100
Appendix A: Overdense systems
The ALMA observations serendipitously reveal line and contin-uum sources in the field of LBQS0109 and HB8903 quasars, (Figs. A.1 and A.2), located within a projected radius of ∼160 kpc from the centre of the two QSO. From the continuum emission we infer a SFR > 900 M yr−1 for all sources and a
Mdust = 1−6×10⁸M . In TableA.1we list the properties of these
detections and, hereafter, we use the terms LBQS0109-A, -B ,-C, and HB8903-A, -B to refer to the serendipitous sources around LBQS0109 and HB8903, respectively. If the emission line are identified with CO(3−2) transition, the serendipitous sources are in a redshift range of∆z = 0.005 (|∆v| < 500 km s−1) relative to the respective QSOs. We estimate a CO(3−2) luminosity of 0.6−23×1010K km s−1pc2for these sources and a molecular gas
mass of 0.5−90 × 1010 M , depending of αCO(TableA.1), which
is higher than molecular gas masses inferred for the three QSOs. The SFR and Mgasof these serendipitous sources are consistent
with those observed in SMGs (Fig.A.3). Assuming a dark halo
LBQS0109-A 1h12m17.2s17.1s 17.0s 2°29'35" 34" 33" 32" 31" RA [J2000] Dec [J2000] 2000 1000 0 1000 2000
velocity [km/s]
0 2flux [mJy/beam]
LBQS0109-B 1h12m17.6s17.5s 17.4s 2°29'54" 53" 52" 51" 50" RA [J2000] Dec [J2000] 2000 1000 0 1000 2000velocity [km/s]
0 1flux [mJy/beam]
LBQS0109-C 1h12m17.3s17.2s 17.1s 2°29'56" 55" 54" 53" 52" RA [J2000] Dec [J2000] 2000 1000 0 1000 2000velocity [km/s]
0.5 0.0 0.5flux [mJy/beam]
Fig. A.1.CO(3−2) maps (top panels) of serendipitous sources detected in the LBQS0109 field of view. The maps are obtained collapsing under golden shade region shown in their respective spectra (bottom panels). The black contours are at levels of −2, 2, 3, 4, and 5 times the noise per beam in the same map (i.e. 0.06, 0.05, and 0.05 Jy/beam km s−1, respectively for the three sources). The ALMA beam is shown in the bottom-right
corner of each map. The white contours indicate the continuum emission at levels of 2(−2)σ, 3(−3)σ, and 4σ. The spectra in the bottom panels are extracted from the centre of the sources. The 0 km s−1corresponds into the redshift of LBQS0109.
HB8903-A
3h31m07.0s 06.8s
06.6s
-38°24'00"
01"
02"
03"
04"
05"
RA [J2000]
Dec [J2000]
HB8903-B
3h31m06.2s 06.0s
-38°24'18"
19"
20"
21"
22"
23"
RA [J2000]
Dec [J2000]
2000
1000
0
1000
2000
velocity [km/s]
0.25
0.00
0.25
flux [mJy/beam]
2000
1000
0
1000
2000
velocity [km/s]
0.25
0.00
0.25
flux [mJy/beam]
Fig. A.2.CO(3−2) maps (top panels) of serendipitous sources detected in the HB8903 field of view. The maps are obtained collapsing under golden shade region shown in their respective spectra (bottom panels). Black contours contours are in steps of 1σ= 0.03 Jy/beam km s−1for the
source A and 1σ= 0.04 Jy/beam km s−1for the source B, starting at ±2σ. The ALMA beam is shown in the bottom-right corner of each map. The
white solid (dashed) contours indicate the continuum emission at levels of 2(−2) and 3(−3) times the noise per beam (18 µJy/beam). The spectra in the bottom panels are extracted from the centre of the sources. The 0 km s−1corresponds into the redshift of HB8903.
mass of 1013M , which is reasonable for a galaxy hosting a
mas-sive BH of mass 1010M
, we note that the serendipitous galaxies
are within the virial radius (∼500 kpc) of the central QSO. Both LBQS0109 and HB8903 could represent an overdense system at z '2.4.
From a 2D Gaussian fitting we estimate the size of the CO(3−2) emission in all serendipitous galaxies and two out of five sources turn out to be spatially resolved (LBQS0109-A and LBQS0109-B). However, because the S/N-per-pixel in the LBQS0109-B is too low (<10), we perform a pixel-by-pixel kinematic analysis only on LBQS0109-A. The results of the kinematic analysis are reported in Fig. A.4that shows a clear north-south velocity gradient of ∼500 km s−1over ∼100(8.3 kpc). If it were due to simple rotation, this would imply a dynamical mass without inclination angle i correction of 2×10¹¹sin2(i) M .
We do not detect any significant (S /N > 5) line emission in the ALMA field-of-view of 2QZJ0028 except the line emission candidate spatially offset by 0.200 discussed in Sect. 5.1. We
T able A.1. Properties of serendipitous sources. LBQS0109-A LBQS0109-B LBQS0109-C HB8903-A HB8903-B 2QZJ0028-A RA 01:12:17.08 01:12:17.49 01:12:17:23 3:31:06.77 3:31:06.09 00:28:31.812 Dec 2:29:32.99 2:29:52.26 2:29:63.64 –38:24:02.79 –38:24:20.95 –28.16.51.616 S3 mm [µ Jy] 115 ± 12 52 ± 12 48 ± 12 36 ± 18 54 ± 18 61 ± 12 Mdust [10 8M ] a 4–6 1–3 1–3 1–2 2–3 2–3 SFR [M yr − 1] a 2800 1200 1100 900 1400 1500 λCO(3 − 2) [mm] 2 .90642 ± 0 .00008 2 .9112 ± 0 .0003 2 .9045 ± 0 .0003 2 .9779 ± 0 .0006 2 .9843 ± 0 .0005 – FWHM CO(3 − 2) [km s − 1] 190 ± 20 590 ± 70 300 ± 20 400 ± 100 400 ± 100 – SCO(3 − 2) ∆ v [Jy km s − 1 ] 1 .72 ± 0 .06 7 .16 ± 0 .05 0 .19 ± 0 .05 0 .27 ± 0 .03 0 .32 ± 0 .04 – L 0 CO(3 − 2) [10 10 K km s − 1 pc 2 ] 5 .2 ± 0 .2 22 .9 ± 0 .2 0 .58 ± 0 .15 0 .88 ± 0 .09 1 .04 ± 0 .13 – LCO(3 − 2) [10 7L ] 6 .9 ± 0 .2 29 .1 ± 0 .2 0 .8 ± 0 .2 1 .26 ± 0 .13 1 .38 ± 0 .17 – MCO (α CO = 0.8) [10 10 M ] b 4 ± 2 18 ± 9 0 .5 ± 0 .3 0 .7 ± 0 .4 0 .8 ± 0 .5 – MCO (α CO = 4) [10 10 M ] b 21 ± 11 90 ± 50 2 .3 ± 1 .7 3 ± 2 4 ± 2 – Notes. (a )Under the assumption that the continuum emission at 3 mm is completely associated to thermal dust continuum emission. W e assume a Td = 40 − 60 K and a β = 2 .0. (b )Under the assumption that the line detection is associated to the CO(3 − 2) transition and assuming a r31 = 1 .0 ± 0 .5. The statistical errors associated to the molecular g as include r31 uncertainties. 10 100 1000
SFR [M /yr]
107 108 109 1010 1011 1012 1013 1014M
gas[M
]
MS
STARBURST
CO= 0.8 M / K km/s pc2 CO= 4 M / K km/s pc2Fig. A.3.Inverse, integrated version of the Kennicutt-Schmidt relation between SFR and molecular mass gas. The solid black line is the best-fit relation for MS galaxies and the dashed shows the relation of the starburst galaxies (Sargent et al. 2014). Circles and triangles correspond to the three QSOs and serendipitous sources, respectively.
2.0 1.5 1.0 0.5 0.0 0.5 1.0 1.5 2.0 arcsec 2.0 1.5 1.0 0.5 0.0 0.5 1.0 1.5 2.0 arcsec LBQS0109-A 2.0 1.5 1.0 0.5 0.0 0.5 1.0 1.5 2.0 arcsec 2.0 1.5 1.0 0.5 0.0 0.5 1.0 1.5 2.0 arcsec 2.0 1.5 1.0 0.5 0.0 0.5 1.0 1.5 2.0 arcsec 2.0 1.5 1.0 0.5 0.0 0.5 1.0 1.5 2.0 arcsec 100 mJy/beam km/s200 300 400 250 km/s0 250 0 km/s100 200
Fig. A.4.CO(3−2) flux, median velocity, and velocity dispersion maps of LBQS0109-A. The maps are obtained by selecting pixel with S /N > 3. The velocity map shows a gradient of velocity towards the north-south direction. 2QZJ0028-A 0h28m31.2s 31.0s -28°17'15" 16" 17" 18" 19" RA [J2000] Dec [J2000] 2000 1000 0 1000 2000
velocity [km/s]
0.5 0.0 0.5flux [mJy/beam]
Fig. A.5.Continuum map at 3 mm of the serendipitous source detected in the field of 2QZJ0028. Contours are at of −2, 2, 3, 4, 5 times of the continuum rms (12 µJy/beam). The ALMA beam is shown in the bottom-right corner of each map.
observe a continuum emission with a S /N = 5 located at ∼1400
from the QSO. The continuum emission (Fig.A.5) is not spa-tially resolved and its flux density at 3 mm is 61 ± 12 µJy.
The comparison of our ALMA detections with number counts studies at similar wavelengths indicates that all QSOs reside in a significant over-density. In fact, theoretical results obtained by simulations and semi-analytical models predict a number counts at 3 mm of N (S > 100 µJy) ' 100 deg−2 (Takeuchi et al. 2001; Cai et al. 2013), yielding to a N (S > 100 µJy) ' 0.02 FOV−1


![Fig. 3. LBQS0109: from left to right: [O iii ]λ5007 velocity map by Carniani et al. (2015b), ALMA continuum map at 3 mm, and narrow [OIII]](https://thumb-eu.123doks.com/thumbv2/123dokorg/8097775.124824/7.892.76.822.118.325/lbqs-right-velocity-carniani-alma-continuum-narrow-oiii.webp)
![Fig. 5. 2QZJ0028: from left to right: [O iii ]λ5007 velocity map by Carniani et al. (2015b), ALMA continuum map at 3 mm, and narrow Hα emission tracing SF in the host galaxy (Cano-Díaz et al](https://thumb-eu.123doks.com/thumbv2/123dokorg/8097775.124824/9.892.79.825.117.329/velocity-carniani-continuum-narrow-emission-tracing-galaxy-díaz.webp)


