BINARY COMPOSITES OF POLYMERS WITH CELLULOSE
FIBRES
2.1 Introduction
In this chapter, the modification and properties of binary composites of polymers poly(ε-caprolactone) (PCL) and ethylene vinyl acetate (EVA) with cellulose (PCL/CF, EVA/CF) have been described. The effect of components functionalization (or presence of functionalized components) on the interfacial interaction, thermal and crystallization behaviour and mechanical properties of the composites has been analysed.
First part deals with PCL/CF composites. PCL is an important polymer due to its mechanical properties, miscibility with a large range of other polymers and biodegradability [105]. A large number of papers have been published on the preparation and characterization of PCL/starch systems, giving attention on the miscibility and compatibilization between PCL and starch [106-109]. The starch-PCL blends are also being marketed by few companies for film applications, e.g. Novamont (Italy), Milleta Biotech Division (Germany), but still their applications are limited due to a low melting point of 60 °C and poor mechanical properties [110]..On the other hand, properties of PCL based composites with cellulosic fibres have not been extensively examined. Shibata et al [89] reported that the tensile strength of composite of PCL with esterified abaca fibres is higher than composite of PCL with glass fibre. Kusumi et al [111] studied the miscibility of PCL with cellulose ester and found that cellulose butyrate (CB) is miscible with PCL when the degree of substitution is > 2. Recently, a few numbers of studies have also been published on the surface modification of cellulose by grafting with PCL using different chemical routes to enhance the compatibility of PCL matrix with cellulose [112-114]. Additionally, PCL functionalised with reactive monomers can be used as compatibilizer to improve the interfacial interactions between PCL and cellulose. Arbelaiz et al [90] studied the mechanical properties of short flax fibre bundle/poly(ε-caprolactone) composites using maleic anhydride grafted PCL
(PCL-g-MA) as compatibilizer. They found that the compatibilized composites showed higher mechanical properties as compared to uncompatibilized system. Dontella - previous PhD student of our laboratory - reported on the compatibilization and properties of polyolefin and polyester composites with cellulosic fibres modified by grafting of epoxy or anhydride functional groups able to improve the matrix/fibre interfacial interactions [73].
In the present study, composites of PCL with cellulose, compatibilized using both cellulose esterified with butanoic acid (CB) or PCL grafted with maleic anhydride/glycidyl methacrylate (PCL-g-MAGMA) were studied. The effect of the component functionalization on the interfacial interactions, phase structure and properties of the composites was also examined as a function of the composition. It is expected that the presence of alkyl chains on the cellulose fibres may contribute to enhance the fibre dispersion and thus the thermal and mechanical behaviour.
Second part of the chapter deals with EVA/CF composites. Ethylene vinyl acetate copolymers, due to their important rubber and resin properties [115], are used for various applications, such as packaging films, adhesives/paper coatings, wire and cable insulation, barrier sheets, etc [116]. However, there exists only limited information about the properties of EVA based composites. Dikobe et al have examined composites of PP/EVA blends with wood powder (WP) and reported that WP influenced the crystallization behaviour of EVA [74]. Mydul et al [117] have studied the mechanical properties of EVA and cellulose acetate (CA) containing natural fibres (Sterculia villosa). They observed that the tensile strength of EVA composites decreased with the addition of fibre, whereas in CA composites, tensile strength increased due to the good distribution of fibres.Malunka et al [82] have prepared EVA/Sisal fibre composites by melt mixing in the presence of dicumyl peroxide (DCP) as radical initiator, and mentioned that in presence of DCP, grafting between EVA and Sisal fibre took place. These composites were more thermally stable than both EVA and sisal fibre alone. Espert et al [118] have studied PP/EVA/cellulose composites and reported that EVA improved the resistance of the composites to water absorption. On the other hand, EVA copolymers modified with reactive groups have been advantageously employed for compatibilization of blends of EVA with different types of polymers, as polyesters and polyamides [119, 120]. Moreover, EVA copolymers offers the possibility of preparing compatible blends with biodegradable polyesters (i.e., PLA) which could be advantageously exploited for the preparation of composites with natural fillers. A research study was started on the preparation and characterization of EVA/CF composites with components selectively modified by grafting of functional groups - able to improve the matrix/fibre interfacial interactions - in order to develop the performances and applications of eco-friendly materials based on natural fibres. For this system, the compatibilization of EVA/CF composites by means of chemical modification of cellulose fibres and EVA copolymer with MA or GMA - aimed at analysing the effect of functional groups and phase interactions on the morphological, structural, thermal and mechanical characteristics of these systems - was reported.
2.2 Experimental
2.2.1. Materials
Poly(ε-caprolactone) (PCL), CAPA 6800 - molecular weight (MW) = 80000 g/mol, melt flow rate (MFR) = 3 g/10 min (160 °C/2.16 Kg) - was purchased from Solvay. Cellulose powder, trade name Arbocel BWW 40, with average fibre length: 200 μm and average diameter: 20 μm, supplied by JRS Pharma GmbH (Rosenberg, Germany) was used for the preparation of cellulose butanoate, as reported later. Cellulose micofibres (CF1), trade name Technocel 165 (cellulose content: 75%; bulk density> 70 g/l; sieving: 125 m (< 20%), 32 m (< 80%)) and cellulose microfibres (CF5), trade name Technocel 500-1 – bulk density 60 g/l; sieving: 200 m (< 10%), 90 m (< 50%), 32 m (> 60%).- were kindly supplied by NEUCHEM (Milan, Italy). These fibres were used as reinforcement for composites with
polymer matrices. In this thesis, Technocel 165 and Technocel 500-1 have been referred as CF1 and CF5 respectively.
Maleic anhydride (MA) (purity 99.8%), glycidyl methacrylate (GMA) (purity 97%), butanoic acid and thionyl chloride were purchased from Sigma Aldrich (Italy).
Table 2.1The molecular structures of the employed materials
Material Molecular structure
Poly(ɛ-caprolactone) O (CH2)5 C
O
n
Ethylene Vinyl Acetate CH2 CH2 H2C CH
O n m C O CH3 Glycidyl methacrylate C CH2 CH3 C O O H2 C CH O H2C Maleic anhydride HC CH C O C O O Butyric acid H 3C H2 C HC2 COOH Thionyl chloride O S Cl Cl
Ethylene-vinyl acetate (EVA), trade name Elvax 220W, was supplied from DuPont. It contains 28% vinyl acetate and has a density of 0.951 g/cm3, MFR = 150 g/10 min (190°C/2.16 Kg) and melting point of 70°C. Ethylene-vinyl acetate graft maleic anhydride (EVA-MA), trade name Fusabond C MC190D, was received from DuPont Italia. It contains 28% vinyl acetate and has a density of 0.95 g/cm3, MFR = 16 g/10 min (190°C /2.16 Kg), melting point of 71°C. Ethylene-vinyl acetate-co-glycidylmethacrylate (EVA-GMA), trade name Elvaloy AS, was an epoxy modified ethylene terpolymer obtained from DuPont. All other chemicals used in this work were reagent grade and used without further purification. Average values of fibre length and diameter were measured with semi-automatic software (UTHSCSA Image Tool) from SEM micrographs. Average diameter, length of CF1 and CF5 were measured 17.5, 189 and 21.5, 340 μm respectively. List of the employed materials with their molecular structure are reported in Table 2.1.
2.2.2. Preparation
2.2.2.1 Preparation of cellulose butanoate
Butanoic acid (52 g) was put in a round bottom flask equipped with a mechanical stirrer, a reflux condenser and a dropping funnel. Thionyl chloride (70 g) was added drop wise into the flask at room temperature. The mixture was then heated up to 78 °C and stirred at about 130 rpm for 4 hours. Pyridine was added drop wise to the mixture and the solution was stirred for 1 hour. Cellulose Arbocel (12 g) was then added to the flask and stirring was continued at 70 °C for 20 hours. The product was isolated by filtration, washed with ethanol four times and dried [121]. The dried product (CB) was characterized by FT-IR and solid state NMR.
2.2.2.2 Synthesis of PCL-g-MAGMA
PCL-g-MAGMA was prepared in the melt by using a Brabender Plasti-Corder internal mixer. A mixture constituted by 36 g of PCL, 2 g of MA and 0.5 g of dibenzoyl peroxide (DBPO) was first fed into the mixer at 100 °C and then 2 g of GMA were added dropwise. The reaction was carried out at 100 °C for 20 min at the rate of 30 rpm [122]. Modified PCL (PCL-g- MAGMA) was kept in an oven at 70 °C for 12 hours under vacuum to remove unreacted components. The dried PCL-g-MAGMA was characterised by FT-IR.
2.2.2.3 Modification of cellulose microfibres (CF1)
Modification of cellulose with maleic anhydride was carried out by addition of MA monomer (0.5 mol/mol of anhydrous glucose unit) into a cellulose acetone suspension (1:10). The suspension was stirred for 8 hours refluxing the solvent at 55 °C. The MA modified cellulose (CF1-MA) was then cooled to room temperature, separated by filtration, washed with distilled water three times and finally with acetone, dried at 50 °C under vacuum and stored at 0 °C in a refrigerator.
Cellulose was also functionalized with GMA following the procedure previously reported by Rozman et al [100]. 12 g of dried cellulose (CF1) was reacted at 90 °C in batches with 60 ml of GMA/triethylamine (3:7 vol./vol.) solution. To minimize the risk of free radical reaction at the unsaturated ends of GMA, hydroquinone (2 wt-% of GMA) was added. After four hours reaction, the modified cellulose was separated from the reagents by filtration, rinsed with acetone and refluxed with excess of fresh acetone for four hours to ensure removal of solvent, unreacted reagents and GMA homopolymer formed during the reaction. After washing, the treated cellulose was dried at 105 °C for five hours under vacuum. The degree of substitution (DS) of GMA modified cellulose (CF1-GMA) was determined according to the following protocol [123]. At room temperature, 300 mg of treated cellulose fibres were stirred in 10 ml of chloroform for 24 hours under exclusion of light. A freshly prepared solution of bromine in chloroform was added to the mixer and stirred for more 2 hours; finally 20 ml of methanol was added and filtered. The collected product was washed with 40 ml aqueous sodium thio-sulphate (10 % w/v), thrice with distilled water, thrice with methanol and dried at 40 ºC under vacuum. The brominated cellulose (0.06033 g) was put in a fusion tube with sodium metal, fused and ground into water of a mortar. Then the solution was filtered, concentrated by evaporation, acidified with dilute HNO3 and then AgNO3 solution was added for precipitation as AgBr. The precipitate was separated and
dried at 105 °C for 2 hours and weighed. From the weight of Br, the degree of substitution of CF1-GMA was estimated.
2.2.2.4 Processing of composites
The composites were prepared in a Brabender Plasti-Corder internal mixer at a temperature of 150 °C (PCL/CF) (Fig. 2.1a) and 170 °C (EVA/CF) (Fig. 2.1b). Mixing of PCL and cellulose (CF5) at a ratio 7:3 was carried out under nitrogen flux for 7 min at a rotor speed of 60 rpm. To increase the compatibility of the components in the composites CB (2-10 phr) or PCL-g-MAGMA (10-20 wt.%) were added during the mixing. Binary composites of PCL with cellulose butanoate (PCL/CB) were also prepared with different CB content. All the examined systems are enlisted with their code in Table 2.2.
Table 2.2 Compositions and sample codes of PCL/CF composite materials.
Compositions
Sample code Components
(wt.%) PCL/CF5 PCL/Cellulose 70/30 PCL/CF5/PMG10 PCL/Cellulose/PCL-g-MAGMA 60/30/10 PCL/CF5/PMG20 PCL/Cellulose/PCL-g-MAGMA 50/30/20 PCL/CF5/CB2 PCL/Cellulose, CB (2 phr) 68.6/29.4/2 PCL/CF5/CB5 PCL/Cellulose, CB (5 phr) 66.6/28.6/4.8 PCL/CF5/CB10 PCL/Cellulose, CB (10 phr) 63.6/27.3/9.1 PCL/CB3 PCL/CB 97/3 PCL/CB7 PCL/CB 93/7 PCL/CB12 PCL/CB 88/12
Composites of modified and unmodified cellulose with EVA (80 wt.% EVA, 20 wt.% cellulose) were prepared in the presence of radical initiator Bis-[1-(tert-butylperoxy)-1-methylethyl]-benzene (BTP) by melting in a Brabender Plasti-corder internal mixer. The composite components weighed according to the required ratio (total weight: 40 g) were mixed at 170 °C, at a mixing speed of 60 rpm for 10 minutes. Composites of EVA, EVA-MA and EVA-GMA with different CF1 and CF5 content were also prepared without initiator. Torque moment was recorded during the mixing process as a function of time. Before mixing cellulose and polymers were dried under vacuum for 6 hours at 90 °C and 50 °C respectively.
Fig. 2.1a - Flow diagram for processing of PCL/CF composites.
Fig. 2.1b - Flow diagram for processing of EVA/CF composites
2.3 Results and discussion
2.3.1. Composites with PCL matrix
2.3.1.1 Characterization of modified fibres and PCL
SEM micrographs of cellulose and CB fibres are shown in Fig. 2.2. The surface of pure cellulose is more or less smooth, while the surface of modified cellulose is very rough. These morphological changes can be attributed to the partial esterfication of hydroxyl groups of cellulose with butanoic acid on the fibre surface as well as to the hydrolytic effect of HCl produced during the esterification reaction, according to that reported by Lin et al for cotton cellulose [124].
Fig. 2.2 - SEM micrographs of (a) cellulose and (b) modified cellulose (CB)
Wave number (cm-1) 1000 2000 3000 4000 T ra n s m it ta n c e ( % ) Cellulose Modified cellulose (CB) 1741 29652933 2872 C=O carbonyl -CH2 --CH -CH3
(a)
Fig. 2.3a - FT-IR spectra of cellulose and modified cellulose (CB).
The occurrence of substitution reaction on the fibre surface was examined by FT-IR. Spectra of cellulose and CB are shown in Fig. 2.3a: the appearance of a strong peak at 1741 cm-1, due to the symmetric stretching of carbonyl group, and at 2965 cm-1, due to the C-H stretching in CH3 group was observed in the spectrum of CB [125]. Moreover, the peak intensity of hydroxyl group at 3334 cm-1 for CB was reduced as compared to the unmodified cellulose. Summarizing, FT-IR analysis supports the occurrence of cellulose esterification that entails both the appearance of butanoate groups and the consumption of surface hydroxyl groups due to the condensation reaction. However, the presence of OH absorption band in the spectrum of CB points out that only a part of OH groups of cellulose were involved in the reaction
To estimate the degree of substitution, 13C CP-MAS solid state NMR was performed both on neat and modified cellulose. It was found that the degree of substitution of CB is 1.08, calculated as the ratio between the sum of the areas of the signals of carbon atoms in butanoic acid and the sum of the areas of the signals of carbon atoms in cellulose. For this evaluation each area value was normalized with respect to the number of carbon atoms, i.e. 4 for butanoic acid and 6 for cellulose, respectively.
Fig. 2.3b - FT-IR spectra of PCL and PCL-g-MAGMA
Fig 2.3b shows the FT-IR spectra of PCL and PCL-g-MAGMA. Compared to PCL, the PCL-g-MAGMA spectrum shows the presence of new peaks at 1778 and 1847 cm-1, respectively attributed to the symmetric and asymmetric stretching of the carbonyl groups of the grafted anhydride. Similar results were also reported by Laurienzo et al for modified PCL [122]. However, the content of grafted GMA could not be evaluated by infrared analysis, since the characteristic absorption bands of glycidyl methacrylate overlap the bands of PCL (e.g., the epoxy stretching vibration at 1170 cm-1 overlaps the symmetric C–O–C stretching of the polyester).
2.3.1.2 Characterization of composites
2.3.1.2.1. Morphology
SEM micrographs of fracture surfaces of the examined samples are presented in Fig. 2.4. It appears that the fracture surface of unmodified composite PCL/CF5 70/30 (Fig. 2.4a) shows poor polymer/fibre interfacial adhesion and a clear evidence of pull out phenomena of fibres, whereas the fracture surfaces of
Wave number (cm-1) 1000 1500 2000 2500 3000 3500 T ra n s m it ta n c e ( % ) 1778 1847
(b)
PLA-g-MAGMA PCLcompatibilized composites display a higher interfacial adhesion, resulting in a partial coating of the fibre surface with the polymer (Fig. 2.4c-f).
Fig. 2.4 - SEM micrographs of (a) PCL/CF5, (b) PCL/CB12, (c) PCL/CF5/CB2, (d) PCL/CF5/CB10, (e) PCL/CF5/PMG10, (f) PCL/CF5/PMG20
In the case of the sample containing the highest amount of CB (PCL/CB12) - as shown in Fig 2.4b - the fibres appear completely embedded into the matrix confirming the occurrence of strong interactions between PCL and CB. For composites containing PCL-g-MAGMA, a higher interfacial adhesion was observed between fibre and matrix. This result suggests that the functionalized polymer is more effective compatibilizer as compared to the functionalized fibre. This is probably due to the stronger interactions occurring between hydroxyl groups of cellulose and anhydride or epoxy group of GMA. Similar findings have been
reported for composites of PP and hemp fibres compatibilized with GMA modified hemp or PP-g-GMA [73].
2.3.1.2.2. Crystallization behaviour
DSC cooling and heating thermograms of PCL, PCL-g-MAGMA and their composites with cellulose microfibres are shown in Fig. 2.5. The values of phase transition temperatures (Tc: crystallization peak temperature, Tm: melting peak
temperature) and enthalpies (Hc: crystallization heat, Hm: melting heat) recorded
by DSC are summarized in Table 2.3.
Temperature (°C) 0 20 40 60 N o rm a liz e d h e a t fl o w e n d o u p ( W /g ) a b c d e f g Tc = 28.5 °C
(I)
Temperature (°C) 20 40 60 80 N o rm al iz ed heat f low endo up (W /g) a b c d e f g Tm = 55.8 °C(II)
Fig. 2.5 - DSC (I) cooling curves and (II) 2nd heating curves of (a) PCL, (b) PCL-g-MAGMA, (c) PCL/CF5, (d) PCL/CF5/CB2, (e) PCL/CF5/CB5, (f) PCL/CF5/CB10, (g) PCL/CF5/PMG10.
The incorporation of 30% cellulose into PCL induced a noticeable change of the crystallization temperature of PCL (Fig. 2.5-I), whereas it did not affect the melting behaviour (Fig. 2.5-II). The Tc of PCL increased from 28.5 °C of pure PCL to 35.3 °C for PCL/CF5, indicating the occurrence of a nucleating effect of cellulose on the crystal growth of PCL. Otherwise, on addition of modified cellulose a different crystallization behaviour was observed: Tc of PCL in the compatibilized PCL/CF5/CB composites decreased from 35.3 °C (Tc of PCL/CF5) to 27.9 °C with
increasing the CB content. This effect can be accounted for by the interactions at the interface of PCL chains with butanoate groups onto cellulose, which most likely inhibit the nucleating effect of cellulose surfaces on PCL crystal growth. Thus, for CB content of 10 phr (9.1 wt.%) the Tc of PCL in the composite is close to that of pure PCL. As resumed in Table 2.3, the Tc of PCL-g-MAGMA is slightly lower than
Tc of PCL; this can be ascribed to the presence of MAGMA grafted groups, which slightly slows down the molecular mobility of the PCL, as well as to the formation of some cross-linking among PCL chains during melt grafting of MA and GMA in the presence of radical initiator. For composites containing PCL-g-MAGMA, the Tc of PCL is similar to that of PCL/CF5 composite. DSC analysis also indicated that the presence of PCL-g-MAGMA affected both crystallization and melting temperatures of PCL matrix. This finding could be ascribed to a stronger polymer/cellulose interfacial adhesion in composites compatibilized with reactive modified PCL, as shown by SEM analysis.
Table 2.3 Thermal characteristics of PCL and composites.
Tc ∆Hc Tm ∆Hm Sample Code (°C) (J/g) (°C) (J/g) PCL 28.5 52.7 55.8 51.6 PCL-g-MAGMA 26.1 51.4 55.6 48.9 PCL/CF5 35.3 48.9 56.3 49.2 PCL/CF5/CB2 32.0 50 56.4 46.1 PCL/CF5/CB5 29.6 49.9 56.1 44.5 PCL/CF5/CB10 27.9 47.3 56.4 43.8 PCL/CF5/PMG10 35.2 48.9 58.1 47.4 PCL/CF5/PMG20 35.2 48.9 57.0 46.0
X-ray diffraction patterns of PCL, PCL-g-MAGMA and their composites with cellulose fibres in the 2θ range 10-33° are shown in Fig. 2.6. The patterns of PCL and PCL-g-MAGMA displayed characteristic crystalline peaks at about 21.5°, 22° and 23.8° ascribed to 110 and 200 crystallographic planes respectively [126] and other secondary peaks at higher 2θ values. On the other hand, the patterns of composites showed an additional peak at 15.8°, which is related to the diffraction of cellulose.
Fig. 2.6 - X-ray diffraction patterns of PCL, PCL/CF5, PCL/CF5/CB10, PCL/CF5/PMG10, PCL-g-MAGMA and cellulose.
C ry s ta lli n it y ( % ) 0 25 50 75 100 62% PCL-g-MAGMA PCL/CF5 PCL/CF5/PMG10 PCL/CF5/CB10 PCL 58% 45% 41% 36%
Fig. 2.7 - Bar diagram of crystallinity of PCL, PCL-g-MAGMA and their composites..
Fig. 2.7 shows a bar diagram of the crystallinity of PCL, PCL-g-MAGMA and their composites calculated from the ratio of the areas of the main crystalline peaks to the overall diffraction area. It was found that the crystallinity of PCL-g-MAGMA is lower than that of PCL, due to the presence of MAGMA groups grafted onto the PCL chain. The PCL crystallinity also decreased from 62 to 45 % by the incorporation of cellulose. Moreover, the crystallinity was affected by the presence
of both CB and PCL-g-MAGMA as compatibilizers. The effect of CB content on the crystallinity of PCL is well evidenced from the analysis of PCL/CB samples as shown in Fig. 2.8, where it is seen that the crystallinity decreased linearly with the CB content. CB content in PCL/CB composites (wt.)% 0 5 10 15 C ry s ta lli n ity o f P C L ( % ) 40 50 60 70 80
Fig. 2.8 - Effect of CB content on the crystallinity of PCL in PCL/CB composites.
2.3.1.2.3. Thermal properties
Exemplary TG and derivative (DTG) thermograms of PCL, CF5 and their composites, recorded at a heating rate of 10 °C/min under nitrogen flow, are shown in Fig. 2.9. The derivative curve of plain PCL in nitrogen displayed a large peak in the region 300-450 °C with the maximum at 410 °C. For pure cellulose the maximum degradation rate was recorded at about 352 °C [127]. The DTG curve of PCL/CF composite shows a peak whose maximum is at about at 409 °C, corresponding to the maximum degradation rate of PCL, and a shoulder at about 352 °C, related to the degradation of the cellulose component. The thermogram of composite compatibilized with CB shows a maximum peak at about at 406 °C with a shoulder at about 361 °C, whereas the thermogram of composite compatibilized with PCL-g-MAGMA shows maximum peak at about at 406 °C with a shoulder at about 352 °C. Thus the thermal stability of cellulose in the composites appears to be improved by the addition of modified cellulose. A similar effect has also been observed for composites of ethylene vinyl acetate containing cellulose modified with MA or GMA as reported later.
Fig. 2.9 - TGA and DTG curves of PCL, CF5 and their composites.
2.3.1.2.4. Tensile mechanical properties
The stress-strain curves recorded in the tensile tests for pure PCL and its composites are shown in Fig. 2.10. It is possible to observe that pure PCL exhibited an initial linear behavior- referred to as fully elastic deformation- followed by an extended non-linear part indicating the occurrence of plastic deformation. The incorporation of 30 wt.% of cellulose produces a marked change on the outline of the curve, reducing the non-linear part. Comparing pure PCL and PCL/CF5 sample, it is clear that the addition of cellulose fibres induces a significant increase of the elastic modulus of composite (Fig. 2.11), and a decrease of the elongation at break (Fig. 2.10). This decrease is related to restrictions of the fibres to the matrix deformation. Moreover, the tensile strength remains unchanged that may be associated to a lower fibre/matrix adhesion as verified by SEM microscopy (Fig. 2.4a). On the other hand, in the
Strain (mm/mm) 0,0 0,1 0,2 0,3 0,4 S tre s s (M P a ) 0 10 20 30 40 Elongation at break% > 500 PCL PCL/CF5/PMG10 PCL/CF5/PMG20 PCL/CF5/CB10 PCL/CF5/CB5 PCL/CF5/CB2 PCL/CF5
Fig. 2.10 - Stress-strain curves of PCL and it composites with CF5.
0 400 800 1200 1600 Yo u n g 's m o d u lu s ( M Pa ) 0 10 20 30 40 50 T e n s ile s tr e n g th ( M Pa ) Young's modulus Tensile strength PCL PCL/CF5 PCL/CF5/CB2 PCL/CF5/CB5 PCL/CF5/CB10 PCL/CF5/PMG10 PCL/CF5/PMG20
Fig. 2.11 - Bar diagram of (a) Tensile modulus and strength, (b) Elongation at break (%) of PCL and it composites with CF5.
case of compatibilized composites the increase of modulus was still higher and the tensile strength was improved with respect to pure PCL and PCL/CF5, suggesting an enhanced fibre/matrix interfacial adhesion, as demonstrated by morphological analysis. The composites compatibilized with PCL-g-MAGMA showed a larger improvement of the tensile strength (about two times with respect to pure PCL) and elongation at break in comparison with composites compatibilized with CB. This effect can be attributed to the stronger interfacial adhesion due to the reaction of OH groups of cellulose with the epoxy and/or anhydride groups on the PCL-g-MAGMA chains.
2.3.2 Composites of EVA with functionalized cellulose
2.3.2.1 Characterization of modified cellulose
Fig. 2.12 - Scanning electron micrographs of (a) untreated, (b) MA treated and (c) GMA treated celluloses.
The morphology and structure of modified cellulose fibres were analysed by SEM, FT-IR and WAXS analyses. Fig. 2.12 represents the scanning electron micrographs of untreated cellulose (CF1), MA treated cellulose (CF1-MA) and GMA treated cellulose (CF1-GMA) respectively. It is seen that the surfaces of both MA and GMA treated fibre as compared to the untreated fibre, show large roughness that could be ascribed to degradation effects during the treatment in solution.
Wave number (cm-1) 800 1000 1200 1400 1600 1800 2000 T ra n s m it ta n c e ( % ) c 1570 b a 1718
Fig. 2.13 - FT-IR spectra of (a) untreated, (b) MA treated and (c) GMA treated celluloses. CH3 C CH2 C O O H2C CH O HO Cell GMA CH2 Cellulose Step-I Cellulose-GMA CH3 C CH2 C O O H2C CH HO H2C O Cell CH2 CH2 H2C CH O n m C O CH3 CH3 CH CH2 C O O CH2 CH2 H2C C O n m C O CH3 EVA-GMA-Cellulose EVA BTP Step-II CH3 C CH2 C O O H2C CH HO H2C O Cell Cellulose-GMA H2C CH HO H2C O Cell
In Fig. 2.13, curves a, b and c represents the FT-IR spectra of CF1, CF1-MA and CF1-GMA respectively. In the spectrum of CF1-MA an extra peak at 1570 cm-1, corresponding to the stretching of carboxylate COO group (due to the MA ring opening) [128] indicates that reaction between MA monomer and OH group of cellulose took place. On the other hand, in the spectrum of CF1-GMA, an intense carbonyl CO peak (corresponding to methacrylate) centered at 1718 cm-1 is observed supporting the formation of bonding between the epoxy moiety of GMA and OH group of cellulose [73]. Fig. 2.14 (step-I) shows the reaction scheme for the grafting of GMA onto cellulose. The degree of substitution (DS = 0.16) for GMA treated cellulose was calculated on the basis of elemental analysis.
Fig. 2.15 - X-ray diffraction patterns of cellulose (CF1), CF1-MA and CF1-GMA
X-ray diffraction patterns of both plain and treated cellulose fibres (Fig. 2.15) displayed characteristic peaks of crystalline cellulose at about 12.5, 15.8, 22.8 and 29.7 degrees in the 2θ range 10-33° and other secondary peaks at higher 2θ values. The intensity of the peaks was affected by the chemical treatment and crystallinity decreased from 57 % for unmodified cellulose (CF1) to 49 % in the case of CF1-GMA. Similar values of crystallinity, near to 49 %, have been reported for microcrystalline cellulose particles by Eichorn and Young [129].
2.3.2.2 Mixing torque of composites
The examined composite samples with their compositions are reported in Table 2.4. Fig. 2.16 shows the torque response against time for EVA and EVA/CF1 composites. It was found that in presence of initiator EVA alone did not exhibit increase of torque, whereas EVA/CF1, EVA/CF1-MA and EVA/CF1-GMA displayed a significant increase of torque as compared to EVA/CF1 (without initiator). Larger values of torque were recorded for EVA/CF1-GMA respect to EVA/CF1-MA,
indicating for the former system a more effective chemical reaction between the copolymer radicals and the double bond in functional groups of treated cellulose (see Fig. 2.14, step-II). This effect is supported by the melt viscosity data of the composites, as discussed in a next section. However, a rapid jump of torque was observed for EVA/CF1 with BTP that can be related with the occurrence of cross-linking among copolymer chains, likely catalysed by the cellulose fibres.
Table 2.4 List of examined composite samples with their compositions
Composite samples Compositions
(wt.%) EVA/CF1 80/20 80/20 EVA/CF1 80/20 + BTP 80/20 EVA/CF1–MA 80/20 +BTP 80/20 EVA/CF1–GMA 80/20 +BTP 80/20 Time (sec) 0 100 200 300 400 500 600 T o rq u e ( N m ) 0 2 4 6 8 d c a e b
Fig. 2.16 - The torque response of (a) EVA (BTP), (b) EVA/CF1, (c) EVA/CF1-MA (BTP), (d) EVA/CF1-GMA (BTP), (e) EVA/CF1 (BTP) as function of mixing time.
To confirm the occurrence of cross-linking in the composites, solubility tests were carried out in toluene at room temperature. Insolubility of EVA/CF1 (BTP) in toluene indicated that cross-linking took place in presence of initiator, whereas complete solubility was observed for EVA/CF1 and EVA/CF1-GMA which supported the chemical interactions between fibre and matrix.
2.3.2.3 SEM and FT-IR analyses of composites
SEM micrographs of fracture surfaces of the examined composites are presented in Fig. 2.17. It appears that the fracture surface of EVA/CF1 (Fig. 2.17a) shows poor polymer/fibre interfacial adhesion. Otherwise, the fracture surfaces of samples with functionalized cellulose (in presence of BTP) display good interfacial adhesion and the fibre surfaces are coated with a layer of polymer (Fig. 2.17b and c) supporting an improved compatibility of treated cellulose with EVA copolymers. A similar effect has been observed for composites of PP with GMA modified Hemp fibres [73].
Fig. 2.17 - Scanning electron micrographs of composites (a) EVA/CF1, (b) EVA/CF1-MA (BTP), (c) EVA/CF1-GMA (BTP) and (d) EVA/CF1 (BTP).
Fig. 2.18 shows the FT-IR spectra of EVA, CF1-GMA, and cellulose residue obtained after the polymer dissolution of EVA/CF1-GMA. The peaks at 2920 and 2850 cm-1 corresponding to the asymmetric C-H stretching in EVA copolymer [74] (Fig. 2.18c) are also present in the spectrum of cellulose residue (Fig. 2.18b), indicating the existence of polymer onto treated fibres. This observation can be considered as an evidence of chemical interaction between EVA and CF1-GMA, as represented in Fig. 2.14 (step II) for the reaction of treated cellulose with the copolymer. Similarly, cellulose residue obtained from EVA/CF1-MA was also analyzed by FT-IR and no change was observed in the spectrum as compared to CF1-MA.
Wave number (cm-1) 2000 2500 3000 3500 4000 T ra n s m it ta n c e (% ) 2850 2920 a b c
Fig. 2.18 - FT-IR spectra of (a) CF1-GMA, (b) Cellulose residue obtained from EVA/CF1-GMA composite, (c) EVA.
2.3.2.4 Thermal behaviour
DSC cooling thermograms of EVA and its composites with treated and untreated cellulose are shown in Fig. 2.19. The thermodynamic values of phase transitions are reported in Table 2.5. From Table 2.5, it is seen that the Tc of EVA/CF1 composite occurred at a slightly higher temperature as compared to EVA copolymer, suggesting a nucleating effect of cellulose on the crystallization of EVA matrix. The nucleating effect of fibres has been reported for several composite
Temperature (°C) 0 20 40 60 80 100 N o rm a liz e d h e a t fl o w ( e n d o u p )
b
c
d
e
a
Fig. 2.19 - DSC cooling curve of (a) EVA, (b) EVA-BTP, (c) EVA/F1, (d) EVA/CF1-GMA, (e) EVA/CF1-MA
systems, such as PLA/micro-fibrillated cellulose [35], PP/Hemp,[73] and PLA containing various natural fibres [130, 131]. Moreover, it can be noticed that the polymer crystallization enthalpy, Hc, was significantly decreased by the fibre incorporation. On the other side, Tc of EVA/CF1-GMA and EVA/CF1-MA composites occurred at lower temperature as compared to EVA copolymer, probably due to the chemical interactions between modified cellulose and EVA copolymer and to some cross-linking among EVA chains, which hinder the formation of polymer crystals.
Table 2.5 DSC and DMTA phase transition parameters of EVA and composites. Sample Tc (°C) ∆Hc (a) (J/g) Tg (°C) EVA 48.3 15.9 -22.3 EVA (BTP) 48.6 12.1 -22.0 EVA/CF1 49.8 11.9 -19.4 EVA/CF1 (BTP) 45.6 12,4 -18.2 EVA/CF1-GMA (BTP) 45.6 11.5 -19.4 EVA/CF1-MA (BTP) 46.9 10.9 -18.4 (a)
Enthalpy of crystallization per gram of polymer
Temperature (°C) 200 300 400 500 600 D er iv . W ei ght ( % /° C ) 0 1 2 3 4 Cellulose EVA EVA/CF1-GMA EVA/CF1 EVA/CF1-MA 334 443
Fig. 2.20 - Derivative thermogravimetric curves cellulose (CF1), EVA and their composites.
Fig. 2.20 shows the derivative thermogravimetric (DTG) curves of CF1, EVA, EVA/CF1, EVA/CF1-GMA and EVA/CF1-MA obtained in air. The peak temperatures of the various curves are summarized in Table 2.6. Both cellulose and EVA
exhibited two decomposition steps. The weight loss of cellulose at 334 °C is due to the cleavage of the glucosidic linkages of cellulose [132-135]. In the case of EVA, the first step involves the degradation of VA groups, and the second one the degradation of the main chain [82]. In the curves of EVA/CF1, EVA/CF1-GMA and EVA/CF1-MA composites there are also two peaks, the first at 341-350 °C, which corresponds to the 1st thermal degradation of cellulose and EVA and the second at 444-458 °C, which corresponds to the 2nd thermal degradation of cellulose and EVA. In each curve of composites, the first peak was shifted to higher temperature as compared to cellulose indicating that EVA copolymers most likely inhibit the oxidation of cellulose. It is important to notice that composites of EVA with GMA treated cellulose displayed higher thermal stability.
Table 2.6 TGA degradation temperatures of cellulose (CF1), EVA and their composites.
Degradation temperatures (°C) Sample 1st 2nd Cellulose 334 445 EVA 350 443 EVA/CF1 (BTP) 341 444 EVA/CF1-GMA (BTP) 350 458 EVA/CF1-MA (BTP) 340 448 2.3.2.5 DMTA analysis EVA EVA/CF1-GMA EVA/CF1-MA EVA/CF1 Temperature (°C) -60 -40 -20 0 20 40 T an del ta 0,0 0,1 0,2 0,3 0,4 0,5
Fig. 2.21 - Effect of temperature on Tan delta values of EVA/CF1 composites.
Fig. 2.21 shows the effect of temperature on tan δ value of pure EVA and its composites. Cellulose incorporation reduces the tan δ peak height by restricting the movement of the polymer molecules [136]. As reported in Table 2.5, the Tg of EVA increased somewhat in composites, supporting that the glass transition behaviour of EVA matrix was affected by the incorporation of fibres. Chemical bonding at the interface can decrease the relaxational mobility in the polymer segments near the interface causing an increase of Tg, as it has been pointed out for some nanocomposites[137].
2.3.2.6 Mechanical and rheological behaviour
The stress-strain curves recorded in the tensile test for pure EVA, EVA treated with BTP and their composites are shown in Fig. 2.22. It is possible to observe that pure EVA exhibited an initial linear behavior followed by a non-linear part, which indicates plastic deformation. When the initiator is added, the shape of the curve is quite similar but the non-linear part is reduced indicating a decreased ductility. The incorporation of 20 wt.% of cellulose produces a marked change on outline of the curve, minimizing the non-linear part.
0 2 4 6 8 10 0 4 8 12 EVA/CF1 EVA/CF 1-MA(BTP) EVA/CF1-GMA(BTP) EVA/CF1(BTP) EVA(BTP) EVA ( M P a ) Strain (mm/mm)
Fig. 2.22 - Stress-strain curves for pure EVA and composites obtained on tensile test.
The values of Young’s modulus, tensile strength and elongation at break obtained from mechanical tests are summarized in Table 2.7. Comparing pure EVA and EVA (BTP) it is clear that the use of initiator produce a decrease of both tensile strength and elongation at break. However, an increase on the stiffness may be related with the occurrence of cross-linking. When cellulose was incorporated into neat EVA, the rigidity of the material was quadruplicated, due to the higher modulus of cellulose respect to that of EVA, but the other properties were really reduced (about 60 % in strength and 90 % of elongation at break); whereas the
reduction on the elongation at break is related with restrictions of the fibres to the matrix deformation, the drop of tensile strength can be associated to a lower fibre/matrix adhesion as verified by SEM microscopy (Fig. 2.17). On the other hand, when the initiator was used in addition to cellulose fibres, i.e. EVA/CF1 (BTP), the increase of modulus was still higher and, although the elongation at break remained very low, the tensile strength was improved (37 %) with respect to pure EVA - and even more as compared to EVA/CF1 - indicating an enhanced fibre/matrix interface, as demonstrated by SEM. MA treated cellulose contributed to the lesser decrease on elongation at break but the increase in modulus was lower and the tensile strength was again reduced (33 %), demonstrating that the cross-linking may have a better effect on the mechanical properties than compatibility. The last case was the use of GMA treated cellulose: in that case, the tensile strength displayed a similar value of the pure matrix (both effects are compensated), whereas the modulus and elongation at break did not show any significant change with respect to MA treated cellulose.
Table 2.7 Tensile mechanical properties of EVA and composites.
Sample Strength (MPa) Modulus (MPa) Elongation at break(%) Pure EVA 8.66 1.32 10.7 0.10 876.7 50.3 EVA (BTP) 5.40 0.33 12.9 0.44 622.0 102.16 EVA/CF1 3.40 0.39 49.3 4.41 69.7 13.94 EVA/CF1 (BTP) 11.92 0.43 63.3 16.85 65.9 2.56 EVA/CF1-GMA (BTP) 8.46 1.36 45.9 4.4 111.3 11.8 EVA/CF1-MA (BTP) 5.74 0.55 42.9 1.0 117.3 1.59
Table 2.8 Rheological properties of EVA and composites.
Sample ARh nRh Pure EVA 2.005 0.105 EVA (BTP) 2.487 0.000 EVA/CF1 2.981 0.568 EVA/CF1 (BTP) 3.775 0.489 EVA/CF1-GMA (BTP) 3.198 0.329 EVA/CF1-MA (BTP) 2.882 0.116
Values of melt viscosity of composites are plotted in Fig. 2.23 as a function of shear rate. The melt rheology curves were fitted to the classical power law expression:[138]
nRh
Rh
A
(2.1)where the Rh subscript represents a rheological parameter, η is the apparent
viscosity; ARh a preexponential factor; ω the oscillation frequency of the rheometer
equivalent to shear rate and nRh the shear thinning exponent. In the double
logarithmic plot a linear zone at low shear rates can be seen. As reported in Table 2.8, the decrease of nRh indicates a more pseudoplastic character.
0,1 1 10 100 100 1000 10000 EVA/CF1 (P a .s ) (s-1) Pure EVA EVA/CF1-GMA EVA/CF1 (BTP) EVA/CF1-MA EVA (BTP)
Fig. 2.23 - Viscosity as a function of frequency for EVA and EVA/CF1 composites. Points represents experimental data and lines the application of power law model.
Pure EVA together with EVA (BTP) and EVA/CF1-MA (BTP) exhibited a clear pseudoplastic behavior (very low nRh). On the other hand, for EVA/CF1-GMA (BTP) and EVA/CF1 (BTP) showed a pseudo-solid-like behavior with a pronounced shear thinning parameter. In these cases, Newtonian behavior disappeared at low frequency, suggesting a transition from liquid-like to solid-like viscoelastic behavior. The rheological behavior of neat EVA and EVA (BTP) exhibits the characteristic two regions: a Newtonian region at low frequency (<0.1 s-1) and shear thinning region at high frequency (>1 s-1). It is apparent that cellulose fibres have a dramatic effect on the rheological behavior. As 20 wt.% of fibres are added into the polymer matrix, the Newtonian region of the composites disappears and only the shear thinning region remains at the frequency from 0.01 to 100 s-1.
2.3.3. Composites with functionalized EVA
2.3.3.1 Morphology
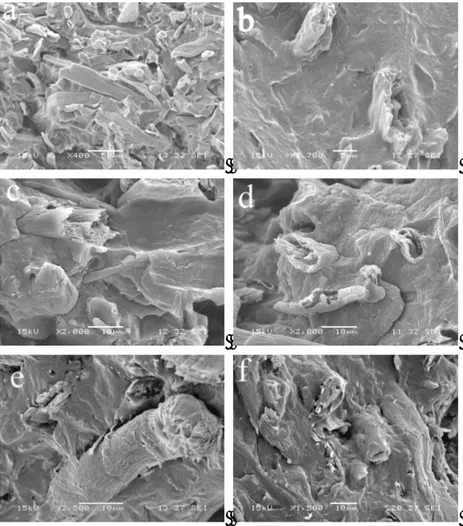
Fig. 2.24 - Scanning Electron Micrographs of the fracture surface of (a) EVA/CF1 80/20, (b) EVA-MA/CF5 50/50, (c) EVA-MA/CF5 70/30, (d) EVA-MA /CF1 70/30, (e) EVA-GMA/CF5 50/50, (f) EVA-GMA/CF5 70/30, (g) EVA-GMA/CF1 70/30
Scanning electron micrographs of the fracture surface of various composite samples (reported in Table 2.9) are presented in Fig. 2.24. It appears that the fracture surface of the sample EVA/CF1 80/20 (Fig 2.24a) shows poor adhesion between fibre and polymer with frequent pullout phenomena of the fibres. Otherwise, the fracture surfaces of samples with functionalized EVA copolymers display good interfacial adhesion and the fibre surfaces are coated with a layer of polymer (Figs. 2.24b-g). This indicates an improved compatibility of EVA-MA and EVA-GMA with fibres and, as it will be later discussed, this effect can be ascribed to the reaction between hydroxyl groups of cellulose and MA, or GMA, on the copolymer chains. Similar findings were reported for PP/Hemp composites [73].
Table 2.9 List of examined composite systems
Composite samples Compositions
(wt.%) EVA/CF1 70/30 70/30 EVA-MA/CF1 70/30 70/30 EVA-MA/CF5 70/30 70/30 EVA-MA/CF5 50/50 50/50 EVA-GMA/CF1 70/30 70/30 EVA-GMA/CF5 70/30 70/30 EVA-GMA/CF5 50/50 50/50 2.3.3.2 Thermal behaviour
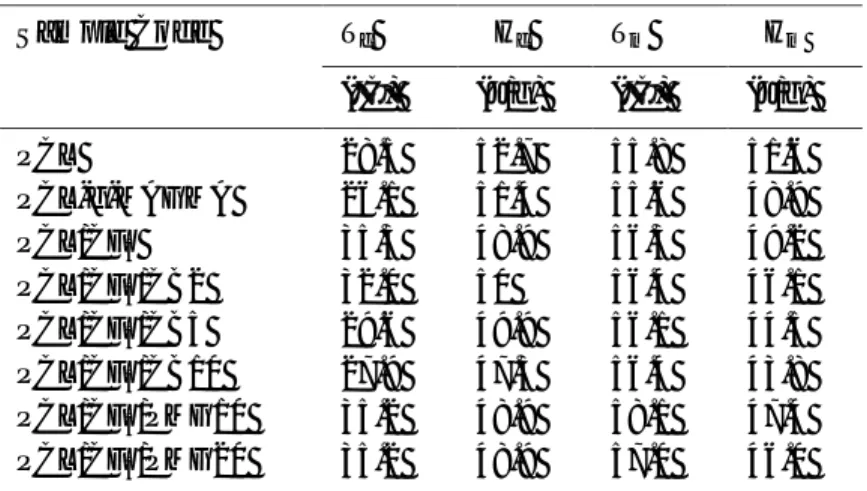
Table 2.10 DSC transition parameters for EVA copolymers and EVA/Cellulose composites.
Sample Tc (°C) ∆Hc (a) (J/g) Tm (°C) EVA 49.3 15.9 67.8 EVA/ CF1 70/30 49.6 12.3 68.3 EVA-MA 48.2 15.1 69.3 EVA-MA/CF5 50/50 49.9 8.9 68.7 EVA-MA/CF5 70/30 49.5 10.7 69.5 EVA-MA/CF1 70/30 50.3 10.6 69.5 EVA-GMA 51.0 14.0 71.4 EVA-GMA/CF5 50/50 51.9 8.6 69.7 EVA-GMA/CF5 70/30 52.0 10.4 70.7 EVA-GMA/CF1 70/30 52.0 11.3 70.5
Temperature, °C 20 40 60 80 100 N o rm a lize d h e a t fl o w e n d o u p W /g a b c d
Fig. 3.25 - DSC cooling curves of (a) EVA-GMA, (b) EVA-GMA/CF1 70/30, (c) EVA-MA, (d) EVA-MA/CF1 70/30 Temperature(°C) 100 200 300 400 500 600 D e ri v . W e ig h t (%/ °C ) 0,0 0,5 1,0 1,5 2,0 a b c 334 432 468
Fig. 2.26 - DTG curves of (a) Cellulose (CF1), (b) EVA-GMA and (c) EVA-GMA/CF1 70/30
DSC cooling thermo-grams of EVA-MA, EVA-GMA and their composites are shown in Fig. 2.25. The thermodynamic values of phase transitions are reported in Table 2.10. The thermo-grams of composites were not significantly affected by the composition and/or type of functional groups. During the cooling scan, the Tc of composites occurred at temperature slightly higher than those of corresponding neat polymers, indicating that cellulose (both CF1 and CF5) can act as nucleating agent in the crystallization of EVA matrix. Similar effect was observed for PLA/micro-fibrillated cellulose [35] and for several polymer composites with natural
fibres [73, 131]. From Table 2.10, it is also seen that the polymer crystallization enthalpy, Hc, was significantly decreased by the incorporation of fibre.
Fig. 2.26 shows the derivative thermogravimetric curves of cellulose (a), EVA-GMA (b) and EVA-GMA/CF1 70/30 composite (c) obtained by heating in air. In the curve of composite (Fig. 2.26c) there are two peaks, the first at 341°C, which corresponds to the thermal degradation of cellulose and the second at 468°C, which corresponds to the thermal degradation of EVA-GMA. The maxima of these peaks are shifted to higher temperature with respect to cellulose (334°C) and polymer (432°C) respectively. This result demonstrates that the composite is more stable than both plain components.
2.3.3.3 FT-IR analysis
Fig. 2.27 shows the FT-IR spectra of composite EVA-MA/CF1 70/30, EVA-MA, cellulose and MA treated cellulose. The spectrum of composite shows a peak at around 3400 cm-1, due to the presence of OH groups of cellulose, and intense peaks around 2850 and 2920 cm-1 that are associated with the C-H asymmetric stretching of the EVA-MA matrix. The peak at 1729 and 1640 cm-1 are related to C=O group of vinyl acetate and adsorbed water of cellulose fibre [139].
Wave number (cm-1) 1000 2000 3000 4000 T ra n s m it ta n c e ( % ) a b c d 1563
Fig. 2.27 - FT-IR spectra of (a) Composite EVA-MA/CF1, (b) EVA-MA, (c) Cellulose (CF1), (d) MA treated cellulose.
The composite displays also a peak at 1563 cm-1, which is not present in the spectra of both cellulose and polymer. This peak can be ascribed to the presence of COOH group, which can be produced by the opening of the maleic anhydride ring during the reaction with the hydroxyl group of cellulose. To become confirmed about the reaction between cellulose and EVA-MA, cellulose was treated with maleic anhydride monomer in dimethyl sulfoxide and then analysed by FT-IR (Fig.
2.27d). The spectrum of MA treated cellulose also shows the peak at 1563 cm-1, which was absent in untreated cellulose. Hence, the peak at 1563 cm-1 in the composite supports the occurrence of chemical interactions between cellulose and EVA-MA. Wave number (cm-1) 1000 2000 3000 4000 T ra n s m it ta n c e (% ) a b c 2852 2852 1371 1371
Fig. 2.28 - FT-IR spectra of (a) Cellulose, (b) Cellulose residue obtained from composites EVA-GMA/CF1 70/30 and (c) EVA-GMA
Fig. 2.28 shows the FT-IR spectra of cellulose, pure EVA-GMA and cellulose residue obtained from EVA-GMA/CF1 70/30 composite. The spectra of pure cellulose and cellulose residue are almost similar. However, a peak at 1371 cm-1 appeared in the spectra of cellulose residue, which can be related to the O-CO-CH3 group of EVA [128]. This peak confirmed the occurrence of chemical interactions in EVA-GMA/CF1 composite.
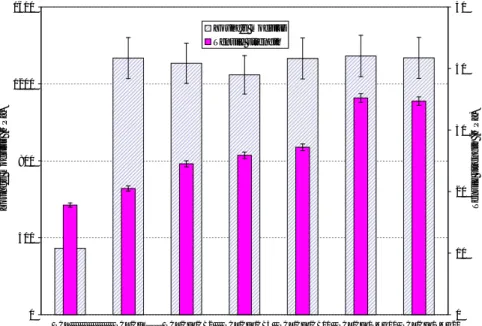
2.3.3.4 DMTA and tensile mechanical tests
Fig. 2.29 shows the effect of temperature on the dynamic modulus of pure EVA, EVA-MA, EVA-GMA and their composites with cellulose. The storage modulus E' of cellulose filled systems are higher than that of pure polymers both in glassy and rubbery region. However, the dynamic modulus curve showed an increase in the E' value above the Tg, in the rubbery region. The increase of E' in the rubbery region reached maximum for composites with 50 wt.% of cellulose (CF5). It is seen from Fig. 2.29 that E' values for EVA-GMA/CF1 are higher compared to EVA/CF1 and EVA-MA/CF1 composites. The effectiveness of fillers on the storage moduli of the composites can be represented by a coefficient CFE related to the ratio [136]:
CFE = (E'g/E'r)comp/(E'g/E'r)matrix (3.2)
where, E'g and E'r are the storage moduli in the glassy and rubbery region respectively, for composites and plain polymers. Higher the value of the coefficient
Temperature (°C) -80 -60 -40 -20 0 20 40 lo g E ' (M P a ) 10 100 1000 a b c d e f
Fig. 2.29 - The effect of temperature on the dynamic modulus of (a) EVA, (b) EVA/CF1 70/30, (c) EVA-MA, (d) EVA-MA/CF1 70/30, (e) EVA-GMA and (f) EVA-GMA/CF1 70/30
Table 2.11 Filler effectiveness, glass transition temperature and tensile properties of polymers and composites
Sample CFE Tg (°C) E (MPa) f (MPa) (%) EVA -22.3 10.7 0.1 8.7 876 EVA/CF1 70/30 0.14 -18.2 75.7 2.4 3.5 36 EVA-MA -15.4 37.5 2.0 16.0 63 EVA-MA/CF5 50/50 0.22 -14.5 EVA-MA/CF5 70/30 0.23 -14.7 122.2 13.1 10.9 23 EVA-MA/CF1 70/30 0.36 -15.2 94.5 1.4 10.4 28 EVA-GMA -36.0 10.0 0.2 5.1 208 EVA-GMA/CF5 50/50 0.02 -43.0 208.1 16.8 12.2 13 EVA-GMA/CF5 70/30 0.05 -39.0 126.1 16.7 10.3 27 EVA-GMA/CF1 70/30 0.08 -31.0 88.2 1.8 8.0 34
CFE, Filler effectiveness constant; Tg, Glass transition temperature; E, Young’s modulus; f, Failure strength; , Deformation at break
CFE, lower the effectiveness of the filler. The measured E' values at -65 and 33°C were employed as E'g and E'r respectively. The values obtained for different
systems at 1Hz frequency are given in Table 2.11. The data pointed out that cellulose was more effective filler in EVA-GMA/CF5 50/50 composite (CFE= 0.02)
compared to EVA-MA/CF5 50/50 (CFE= 0.22) system. In the case of neat polymers, there is a large fall in modulus with increasing temperature. The drop in the modulus on passing through the glass transition temperature is comparatively less for reinforced composites than for non-reinforced matrices. So it may be deduced that cellulose has larger effect on the modulus above Tg than below it. However, the difference between the moduli of the glassy region and rubbery region is smaller in the composites than neat polymers. This can be attributed to the combination of the hydrodynamic effects of the cellulose embedded in a viscoelastic medium and to the mechanical restraint introduced by the cellulose at high concentrations, which reduce the mobility and deformability of the matrix, as reported for other composites with natural fibres [136].
Temperatue (°C) -80 -60 -40 -20 0 20 40 T a n d e lt a 0,0 0,1 0,2 0,3 0,4 a b c d EVA-MA/CF
Fig. 2.30 - Effect of temperature on the tan δ value of (a) MA, (b) EVA-MA/CF5 50/50, (c) EVA-MA/CF5 70/30 and (d) EVA-MA/CF1 70/30
Fig. 2.30 and Fig. 2.31 show the effect of temperature on tan δ of pure EVA-MA and EVA-GMA with their respective composites respectively. Cellulose incorporation reduces the tan δ peak height by restricting the movement of the polymer molecules. From Table 2.11, it is seen that Tg of EVA-MA was not changed by the incorporation of cellulose, whereas Tg of EVA and EVA-GMA were changed by the incorporation of cellulose markedly. It is worthy that Tg of EVA-GMA is decreased in the presence of CF5, while it is increased by CF1. The positive shifting of Tg can be explained as hydroxyl groups of CF1 were likely more available for reaction with the epoxy group of GMA. The width of tan δ peak of composites also became broader than that of the matrix. This behaviour suggests that there were molecular relaxations in the composites that were not present in the pure matrix. Hence, the width of tan δ peak can be indicative of the increased volume of the interface [136].
Temperature (°C) -80 -60 -40 -20 0 20 40 T a n d e lt a 0,0 0,1 0,2 0,3 0,4 a d c b EVA-GMA/CF
Fig. 2.31 - Effect of temperature on the tan δ value of (a) EVA-GMA, (b) EVA-GMA/CF5 50/50, (c) EVA-GMA/CF5 70/30 and (d) EVA-GMA/CF1 70/30 E' (MPa) 0 1000 2000 3000 4000 E '' (M P a ) 0 200 400 600 800 a b c d
Fig. 2.32 - Cole-Cole plot of (a) EVA-MA, (b) EVA-MA/CF5 50/50, (c) EVA-GMA and (d) EVA-GMA/CF5 50/50
Fig. 2.32 shows the Cole-Cole plot of MA (a), MA/CF5 50/50 (b), EVA-GMA (c) and EVA-EVA-GMA/CF5 50/50, where the loss modulus, E'', is plotted as a function of storage modulus, E'. In Fig. 2.32, it is seen that curves of EVA-MA and EVA-GMA are semicircle, which can be accounted for by the presence of a homogeneous polymeric systems, whereas heterogeneous systems generally
show two modified semicircles [140]. The curve of EVA-GMA/CF5 50/50 composite shows large deviation from semicircle, suggesting that larger interphase effects are present in EVA-GMA/CF as compared to EVA-MA/CF. This can be correlated to the reactivity of MA and GMA groups with the OH groups of cellulose. In some case the (equilibrium) reactivity of epoxy functionalized polyolefins has been reported to be higher than that found for maleic anhydride and acrylic acid grafted polyolefins [141]. Moreover, although there is no water formation during ring opening reaction of both anhydride and epoxy moieties with OH of cellulose, MA group on EVA chains is sensitive to moisture and may be hydrolyzed reducing its reactivity; otherwise, epoxy group is stable against moisture [142].
Tensile mechanical properties of polymers and corresponding composites are reported in Table 2.11. Incorporation of cellulose to EVA, EVA-MA and EVA-GMA caused a significant increase of the elastic modulus of the composites due to the higher modulus of cellulose, as observed for other similar systems [73, 143]. Deformation at break was really reduced in all composites. It can be noticed that the failure strength of EVA-GMA/CF composites increased as compared to EVA/CF and EVA-MA/CF. Further, higher values of elongation at break were observed for EVA-GMA composites with respect to EVA-MA based systems.
2.4 Conclusion
Composites with PCL matrix:
Composites of PCL with cellulose microfibres were compatibilized by addition of components chemically modified by different methods. Cellulose esterified with butanoic acid and PCL grafted with MA and GMA were prepared and used as compatibilizers in PCL/CF5 composites. The compatibilized composites displayed significant changes of both morphological, thermal and mechanical properties as compared to the uncompatibilized PCL/CF5 composites. SEM analysis pointed out a better phase dispersion and polymer-fibre interfacial adhesion in all compatibilized systems. DSC and XRD analysis showed that the crystallization behaviour of PCL was significantly affected by the presence of cellulose as well as of modified components. Moreover, the crystallinity of PCL in PCL/CF5/CB composites was found to decrease from 62 to 36% with increasing the CB content, while PCL/PCL-g-MAGMA/CF5 composites exhibited lower crystallinity. It was also found that the composites containing the modified PCL displayed higher interfacial adhesion and mechanical properties than those compatibilized with esterified cellulose. These findings can be accounted for by the occurrence of chemical reactions of anhydride and epoxy groups of PCL-g-MAGMA chains with hydroxyl groups onto fibre surface, whereas in the case of composites containing CB only miscibility effects of alkyl ester groups with PCL can contribute to improve the phase interactions. The results indicate that the polymer modification by melt grafting of functional reactive groups represents a very advantageous route for the control and improvement of properties of PCL/CF5 composites.
Composites with EVA matrix:
The influence of modification of cellulose microfibres with bi-functional monomers (MA and GMA) on the properties of EVA/CF composites was examined. It was
shown that the morphology, as well as thermal, rheological and mechanical properties of the composites were significantly affected by the functionalized fibres. SEM analysis pointed out that the presence of reactive groups on cellulose surface enhanced the compatibility, improving the fibre/matrix interfacial adhesion as compared to unmodified EVA/CF composites. This was correlated with the occurrence of chemical reactions between the double bond of MA and GMA groups onto cellulose and the polymer chains, as demonstrated by FT-IR analysis. All results - and mainly thermal and mechanical data - pointed out the superior performance of EVA/CF-GMA composites, which can be accounted for by enhanced polymer/fibre interactions at the interface. Composites with GMA modified cellulose displayed improved interfacial adhesion, higher thermal stability, good elongation at break and tensile strength as compared to EVA/CF.
Finally, it is worth nothing to mention that modification of EVA copolymer with MA or GMA can also markedly influence the properties of EVA/CF composites. As it has been previously discussed for composites with modified cellulose, the presence of reactive groups on the polymer matrix promoted the compatibilization of EVA/CF, improving the interfacial adhesion. The results of both thermal and mechanical analysis pointed out that GMA modified EVA (EVA-GMA) gave rise to more effective polymer/fibre interactions with respect to MA modified EVA (EVA-MA). The effectiveness of cellulose as a filler for EVA composites was analysed by DMTA on the basis of storage moduli of glassy and rubbery regions. For EVA-GMA/CF a lower value of the CFE coefficient was calculated, supporting a higher effectiveness of cellulose as filler for EVA-GMA with respect to the other systems. Accordingly, an improved thermal resistance and tensile properties – as elastic modulus, failure strength and elongation at break – were disclosed for the composites with EVA-GMA. The glass transition temperature of the composites was also found to be affected by the functionalization of the polymer and type of cellulose (CF1 and CF5).