3.1 Reagents
Phytohemagglutinin (PHA) was from Murex (Dartford, UK) and purified protein derivative (PPD) from Statens Serum Institute (Copenhagen, DK). Recombinant human (rh) IL-2 was from EuroCetus (Milan, I). rhIL-4 and rhIFN-γ were from R&D Systems (Minneapolis, MN, USA), GM-CSF from Sandoz (Basel, CH) and tritiated (3H)-thymidine from Amersham (Little Chalfont, UK). LPS of E. coli, Phorbol 12-myristate 13 Acetate (PMA), ionomycin, brefeldin-A, Staphylococcus aureus enterotoxin A (SEA), Fluorescein isothiocyanate (FITC)-albumin and Hepes were from Sigma Chemical Co. (St. Louis, MO, USA). Phosphatidylinositol dimannosides (PIM2) was gently provided by prof. G. De
Libero (de la Salle et al., 2005), green fluorescent protein recombinant Bacillus Calmette-Guérin (Gfp-rBCG) and purified extract from Parietaria Judaica (Parj1) were respectively provided by Dr. M. Oggioni (Prete et al., 2007) and Dr. G. Di Felice (Prete et al., 2007). RPMI 1640 was used supplemented with 100 U/ml kanamycin, 1 mM glutamine, 1 mM sodium pyruvate, 1% non-essential amino acids (complete medium, CM) (Euroclone Ltd., UK) and enriched with 10% fetal calf serum (FCS) (Hyclone, Logan, UT, USA) for DC cultures or 5% AB of human serum (HS) (Hyclone, Logan, UT, USA) for all the cultures of T cell lines and clones.
3.2
Generation and maintenance of antigen specific human T cell lines
and T cell clones (TCC)
T cell lines specific for PPD or for Parj1 were generated from peripheral blood mononuclear cells (PBMC) of a PPD-(and Parj1-) positive healthy donor. PBMC were purified from heparinized blood on a density gradient (Lymphoprep; Nycomed Pharma AS, Oslo, Norway) and were stimulated (106 cells/well) in 24 well plates (2 ml/well) with PPD (10 µg/ml) or Parj1 (50 µg/ml); in particular, cultures were set up in the presence or absence of 100 U/ml IL-4 to obtain Th2 TCC.
After 5 and 10 days, 10 and 100 U/ml of IL-2, respectively, were added to the cultures. After 5 additional days, cultures showing significant cell growth were considered positive. Cells of positive cultures were counted and cloned by limiting dilution in Terasaki plates in the presence of 5 x 10⁵ irradiated (3000 RAD) allogeneic PBMC, 1 μg/ml of PHA, and 100 U/ml of IL-2 in total volume of 20 μl/well.
After 10 to 13 days, growing cultures were transferred in 96-well plates flat bottom and expanded in medium containing 100 U/ml of IL-2 and finally tested for antigen specificity. PPD or Parj1 specificity was assessed by proliferation assays performed in 96 well plates flat bottom co-culturing TCC (5 x 10⁴ cells/well) with irradiated autologous PBMC (15 x 104 cells/well) prepulsed or not with PPD (10 μg/ml) or Parj1 (50 μg/ml) for 2 days.
Cell proliferation was determined by estimating incorporation of 3H-thymidine into DNA, a process closely related to underlying changes in cell number. 3H-thymidine was added at 1 µCi/well and pulsed for 18 hours in humidified 37°C, 5% CO2 incubator. After the
pulsing time, cells were harvested using an automated multiwell harvester that aspirates cells, lyses cells, and transfer DNA onto filter papers while allowing unincorporated 3 H-thymidine to wash out. Then after addition of scintillation fluid, the incorporated radioactivity was measured in a scintillation counter for beta particles as counts per minute (cpm). The resulting data were analyzed estimating the stimulation index (SI) that represents the ratio of cpm between antigen-stimulated and negative control wells. Clones with cpm>1000 and SI>3 were considered antigen specific.
To test their phenotype, PPD and PJ specific TCC were analyzed for their surface expression of CD4/CD8 and the other characteristic markers of activation, but were also tested for their capacity to secrete IFN-γ (Th1 TCC), IL-4 (Th2 TCC), or both cytokines (Th0 TCC) by intracellular cytokine staining ad flow cytometry analysis (see below). CD1b-restricted TCC were provided by G. De Libero and obtained as previously described (de la Salle et al., 2005). In details, to obtain CD1-restricted TCC it has been used the same procedures described for cloning of CD4 peptide specific T cells with some differences in the generation of T cell lines. Infact, to optimize the possibility to expand lipid-specific CD1-restricted T cells instead of peptide-reactive MHC class I- or II-restricted T lymphocytes, the T cell lines were generated using DCs as professional APCs that express all CD1 molecules. Thus immature autologous monocyte-derived DCs were pulsed overnight with the purified interested lipid antigen PIM2 (10 μg/ml) in serum free CM to
allow internalization and surface expression of CD1-antigen complexes. Then, the pulsed DCs were co-cultured in 96-well plates in 5% AB CM together with autologous PBMC, in a ratio 1:10 (1 x 10⁴ DC : 10 x 104 PBMC), in the presence of blocking anti-MHC class I (W6/32; ATCC, HB-95) and class II (L243; ATCC, HB-55) monoclonal antibodies (mAb) (at 5 µg/ml).
The maintenance and expansion of T cell line and cloning was identical to procedures described above.
For the screening of the antigen-specific CD1-restricted TCC, to allow the lipid antigen loading, 1 x 10⁴ DCs, used as APCs, were pre-incubated with PIM2 (10 μg/ml) for at least 2
hours in serum free medium, then TCC were added in 96-well plates (the 1:10 ratio between stimulatory and responder cells has been respected).
Finally an antigen presentation assay was performed in the presence of anti MHC class I and II and anti CD1 monoclonal antibodies (at 5 µg/ml) (anti-CD1b, WM-25 Immunokontakt, Lugano, Switzerland; anti-CD1a, OKT6, and anti-CD1c, L161, Instrumentation Laboratory, Schlieren, Switzerland) to confirm the restriction element. All the generated TCC were maintained with 5% AB CM supplemented with 100U/ml IL-2 and expanded in cultures with 25- to 35-day cycles of restimulation with PHA (1 μg/ml), irradiated (3000 RAD) allogeneic PBMC at 106cells/ml and IL-2 (100U/ml) .
3.3 Monocytes differentiation experiments
3.3.1 Monocytes isolation and differentiation into “reference” DCs
The heparinized blood from healthy donors was obtained from the Blood Bank of University “La Sapienza” in Rome (Italy).Monocytes-derived DCs from healthy donors were obtained from PBMC. Monocytes were sorted from PBMC using anti-CD14-labeled magnetic beads (MACS, Miltenyi, Germany) according to the manufacturers instructions.
Briefly, the CD14+ cells were magnetically labeled with CD14 MicroBeads. Then, the cell suspension was loaded onto a MACS Column which was placed in the magnetic field of a MACS Separator. The magnetically labeled CD14+ cells were retained within the column. The unlabeled cells run through; this cell fraction was thus depleted of CD14+ cells. After removing the column from the magnetic field, the magnetically retained CD14+ cells could
be eluted as the positively selected highly pure (>95%) cell fraction.
Monocytes isolated were cultured in a 6-well plates (3 ml/well) for 5 days in 10% FCS-supplemented CM containing GM-CSF (at 25 ng/ml; Sandoz, Switzerland) and IL-4 (at 1000 U/ml) at a concentration of 4 x 10⁵ cells/ml, as previously described to induce their differentiation into “reference” DCs (DCk) (Sallusto and Lanzavecchia, 1994). When indicated, at the 5th day of culture DCs were stimulated overnight with 0.2 µg/ml LPS of E.
3.3.2 DCs differentiation from monocytes co-cultured with TCC
To valuate if the specific T cell activation could induce antigen-presenting monocytes to differentiate into DCs, it was first set up a series of 6 days co-cultures of TCC and autologous monocytes.
In particular 4 x 10⁵ PPD-specific TCC, grew in medium without IL-2 for 24 hours and irradiated (1500 RAD), were co-cultured, using 24-well tissue culture plates, with autologous monocytes at 1:1 ratio in the absence or presence of antigen (PPD 10 μg/ml) in 1 ml of 10% FCS CM without the addition of any known monocytes differentiation factor or cytokine (Fig. 8).
After 6 days of culture the phenotypic analysis of CD3-negative cells was done.
In some experiments, 4 x 10⁵ monocytes were cultured for 6 days using 24-well tissue culture plates with freshly isolated autologous peripheral CD4+ lymphocytes, isolated by indirect magnetic sorting with CD4+ T-Cell Isolation Kit (Miltenyi Biotec) at 1:1 ratio in the presence or absence of SEA (0.1 µg/ml) diluted in 1 ml of CM plus 10% FCS .
When indicated, at the 5th day of culture DCs were stimulated overnight with 0.2 µg/ml LPS of E. coli.
After six days of culture the phenotypic analysis, in particular of CD1a/CD14 markers, of CD3-negative cells was done.
Analysis on CD3 -ve cells Autologous
TCC +/- PPD monocyte
6 days of culture (no added cytokines)
Fig. 8: Schematic representation of the experimental model showing the co-culture between TCC and autologous monocytes, in the presence or in the absence of the antigen.
3.3.3 Transwell culture system
To test whether soluble factors released by activated TCC and/or their intimate interaction with monocytes were crucial to induce monocytes differentiation, a series of experiments using a transwell culture system were also performed .
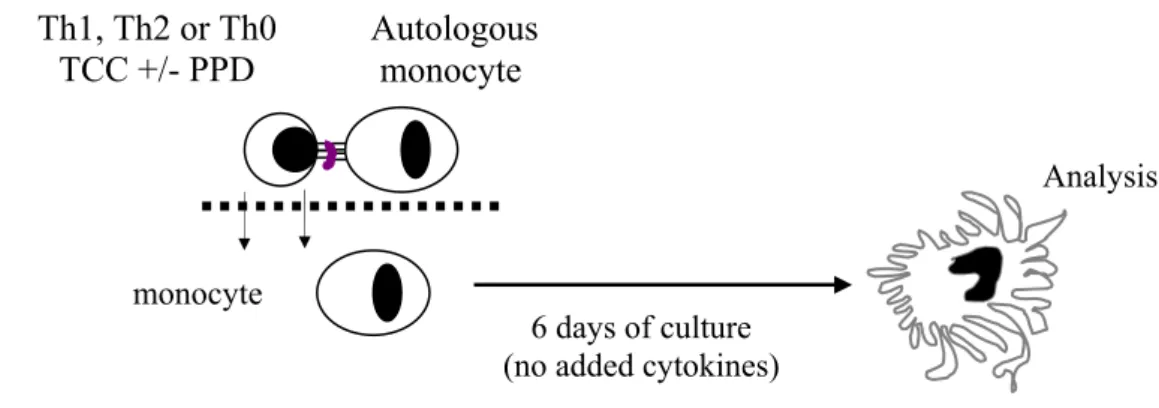
Transwell differentiation experiments were performed using 24-well tissue culture plates (Falcon; Becton Dickinson, Franklin Lakes, NJ, USA) with cell culture inserts (pore size 0.4 µm). In particular, in the upper inserts, PPD or PJ specific Th1, Th2 or Th0 TCC (4 x 10⁵ cell/ml) and autologous monocytes were placed at 1:1 ratio in the absence or presence of antigens (PPD, 10 μg/ml or Parj1, 50 μg/ml respectively) and monocytes from the same or different donors were cultured in the lower chamber (at 4 x 10⁵ cells/ml) in a final volume of 1 ml (Fig. 9).
Using this method, soluble cytokines released from cells in the upper chamber could diffuse to the lower chamber and interact with monocytes in the absence of cell-to-cell contact with TCC.
As a control of antigen specificity, PPD-specific Th2 or Th1 TCC were also co-cultured, in the upper insert of the transwell plate, with autologous monocytes pulsed with an irrelevant antigen, such as Parj1.
When indicated, at the 5th day of culture DCs were stimulated overnight with 0.2 µg/ml LPS of E. coli.
After six days, monocytes from the lower chambers were analyzed.
Th1, Th2 or Th0 Autologous
TCC +/- PPD monocyte
Analysis
Fig. 9 Schematic representation of the transwell culture system adopted.
6 days of culture (no added cytokines) monocyte
3.3.4 DCs differentiation from monocytes cultured with activated TCC supernatants
TCC with different phenotype Th2, Th1 and Th0, were also stimulated with plastic bound-anti-CD3 mAb (Immunotech; 2 µg/ml), in particular 1,5 x 10⁵ cells were plated in 96-well plates in 200 μl of 10% FCS CM. After three days supernatants were collected and stored at -80° C.
To generate the three different types of DCs: DCh2, DCh1 and DCh0, monocytes were cultured in 6-wells plate at a concentration of 4 x 10⁵ cell/ml in a final volume of 3 ml of 10% FCS CM and the three different supernatants of activated Th2, Th1 and Th0 TCC respectively diluted 1:2.
In order to get some lights on the different phenotype of DCh1 compared to DCk and DC h2, monocytes were also cultured at the same concentrations previously described for 6 days with Th1 supernatants in the presence of rhIL-4 (1000 U/ml) or with Th2 supernatants in the presence of rhIFN-γ (200 ng/ml) added from the beginning of the cultures.
Six days cultures of monocytes in the presence of GM-CSF and rhIFN-γ were finally set up in order to confirm the contribution of IFN-γ on the CD1 surface expression and the phenotype of DCh1.
For all the cultures described in this paragraph, when indicated, at the 5th day of culture DCs were stimulated overnight with 0.2 µg/ml LPS of E. coli.
After 6 days different DCs were analyzed for the expression of some surface molecules through a cytometric analysis.
3.4 Flow cytometry and immunostaining
All the following fluorocrome-conjugated mAbs, and their appropriate isotype controls, were purchased from Pharmingen (San Diego, CA, USA): FITCconjugated antiCD1a, -CD1b, -MHC class I, - CD86, -CD40, -CD3, -CD8, -CXCR4, -CD62L, -CCR7 and PEconjugated antiMHC class II DR, CD80, CD83, CD14, DCSIGN, CD4, CCR5, -CD40L, -CD25.
Biotin conjugated anti-CD1c mAb (Cymbus Biotechnology LTD, Hants, UK) was revealed using a human-adsorbed FITC-conjugated streptavidin from Sigma.
The mAb working concentrations were determined by preliminary titration experiments (data not shown).
For extracellular immunostaining, cells were harvested and washed in PBS containing 1% FCS (staining buffer) and incubated (5 x 10⁴ cells) for 20 minutes at 4°C in staining buffer with the mAbs or with the appropriate isotype-matched irrelevant mAb for background determination.
For intracellular cytokines staining, T cells were stimulated with 10-7 M PMA and 1 µg/ml ionomycin for 5 h, with brefeldin-A being added during the last 2 h, then fixed, for 20 minutes on ice and permeabilized using Cytofix/Cytoperm™ (Pharmingen).
Cells were so incubated with mAb, phycoerythrin (PE)-conjugated anti IL-4 or IL-10 and FITC-conjugated anti IFN-γ or IL-2, for 30 minutes at room temperature.
The cells were finally washed twice in staining buffer before analysis.
Stained cells were analyzed by flow cytometry using a Fluorescence activated cell sorting (FACS)can cytometer (Becton Dickinson, Mountain View, CA) equipped with Cellquest Software (Becton Dickinson). Fluorescence intensity was evaluated by computerized analysis of dot plots or histograms generated by at least 5000 viable cells.
3.5 Microscopic evaluation of DCs
Monocytes, differentiated on round shaped coverslips seeded on the bottom of 24-well culture plastic plates, were analyzed in phase contrast mode. Images were acquired with a Leica Image Manages 1000 software using a Leica DFC350FX camera mounted on a microscope Leica model DM 4000B using a 40x objective.
3.6 Phagocytosis assay
DCk and DCs derived from monocytes TCC co-culture (DCh2, DCh1 and DCh0) were incubated 1 h at 37°C with Gfp-rBCG prepared as previously described (Prete et al., 2007) at a multiplicity of infection (MOI) cell:BCG=1:6 in 10% FCS CM and then washed by low-speed centrifugation (100g).
At day 5th of culture the DCk, DCh2, DCh1 and DCh0 cells were incubated in the presence or absence of 0.2 μg/ml LPS for an additional 18h.
The percentage of cells that bound Gfp-rBCG was analyzed by flow cytometry.
Results were expressed as reductions in the percentages of Gfp-rBCG phagocytosis upon LPS-stimulation + standard deviations of four independent experiments.
3.7 Endocytosis assay
Endocytosis was evaluated using FITC-Albumin in 10% FCS CM plus 25 mM Hepes for 1 h at 37°C, as described (Sallusto and Lanzavecchia, 1994).
DCs were harvested and distributed in polypropylene tubes (2x10⁵ cells/tube), some of them were transferred to a water-bath at 37°C and the others at 0°C on ice; after 1-2 min, FITC-Albumin (1 mg/ml), diluted in 10% FCS CM plus 25 mM Hepes was added to start the incubation periods. Four different times of incubation (7’, 15’, 30’, 60’) were performed. At each stop point, was immediately added 4 ml cold-PBS-1%FCS + NaN3 and washed 4 time with the same buffer in a cooled centrifuge. Then pellets were transferred to FACS tube and the results were read using propidio iodide (PI) to exclude death cells.
The best performance of endocytosis by DC was obtained after 1 hour of incubation at 37°C so that it has been decided not to repeat all the incubation times in the other experiments.
At day 5th of culture the DCk, DCh2, DCh1 and DCh0 cells were incubated in the presence or absence of 0.2 μg/ml LPS for an additional 18h.
The FITC-albumin up-taken by DCs was analyzed by flow cytometry.
Results are expressed as reductions in the mean fluorescent intensity upon LPS-stimulation + standard deviations of four independent experiments.
3.8 Isolation of naïve CD4
+T cells
The blood samples from healthy newborns umbilical cord were kindly provided by the Unit of Obstetrics and Gynaecology, San Giovanni Hospital in Rome (Italy).
The naïve CD4+ Th cells were sorted from PBMC using an indirect magnetic labelling system for the isolation of untouched naïve CD4+ Th cells (MACS, Miltenyi, Germany) according to the manufacturers instructions.
Briefly, memory Th cells and non-Th cells, i.e. CD45RO+CD4+ Th cells, B cells, NK cells, DCs, monocytes, granulocytes and erythroid cells, are indirectly magnetically labeled using a cocktail of biotin-conjugated antibodies against CD8, CD14, CD16, CD19, CD36, CD45RO, CD56, CD123, TCR γ/δ and Glycophorin A, and Anti-Biotin MicroBeads; so that isolation of highly pure (> 95%) naïve CD4+ T cells is achieved by depletion of magnetically labelled cells.
3.9 Priming of naïve T cells
DCk, DCh2, DCh1 and DCh0 were generated from monocytes, then at day 5th of culture were incubated in the absence or presence of 0.2 μg/ml LPS for an additional 18 h and used as APCs in MLR experiments to valuate their capacity to induce allogeneic naïve T cells proliferation.
Thus decreasing numbers (five-fold dilutions) of DCs, starting from 1 x 10⁴, were cultured
with 3 x 10⁴ cord blood CD4+ T cells (purified by indirect magnetic sorting as previously
described) in 200 μl of 10% FCS CM in 96-well plates flat bottom.
T cell proliferative response was measured after 6 days of co-culture by a 16-h pulse with
3H-thymidine (1µCi/well).
In parallel cultures, in which 2.5 x 10⁴ DCs were cultured with 25 x 104 cord blood CD4+ T cells in 48-well plates with 1 ml of CM supplemented with 10% FCS, supernatants were harvested for cytokine determination by ELISA and T cells were stimulated with PMA/ionomycin for a cytometric evaluation of their intracellular cytokine accumulation (as previously described).
3.10 Antigen presentation assay
To test the capacity of the different DC populations to stimulate memory T cells, DCk, DCh2, DCh1 or DCh0 were used to stimulate a PPD-specific MHC Class II-restricted or PIM2-specific CD1b-restricted TCC.
Responder TCC (3 x 10⁴ cells) were co-cultured with non-LPS stimulated DC (4 x 10³ cells) in 96-well flat-bottom plates. Antigens, starting from a concentration of 5 μg/ml, were added at five-fold dilutions. T cell proliferation was measured after 48 h of culture by a 16-h pulse with 3H-thymidine.
TCC and autologous monocytes were co-cultured in the presence of PPD (10 µg/ml). After 3 days the supernatants were collected and the amounts of released cytokines measured by ELISA.
3.11
Enzyme Linked ImmunoSorbent Assay (ELISA)
Th1, Th0 and Th2 PPD-specific TCC and autologous isolated monocytes were co-cultured in the presence of PPD (10 μg/ml). After 3 days the supernatants were collected and the
amounts of released IFN-γ, IL-4 and GM-CSF determined using commercially available ELISA kits (R&D System, Inc., Minneapolis, MN, USA).
At day 5th of culture the DCk, DCh2, DCh1 and DCh0 cells were incubated in the presence or absence of 0.2 µg/ml LPS for an additional 18 h. Supernatants were collected at the end of the culture and examined for IL-12p70 and IL-10 contents by ELISA kits (R&D) according to the manufacturers instructions.
Briefly, the ELISA used were a two immunological step sandwich type assays. In the first step the cytokine was captured by a mAb bound to the wells of a microtiter plate. In the second step a biotinylated monoclonal antibody was added together with streptavidin-peroxidase conjugate. The biotynilated antibody bound to the solid phase antibody-antigen complex and, in turn, bound the conjugate. After incubation, the wells were washed and the antigen complex bound to the well detected by addiction of a chromogenic substrate. The intensity of the coloration was proportional to the cytokine concentration in the sample or calibrator (the calibrator was calibrated by reference to the WHO of each cytokine standard).
Detection limit of the assays: 15 pg/ml.
The results were expressed as ng/ml or pg/ml + error standard of triplicates wells of several experiments.
3.12 Cytotoxic T-cell line (CTLL2) assay
The IL-2 content was measured as U/ml in a biological assay measuring the CTLL2 (no. TIB214; American Type Culture Collection) proliferation (Woerly et al., 1999) and rhIL-2 as standard.
Absence of IL-2 from IL-2-dependent cells, such as the CTLL2, causes DNA fragmentation and apoptosis, so that this is a good method to measure the IL-2 content in the DC supernatants.
In brief, CTLL2 cells were maintained in a CM supplemented with 10% FCS and 1% IL-2, harvested and wash 5 times to remove all the IL-2; then 5 x 10⁴ CTLL-2 cells per well were cultured in 96-well platesflat bottomwith serial dilutions of rhIL-2 (5 fold increase starting from 100 U/ml), useful to obtain a reference standard curve, or DC supernatants (at a 50% dilution) in a final volume of 200 µl, for 24 hat 37°C in 5% CO2.
All assays were performedin duplicate.
3.13 Real time Polymerase Chain Reaction
(PCR)
To prepare cells for RNA extraction DCk, DCh2, DCh1 and DCh0 at day 5th of culture, and TCC were harvested and distributed in tubes at the amount of 1.5x10⁶, then
centrifugated, risuspended with buffer and stored at -80°C.
To measure cytokine mRNA expression, total RNA was extracted from 1.5x10⁶ cells (TCC or DC) using RNeasy kits (Quiagen, Hilden, Germany) as described by the manufacturer and quantified by optical density.
100 ng of total RNA was reverse transcribed using the high-capacity cDNA Archive Kit (Applied Biosystems, Foster City, CA, USA), random hexamer primers in a ABI Prism 7000 Sequence Detector System using the following thermal profile: 25°C for 10 min, 42°C for 1 h and 95°C for 5 min. PCR reactions were performed in triplicate on the ABI Prism 7000 Sequence Detector System using TaqMan chemistry with primer and probe sets from the Assay-on-Demand list (all from Applied Biosystems). For each gene, standard curve was compared to the standard curve of the reference and calculation of the slope of log [ng RNA] vs. ΔCt was always <0.1.
Fold induction was then calculated by ΔΔCt method (Livak and Schmittgen, 2001) using 18S mRNA level to normalize values and the mRNA level of basal condition (non activated T cells or immature DCk) as a calibrator.
3.14 Statistical analysis
The statistical significance of the differences between groups of data with a normal distribution was determined by the analysis of variance (ANOVA) with Bonferroni-Dunn post-tests using the Statview 4.1 program (Abacus Concepts, Inc. Berkeley, CA, USA). In ELISA tests, group comparisons were performed with the Student’s test by using the SPSS program (SPSS Inc., Chicago, III.).