A
A
l
l
m
m
a
a
M
M
a
a
t
t
e
e
r
r
S
S
t
t
u
u
d
d
i
i
o
o
r
r
u
u
m
m
–
–
U
U
n
n
i
i
v
v
e
e
r
r
s
s
i
i
t
t
à
à
d
d
i
i
B
B
o
o
l
l
o
o
g
g
n
n
a
a
DOTTORATO DI RICERCA IN
INGEGNERIA CIVILE E AMBIENTALE
Ciclo XXVI
Settore Concorsuale di afferenza: 08/B1 Settore Scientifico disciplinare: ICAR/07
TITOLO TESI
GEOTECHNICAL CHARACTERIZATION OF MIXED SANDY AND SILTY
SOILS USING PIEZOCONE TESTS: ANALYSIS OF PARTIAL DRAINAGE
PHENOMENA AND RATE EFFECTS ON THE EXPERIMENTAL SOIL
RESPONSE
Presentata da: María Fernanda García Martínez
Coordinatore Dottorato Relatore
Prof. Ing. Alberto Lamberti Dott. Ing. Laura Tonni
iii
v
Acknowledgements
First of all I would like to acknowledge the support and guidance I received from my super-visor Dr. Laura Tonni throughout this study. I really admire her tenacity, dedication and achievements in the field of Geotechnical Engineering. At the same time I would like to thank Professor Guido Gottardi for his guidance, encouragement and valuable suggestions. I really ap-preciate all their helps. The contributions of Dr. Gianfranco Marchi and Dr. Massimo Romagnoli are also greatly appreciated.
I wish to thank all the special people I have met in Bologna during the last three years, from whom I received their friendship and help in the most stressful times.
Finally, I would like to give thanks to my mother, for her unconditional love, support and encouragement throughout my lifetime.
vii
Abstract
The cone penetration test (CPT), together with its recent variation (CPTU), has become the most widely used in-situ testing technique for soil profiling and geotechnical characterization. The knowledge gained over the last decades on the interpretation procedures in sands and clays is certainly wide, whilst very few contributions can be found as regards the analysis of CPT(u) data in intermediate soils.
Indeed, it is widely accepted that at the standard rate of penetration (v = 20 mm/s), drained penetration occurs in sands while undrained penetration occurs in clays. However, a problem arise when the available interpretation approaches are applied to cone measurements in silts, sandy silts, silty or clayey sands, since such intermediate geomaterials are often characterized by permeability values within the range in which partial drainage is very likely to occur. Hence, the application of the available and well-established interpretation procedures, developed for ‘stan-dard’ clays and sands, may result in invalid estimates of soil parameters.
This study aims at providing a better understanding on the interpretation of CPTU data in natural sand and silt mixtures, by taking into account two main aspects, as specified below: 1) Investigating the effect of penetration rate on piezocone measurements, with the aim of
identifying drainage conditions when cone penetration is performed at a standard rate. This part of the thesis has been carried out with reference to a specific CPTU database recently collected in a liquefaction-prone area (Emilia-Romagna Region, Italy).
2) Providing a better insight into the interpretation of piezocone tests in the widely studied silty sediments of the Venetian lagoon (Italy). Research has focused on the calibration and verifi-cation of some site-specific correlations, with special reference to the estimate of compressi-bility parameters for the assessment of long-term settlements of the Venetian coastal de-fences.
ix
Table of contents
Acknowledgements...v Abstract...vii 1 INTRODUCTION...1 1.1. Background……...11.2. Aims and objectives...3
1.3. Outline of the thesis...4
2 CONE PENETRATION TEST...5
2.1 Introduction...5
2.2 Test equipment and Procedures...6
2.3 CPT interpretation...9 2.3.1 Soil type...9 2.3.2 Drained CPT penetration...14 2.3.2.1 Stiffness...14 2.3.2.2 In situ state...16 2.3.2.3 Shear strength...18
2.3.2.4 Brief introduction to soil liquefaction evaluation...18
2.3.3 Undrained penetration...23
2.3.3.1 In situ state and undrained shear strength...23
2.3.3.2 Constrained modulus...25
2.3.3.3 Coefficient of consolidation from monotonic dissipation tests...25
2.4 Partially drained conditions on cone penetration testing...27
3 VARIABLE RATE CPTU IN SILTY SAND DEPOSITS...35
3.1 Introduction...35
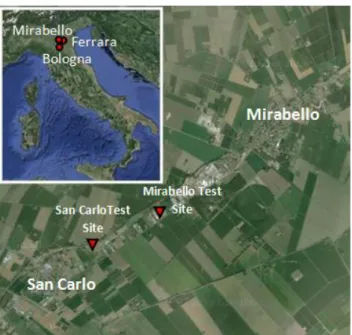
3.2 Site details...37
3.3 Piezocone testing programme ...38
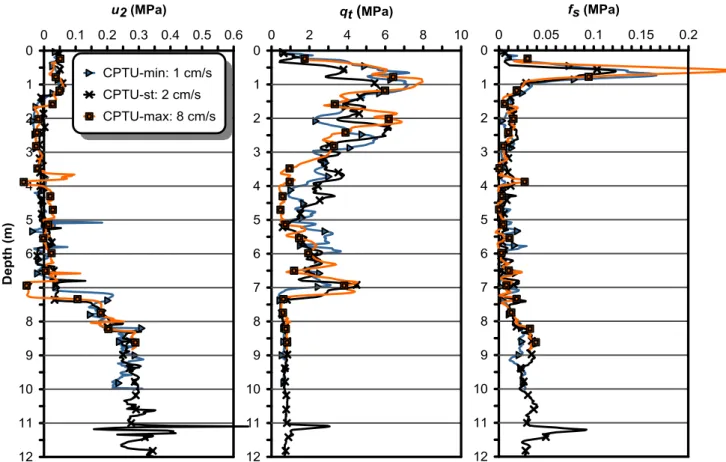
3.3.1 Mirabello Site...38
3.3.2 San Carlo Site...44
3.4 Assessing soil liquefaction potential...49
3.5 Analysis of penetration rate effects...53
3.5.1 Mirabello Site...53
3.5.2 San Carlo Site...60
3.6 Some remarks on the evaluation of the coefficient of consolidation...64
4 THE VENETIAN LAGOON...69
x
4.2 Venetian Lagoon sediments...72
4.3 Site characterization...75
4.3.1 The Treporti Test Site...78
4.4 The MOSE mobile barriers...85
5 CHARACTERIZATION OF VENETIAN SILTY SOILS FROM CPTU...87
5.1 Introduction...87
5.2 Soil classification...89
5.3 Compressibility characteristics...91
5.4 Consolidation analysis...99
5.5 Stress level effects...101
5.6 Stress history...106
5.7 The issue of partial drainage in Venetian silty soils...108
6 PREDICTING LONG-TERM SETTLEMENTS OF COASTAL DEFENCES OF THE VENETIAN LAGOON...111
6.1 Introduction...111
6.2 Persistent Scatterer Interferometry monitoring...113
6.3 The piezocone database...116
6.4 Soil classification...118
6.4.1 Malamocco: external breakwater...118
6.4.2 Chioggia: external breakwater ...127
6.4.3 Lido: artificial island...131
6.5 Soil compressibility characteristics from CPTU...137
6.5.1 Constrained modulus...137
6.5.2 Coefficient of secondary compression...138
6.6 Predicting long-term settlements of coastal defences...143
7 NUMERICAL MODELLING OF COASTAL DEFENCES OF THE VENETIAN LA-GOON...151
7.1 Introduction...151
7.2 Soft Soil Creep model...152
7.2.1 Soft Soil Creep model: One dimensional creep...154
7.2.1.1 Compression parameters ...155
7.2.1.2 Differential law for one-dimensional creep...157
7.2.1.3 The overconsolidation ratio (OCR) in the SSC model...160
7.2.2 Soft Soil Creep model: Three dimensional creep...161
7.3 Two-dimensional numerical modelling...164
xi
7.3.1.1 Malamocco: external breakwater...173
7.3.1.2 Chioggia: external breakwater...179
7.3.2 Calculation stages...184
7.3.3 Results...185
7.4 Three-dimensional numerical modelling...190
1
CHAPTER 1: INTRODUCTION
1.1. Background
The cone penetration tests (CPT/CPTu) are widely used in situ testing devices for site char-acterization. The basic measurements obtained are the cone penetration resistance (qc), the sleeve friction (fs) and in the case of CPTu, the pore water pressure (u). During CPT at standard pene-tration rate of 20 mm/s, it is well accepted that fully drained conditions prevail for sands and fully undrained conditions prevail for clays. However, CPT interpretation in intermediate soils, including silty soils and a large variety of mixed soil types, is a rather complicated task since partially drained conditions may pertain at 20 mm/s. Hence, interpreting properties of interme-diate soils with methods developed for either drained or undrained penetration, may induce in-correct estimates of soil parameters.
In recent years, the issue of partial drainage conditions during cone penetration tests has been tackled by several researchers (e.g. Schnaid et al., 2004; Randolph and Hope, 2004; Schneider et al., 2007), all emphasizing that the preliminary evaluation of drainage conditions is of crucial importance in order to properly interpret the in situ soil response.
As observed by Randolph and Hope (2004), a simple and effective procedure to analyse the effect of partial drainage on piezocone measurements and to detect the transition point from undrained to partially drained and drained responses is to conduct penetration tests at different penetration rates. The influence of penetration rate and soil drainage conditions (horizontal coef-ficient of consolidation) on the consolidation conditions can be captured by the non-dimensional penetration rate (Finnie and Randolph, 1994), V = v·d/ch, where v is the velocity, d is the diame-ter of the cone and ch is the coefficient of consolidation. Normalization of penetration rate and CPTU measurements accounts for data at different depths and enables to derive trend curves of cone penetration resistance and excess pore water pressure. Drained conditions prevail during slow penetration, whereas undrained conditions prevail during rapid penetration. Within this context, experience has been mainly accumulated in centrifuge tests using laboratory reconsti-tuted samples (kaolin clay and silty clay). However, there have been less contributions based on results from field tests and full size penetrometers (e.g. Kim et al., 2008; Tonni and Gottardi, 2009; Schnaid et al., 2010; Suzuki et al., 2012).
Over the last decades, the silty soils of the Venetian lagoon (Italy) have been thoroughly in-vestigated. The analysis of the large amount of data collected over the last years at the Treporti test site (Venice), confirmed the great potential of cone penetration test as an in-situ method, es-pecially for stratigraphic profiling of the predominantly silty sediments of the Venetian lagoon. However, the experience gained on the interpretation of piezocone data also revealed significant
2 limitations of the existing approaches for the characterization of such sediments of the Venetian lagoon, thus suggesting a critical review of empirical and theoretical formulations in relation to their applicability to such soils (Tonni and Gottardi 2011). Indeed, due to the essentially silty nature of such subsoil, partial drainage is very likely to occur during cone penetration at the standard penetration rate (20 mm/s). Accordingly, more suitable site-specific correlations, with special reference to compressibility properties, have been recently proposed (e.g. Tonni et al., 2010; Tonni and Gottardi, 2011; Bersan et al., 2012; Tonni and Simonini, 2013).
3
1.2. Aims and objectives
The aims of this research are to provide a better insight into CPTU-based geotechnical char-acterization of intermediate soils (silts, sandy silts, silty or clayey sands), taking into account that in such intermediate materials partial drainage conditions are very likely to occur during cone penetration. This will be attained by the following objectives:
Execution of a set of piezocone tests with various penetration rates in silty sand deposits of the Emilia-Romagna Region (Italy).
Interpretation of such cone penetration data, together with a number of associated dissipa-tion test measurements, according to advanced procedures recently proposed in the litera-ture.
Interpretation of a set of offshore piezocone tests assembled over the last years at the three Venetian lagoon inlets (Italy), carried out prior to the recent construction of some coastal structures along the coastline. Classification of Venetian sediments from piezocone meas-urements has been performed using some well-known classification charts.
Prediction of the long-term response of Venetian coastal defences using a one-dimensional settlement method in conjunction with a secondary compression coefficient profile deter-mined by the available offshore piezocone tests and based on a formulation recently cali-brated on field data from a Test Site located in the Venetian lagoon area.
Modelling of the long-term response of Venetian coastal defences using a finite element ap-proach in conjunction with an appropriate constitutive formulation, specifically intended for simulating the creep behaviour of soft soils (Vermeer and Neher, 1999); calibration of the constitutive parameters using some CPTU-based empirical correlations developed within the research project carried out at the Treporti Test Site.
Validation of the approach comparing the estimated settlements with vertical displacement measurements provided by a very accurate monitoring system, based on an advanced tech-nique known as Persistent Scatterer Interferometry.
4
1.3. Outline of the thesis
Chapter 1 introduces the background of the research, objectives and outline of the thesis.
Chapter 2 presents a review regarding the cone penetration test (CPT) interpretation.
Chapter 3 presents the results of a field testing programme of cone penetration test con-ducted at different penetration rates in liquefaction-prone silty sand deposits of the Emilia-Romagna Region (Italy). Such results are interpreted according to advanced procedures. The drainage (backbone) curves obtained, relating the variation of the normalized penetration re-sistance or excess pore water pressure with the normalized penetration rate are used to iden-tify the degree of drainage.
Chapter 4 introduces a brief description of the interventions for safeguarding Venice from high tides. It describes the geological characteristics of Venice lagoon soil and the geotech-nical investigation carried out during the last decades in the area, with special reference to the in situ piezocone campaigns performed at the Treporti Test Site (TTS).
Chapter 5 presents the characterization of Venetian silty soils from CPTU carried out at the TTS: soil classification and assessment of soil properties.
Chapter 6 extends the investigation and presents a new database of offshore piezocone tests carried out near the three lagoon inlets, in relation to the construction of some coastal de-fences. The stratigraphic condition of the lagoon basin in these different areas is derived, as well as the relevant geotechnical parameters of the different soil units, with special reference to compressibility properties. The long-term response of such structures is also performed using a 1-D settlement method using two site-specific empirical correlations recently cali-brated on Treporti field data to determine the secondary compression coefficient profile. Fi-nally, the approach is validated comparing the estimated settlements with those measured by advanced techniques.
Chapter 7 presents a review of the Soft Soil Creep (SSC) model formulation and the nu-merical results of the modelling of the long-term response of Venetian coastal defences us-ing the finite element code PLAXIS. The SSC model is used for simulatus-ing the creep behav-iour of such soils and the results are compared with settlement measurements provided by advanced techniques.
5
CHAPTER 2: CONE PENETRATION TEST
2.1 Introduction
Over the last few decades, the electronic cone penetration test (CPT) has been established as one of the most widely used in situ methods for site characterization. The CPT major advantages are:
Quick and near continuous profiling
Repeatable and reliable data
Economical
Strong theoretical background for interpretation
These advantages have led to a continuous increase in the use and application of the CPT worldwide. Nevertheless, the CPT may also have some disadvantages:
Skilled operators needed
No soil sampling
Relatively high fund investment
Can be restricted in gravel/cemented soils
Despite it is not possible to get soil samples during the test, it is possible to obtain them us-ing CPT pushus-ing equipment. As recommended by Robertson and Cabal (2012) in the Guide to Cone Penetration Testing, it is convenient to first perform several CPT soundings to define the stratigraphic profile and obtain initial estimates of geotechnical parameters and then proceed with selective sampling.
6 Important developments have been carried out in the experimental and theoretical knowl-edge of the process of the CPT penetration and the effect of soil parameters. Since real soils are very complex materials and difficult to be well-captured in a simple model, semi-empirical cor-relations tend to dominate in practice even though nearly all are well supported by theory (Robertson, 2012).
2.2 Test equipment and Procedures
A CPT system consists of the following components: an electrical penetrometer, a hydraulic pushing system with rods, depth recorder, cable or transmission device and data acquisition sys-tem. Most systems used nowadays include pore pressure measurements (i.e., CPTu). The meas-ure of the shear-wave velocity (Robertson et al. 1986b) is also becoming popular (i.e., SCPTu) and provides a useful insight into correlations between CPT results and soils modulus. Therefore, it is common to see a profile combining cone penetration resistance (qc), sleeve friction (fs) and pore pressure (u) and sometimes shear-wave velocity (Vs). Furthermore, if dissipation tests are performed, the consolidation characteristics can be evaluated.
The penetrometers are usually available in two standard sizes: (1) with a base area of 10 cm2 (diameter = 35.7 mm) and (2) with a base area of 15 cm2 (diameter = 44 mm). Whereas the 10-cm2 size is the original standard size, the 15-cm2 version has been found by numerous commer-cial companies to be stronger for routine profiling.
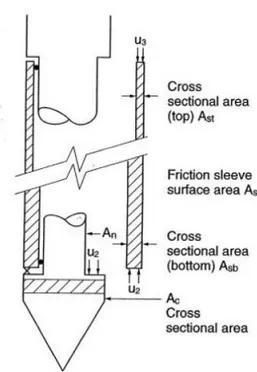
Depending on the types of soils being tested, the porous filter is usually located at the apex or midface (u1 position) or at the shoulder (u2 position) just behind the cone tip. It can be also
positioned behind the sleeve (u3 position).
The u2 position is required by international standards for the proper correction of measured
cone tip resistance to total resistance (Campanella and Robertson, 1988). The effect of the ambi-ent pore pressure acting on the shoulder just behind the cone and on the ends of the friction sleeve is often referred to as the unequal end-area effect (Campanella et al. 1982). Whilst many commercial cones have equal end-area friction sleeves, the unequal end-area effect is always present for the cone resistance and has to be corrected.
This correction can be important in soft-fine grained soils where qc is low compared to the high pore water pressure u2 due to the undrained penetration:
) 1 ( 2 a u q qt c (2.1)
where a is the net area ratio determined from laboratory calibration. It typically ranges between 0.70 and 0.85. In sandy soils, where qc is large relative to pore water pressure u2, this correction
7 Despite the increasing popularity of the CPTu, on on-shore testing the accuracy and preci-sion of pore pressure measurements are not always reliable and repeatable due to loss of satura-tion of the pore pressure element (Robertson, 2009). Before each cone penetrasatura-tion test, the po-rous element and sensor must be saturated with silicon oil or glycerin (Campanella et al., 1982) and sometimes with grease. However, for onshore projects the cone often penetrates some meters through unsaturated soil before it reaches saturated soil. In this case, the cone pore pressure sen-sor may be de-saturated because of suction if the unsaturated soil is either clay or dense silty sand. Although the loss of saturation has been minimized by the use of viscous liquids, it has not totally removed the problem.
An additional complication is when the cone penetrates through saturated dense silty and or very stiff overconsolidated clay. In this way, due to the dilative nature of the soil, the u2
meas-ured can become negative causing loss of saturation in the sensor.
Although it may be difficult to evaluate when the cone is fully saturated, in ground condi-tions where the soil is mainly soft and the water level is close to the surface it is possible to ob-tain good pore water pressure measurements (Robertson, 2012).
Despite pore pressure measurements for onshore testing may be less reliable than cone resis-tance, it is suggested to obtain them. Pore pressure measurements allow correction to qt for un-equal end area effects and provide a qualitative evaluation of drainage conditions during the test and helps in evaluating soil classification (Robertson, 2012). In addition, dissipation tests allow evaluating consolidation characteristics.
8 It is well-known that sleeve friction fs measurements are in general less reliable in compari-son to cone resistance in most soft fine-grained soils. The inaccuracy in fs measurement is mainly due to the unequal end area effects, surface roughness of the sleeve, tolerance in dimensions be-tween the cone and sleeve and load cell design and calibration (Lunne and Andersen, 2007).
In the 1980’s subtraction cone designs became popular because of the improved robustness. In subtraction cones the fs is derived by subtracting the tip load from the total tip force plus sleeve. Nevertheless, in subtraction cone designs any zero load instability of the load cells results in a loss of accuracy in the calculated sleeve friction in soft soils. Hence, for accurate sleeve fric-tion measurements in soft soils, it is recommended that cones have independent load cells (Robertson, 2012). Figure 2.3 shows designs for cone penetrometers using either separated load cells or subtraction load cells.
With good quality control (surface roughness, zero load readings and tolerances) and design (independent load cells and equal end area friction sleeve), accuracy in sleeve friction measure-ments could be obtained (e.g. Robertson, 2009). However, sleeve friction measuremeasure-ments will be in general less accurate than cone resistance in soft fine-grained materials (Robertson, 2009).
Figure 2.3: Design for CPTs: a) Tip and sleeve friction load cells in compression, b) Tip load cell in compression and sleeve friction load cell in tension, c) subtraction type load cell design (Lunne et al., 1997; Robertson and Cabal,
9
2.3 CPT interpretation
2.3.1 Soil type
The parameters obtained from piezocone penetration tests (CPTu) are commonly used to ob-tain soil stratigraphy and identification of soil type. This has been carried out using charts that associate measured parameters to soil type.
Pioneer charts using cone resistance qc and friction ratio Rf (=fs /qc·100%) were proposed by Schmertman (1978) and Douglas and Olsen (1981). However, the original chart proposed by Robertson et al. (1986a), based on qt and Rf (Figure 2.4), became very popular. This non-normalized chart defines 12 soil behaviour type (SBT) zones and uses the corrected cone resis-tance qt, which is nearly equal to qc in coarse-grained soils but in soft fine-grained soils the dif-ference among them would increase.
The normalized chart proposed by Robertson (1990) uses normalized cone resistance Qt (
qt v0
/'v0 ) and normalized friction ratio Fr (
f /
qt
v0
100%) and defines 9zones. The difference between this early charts proposed by Robertson led him to suggest an up-date on the first chart (e.g. Robertson, 2010a), as is shown in Figure 2.5. As can be seen, both are dimensionless and define 9 SBT zones.
These CPT-based classification charts are termed as Soil Behaviour Type (SBT) charts, since the cone responds to the in situ mechanical behaviour of the soil and not to classification based on grain size distribution and soil plasticity carried out on disturbed samples (e.g. Unified Soil Classification System, USCS). Although CPT-based SBT often agrees well with USCS-based classification, differences arise when classifying mixed soils (e.g. Robertson 2009).
10 Figure 2.5: Updated SBT charts based a) non-normalized and b) normalized CPT (Robertson 2010a; Robertson,
2012)
The normalized cone parameters Qt1, Fr (%) and Bq proposed by Robertson (1990) to esti-mate soil behaviour type are expressed as follows:
0
0 1 t v / 'v t q Q (2.2)
/ 0
100% t v r f q F
(2.3)
2 0
/ t v0
/
t v0
q u u q u q B
(2.4)where σv0 is the in situ total vertical stress, σ’v0 is the in situ effective vertical stress, u0 is the in
situ hydrostatic water pressure and Δu (= u2- u0) is the excess pore pressure.
As mentioned in Robertson (2009), the term Qt1 is used, instead of Qt, to make reference to a stress exponent for stress normalization equal to 1. Further details on stress normalization will be provided in the following paragraphs.
The normalization recommended above was based on theoretical work by Wroth (1984). Robertson (1990) proposed two SBT charts based on either Qt1- Fr (%) or Qt1- Bq (Figure 2.6), but suggested that the Qt1- Fr (%) chart is in general more reliable.
11 There have been other CPT-based classification charts proposed by other authors such as Ol-sen and Mitchell (1995), Eslami and Fellinius (1997) and Zhang and Tumay (1999). A descrip-tion of these charts will not be reported here.
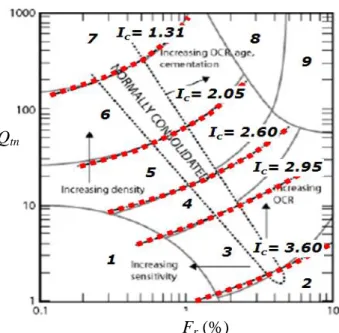
The boundaries between zones in the Qt1- Fr (%) chart are defined by the Soil Behaviour Type index Ic, where Ic is the radius of the essentially concentric circles. Robertson and Wride (1998) modified the definition of the soil behaviour type index, originally identified by Jefferies and Davies (1993), to apply to the Robertson (1990) chart. In this way, Ic was defined as follows:
2 2
0.5 22 . 1 log log 47 . 3 t r c Q F I (2.5)The contours of Ic on the Robertson (1990) Qt1- Fr chart are shown in Figure 2.7.
As Jefferies and Davies (1993) suggested, the SBT index Ic could also be used to define em-pirical correlations that vary with soil type. Hence, the SBT index Ic is widely recognized as a powerful concept.
Figure 2.6 : Normalized CPT Soil Behaviour Type (SBTn) chart Qt1-Bq (SBT zones based on Figure 2.5)
12 Figure 2.7: Contours of soil behaviour type index Ic on SBTn Qtn- Fr chart (SBT zones based on Figure 2.5)
(Robert-son, 2009)
Jefferies and Davies (1991) suggested a modified SBTn chart that included piezometric in-formation directly using Q(1-Bq). Jefferies and Been (2006) noted that it was better to use
Q(1-Bq)+1, which proved to be useful when dealing with soft sensitive soils where Bq > 1. However, the application of the updated chart (Figure 2.8) can be problematic in very soft soils due to loss of accuracy in qt. Furthermore, loss of saturation would also complicate the use of this chart. The material type index Ic, which defines the soil type zone boundaries in the chart, is expressed as:
2
2 log 22 . 1 1 1 log 47 . 3 Q B F Ic q (2.6)Robertson and Wride (1998) and the update by Zhang et al. (2002), proposed a normalized cone parameter using a variable stress exponent n that varies with SBTn:
n v a a v t tn q p p Q 0 / /' 0 (2.7)where
qt v0
/ pa is the dimensionless net cone resistance,
n v a
p /' 0 is the stress normaliza-tion factor and pa is the atmospheric pressure. Zhang et al. (2002) suggested that the stress expo-nent could be calculated using the soil behaviour type index Ic, and that index should be obtained using Qtn.
Although there have been several publications (Zhang et al., 2002; Idriss and Boulanger, 2004; Cetin and Isik, 2007) regarding the appropriate stress normalization, only that proposed by Robertson (2009) is briefly described herein. A detailed description can be found in Robertson (2009). He suggested the following approach that allows for variable stress exponent with Ic and effective overburden stress:
' /
0.15 05 . 0 381 . 0 0 Ic v pa n (2.8) where n ≤ 1. Fr (%) Qtn13 Figure 2.8: Soil type classification Q(1-Bq)+1 - Fr chart (Jefferies and Been, 2006)
For most fine-grained soils, the stress exponent will be equal to 1. On the other hand, when in situ vertical stresses are not high, the stress exponent will range from 0.5 to 0.9 for most coarse-grained soils, whereas at high in situ vertical effective stress (> 1 MPa), n tends toward 1 for most soils.
The Schneider et al. (2008) chart. Assessment of data in Q-Δu/σ’v0 space
Schneider et al. (2008) proposed a classification chart (Figure 2.9) in terms of Q-Δu/σ’v0 and stated that assessment of data in Q-Δu/σ’v0 space was superior to Q-Bq space. Their study fo-cused on separating the influence of overconsolidation ratio (OCR) from that of partial consoli-dation on normalized piezocone parameters, which both tend to increase the normalized cone re-sistance Q and decrease the pore pressure parameter Bq, leading to the potential overlap of soil types in Q-Bq classification charts and uncertainty in assessing whether penetration is drained, undrained or partially drained (Schneider et al., 2008).
For offshore projects in general, and onshore projects with soft fine-grained soils and ground water level close to the surface, the proposed chart can be very useful. Nevertheless, for onshore projects where the CPTu pore pressure could not be reliable due to loss of saturation of the cone sensor, the application of the chart can be problematic (Robertson 2012).
Ic = 2.76 Ic = 2.40 Ic = 1.80
14 Figure 2.9: Soil classification chart according to the approach proposed by Schneider et al. (2008)
2.3.2 Drained CPT penetration
During cone penetration at standard rate (v = 2 cm/s), fully drained conditions prevail for coarse-grained soils and most of the geotechnical parameters are based on drained behaviour.
2.3.2.1 Stiffness
The use of the seismic CPT (SCPT) allows direct measurement of shear-wave velocity Vs. The shear wave velocity is measured during pauses in the CPT using a downhole technique, leading to a continuous profile of Vs.
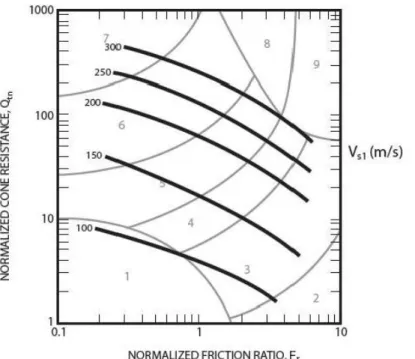
Although direct measurement of Vs is preferable to estimates, where they can not be ob-tained, relationships with cone penetration resistance and soil behaviour type index Ic can be use-ful. Based on SCPT profiles, Figure 2.10 shows a set of contours of normalized shear-wave ve-locity Vs1 developed by Robertson (2009) on the Qtn-Fr chart, for Holocene and Pleistocene age and mostly uncemented soils. The Vs1 is expressed as:
0.25 0 1 s a/ 'v s V pV (m/s) (2.9)
The contours of Vs1 in Figure 2.10 are related to Qtn (Robertson, 2009):
0.51 vs tn
s Q
V (2.10)
or Vs
vs
qt v
/pa
0.5 (2.11) where αvs is the shear-wave velocity cone factor that can be estimated using:0.55 1.68 10 Ic vs
(m/s)2 (2.12)15 Figure 2.10: Contours of normalized shear-wave velocity, Vs1 on normalized SBTn Qtn-Fr chart (Robertson, 2009)
The Vs is a direct measure of the small strain shear modulus G0 and is determined using the
equation:
2 0 Vs
G
(2.13)where ρ is the mass density of the soil.
Using the Vs1 contours and n = 0.5 (for most coarse-grained soils), Robertson (2009) defined a small strain shear modulus, G0, for young, uncemented soils:
0 68 . 1 55 . 0 0 / 10 t v I a q p G
c
(2.14)Where pa is the atmospheric pressure and ρ/pa is expressed in (s/m)2.
Being G0 the maximum shear modulus for small strains, it should be soften to an appropriate
strain level for design purposes. As Robertson (2009) stated, for some applications engineers re-quire the estimate of the Young’s modulus E’. The Young’s modulus is related to the shear modulus G by the following relationship:
GE'21 (2.15)
where the Poisson’s ratio (υ) ranges from 0.1 to 0.3 for most soils in drained conditions. There-fore, E’~ 2.5G for most coarse-grained soils.
Following Fahey and Carter (1993), a simple approach to estimate the amount of softening can be used:
g ult q q f G G/ 0 1 / (2.16)where f and g are constants that depend on soil type and stress history, q is the applied load, qult is the ultimate or failure load and q/qult is the degree of loading. Fahey and Carter (1993) and
16 Mayne (2005) recommended that f = 1 and g = 0.3 are appropriate values for uncemented soils that are not highly structurated. For low to moderate degrees of loading (0.2-0.3), the ratio G/ G0
ranges from 0.30 to 0.38. In this way, the Young’s modulus for application in simplified elastic solutions is approximately E’~ 0.8G0.
For low risk projects, Robertson (2009) suggested to estimate E’ for uncemented, predomi-nately silica-based soils of either Holocene or Pleistocene age (when Ic < 2.6) using the follow-ing equation:
0 68 . 1 55 . 0 10 / 8 . 0 ' pa I qt v E
c
(2.17) 2.3.2.2 In situ stateRobertson and Campanella (1983) showed that relative density is not a reliable parameter to evaluate the in situ state due to variations in compressibility for sands. Sands with high com-pressibility result in lower cone resistance for the same relative density compared with sands with low compressibility.
Research has shown that the state parameter ψ (Been and Jefferies, 1985), based on critical state conditions, is a relevant parameter suitable to describe the in situ state of sands. According to Been and Jefferies, the state parameter ψ is defined as the difference between the current void ratio (e) and the critical state void ratio (ec) at the same effective stress. As ψ links the effects of void ratio and effective stress in a unique way, it seems to be an appropriate index for describing soil behaviour compared to the relative density.
Been et al. (1986; 1987) first investigated the possibility of evaluating ψ using CPT/CPTu. They considered a number of calibration chamber test results primarily on clean sands, so as to develop a simple method for assessing the soil state.
Further research has shown that the inverse problem of evaluating the state from CPT meas-urements is complex and depends on several soil parameters. Jefferies and Been (2006) show how the inverse problem can be aided using numerical modelling. A detailed description of the evaluation of soil state using CPT is provided in Jefferies and Been (2006).
Based on a large amount of data, including field and chamber test as well as analyti-cal/numerical results, Robertson (2009) estimated contours of state parameter on the SBTn Qtn
-Fr chart for uncemented Holocene age soils.
Based on a large database of liquefaction case histories, Robertson and Wride (1998) sug-gested a correction factor Kc to correct the normalized cone resistance Qtn to an equivalent clean sand value (Qtn,cs).
17 ´
Figure 2.11: a) Contours of clean sand equivalent normalized cone resistance, Qtn,cs, based on Robertson and Wride (1998) liquefaction method (Robertson, 2009) and b) Contours of estimated state parameter ψ for uncemented
Holo-cene age-soils (Robertson, 2009)
The correction factor, which is a function of grain characteristics (combined influence of fines content, mineralogy and plasticity), is applied when Ic > 1.64. Robertson (2010b) observed a strong similarity between the contours of the clean equivalent cone resistance Qtn,cs (Figure 2.11a) and the contours of ψ (Figure 2.11b). Accordingly, the following simplified and approxi-mate relationship to estiapproxi-mate the state parameter for a wide range of sandy soils was proposed:
a)
18 cs tn Q , log 33 . 0 56 . 0
(2.18) 2.3.2.3 Shear strengthRobertson and Campanellla (1983) suggested a correlation to estimate the peak friction angle (ϕ’) for uncemented, unaged, moderately compressible, predominately quartz sands based on calibration chamber test results.
0.29 ' log 68 . 2 1 ' tan 0 v c q (2.19)
Kulhawy and Mayne (1990) suggested an alternate relationship for clean, rounded, unce-mented quartz sands, and assessed the relationship using field data:
1 log 11 6 . 17 ' qt (2.20)where qt1
qt /patm
/'v0 / patm
0.5.Jefferies and Been (2006) showed a strong link between ψ and ϕ’ for a wide range of sands. Accordingly, it is possible to link Qtn,cs with ϕ’using:
' 'cv48 (2.21)
where ϕ’cv is the constant volume or critical state friction angle depending on mineralogy (Bol-ton, 1986), usually about 33 degrees for quartz sands but can be as high as 40 degrees for feld-espathic sand. Hence, substituting Equation (2.18) into (2.21), the relationship between Qtn,cs and
ϕ’ becomes:
log
26.88 84 . 15 ' '
cv Qtn,cs
(2.22)The advantage of using Equation (2.22) is that it includes the importance of grain character-istics and mineralogy, that are reflected in ϕ’cv and soil type (Robertson, 2010b).
2.3.2.4 Brief introduction to soil liquefaction evaluation: The Robertson and Wride (1998) method
Most of the existing work on soil liquefaction has been related to cyclic softening, mainly cyclic liquefaction. Cyclic liquefaction requires undrained cyclic loading, such as earthquake loading. Deformations during cyclic loading will depend on the magnitude and duration of the cyclic loading, the density of the soil and the extent to which shear stress reversal develops. If extensive shear reversal occurs, the effective stress state can reach the point of essentially zero effective stress. When the condition of essentially zero effective stress is reached, large deforma-tions can result. However, when cyclic loading stops, the deformadeforma-tions generally stabilize (Robertson and Wride, 1998).
Cyclic liquefaction can take place in almost all saturated coarse-grained soils provided the magnitude and duration of the cyclic loading is sufficiently large. Fine-grained soils can also
un-19 dergo cyclic softening if the applied cyclic shear stress is close to the undrained shear strength. However, deformations in this case will be generally small due to the cohesive strength at low effective stress (see Robertson and Wride, 1998; Robertson and Cabal, 2012 for details).
Prof. Seed and his co-workers developed an exhaustive SPT-based approach to estimate the potential for cyclic liquefaction for level ground conditions due to earthquake loading. The ap-proach requires an estimation of the cyclic stress ratio (CSR) profile induced by a design earth-quake and the cyclic resistance ratio (CRR) of the ground. If CSR > CRR, cyclic liquefaction can occur.
Seed and Idriss (1971) developed a simplified method to estimate CSR based on the maxi-mum ground surface acceleration (amax) at the site. The expression for CSR is given by:
d v v v av r g a CSR 0 0 max 0 ' 65 . 0 ' (2.23) where τav is the average cyclic shear stress, g is the acceleration due to gravity, σv0 and σ’v0 are the total and effective vertical overburden stress, respectively and rd is a stress-reduction factor which is dependent of depth. The stress reduction coefficient rd was originally introduced by Seed and Idriss (1971). More recently, Idriss and Boulanger (2004) proposed the following rela-tion: M z z rd 142 . 5 28 . 11 sin 118 . 0 106 . 0 133 . 5 73 . 11 sin 126 . 1 012 . 1 exp (2.24)
where z is depth in metres and M is moment magnitude. As the uncertainty in rd increases with increasing depth, Equation (2.24) should only be applied for depths less than about 20 m.
The approach based on the SPT has many problems, mainly due to the inconsistent nature of the SPT (Robertson and Wride, 1998). On the other hand, due to the continuous, reliable and re-peatable nature of the CPT, several correlations have been proposed to estimate CRR (e.g. Robertson and Campanella, 1985; Stark and Olson, 1995; Idriss and Boulanger, 2003).
Based on discussions at the National Center for Earthquake Engineering Research (NCEER) workshop held in 1996, Robertson and Wride (1998) recommended the following CPT correla-tion for sand:
08 . 0 1000 93 3 1 5 . 7 qcN cs CRR if 50 ≤ (qc1N)cs < 160 (2.25)
05 . 0 1000 833 . 0 1 5 . 7 qc N cs CRR if (qc1N)cs < 50 (2.26)20 where (qc1N)cs is the normalized cone penetration resistance (qc1N) corrected to an equivalent clean sand value. The normalized cone resistance (qc1N) is obtained by a simple iterative stress normalization procedure that depends on the soil behaviour type index (see Robertson and Wride, 1998 for details). More recently, Robertson (2009) updated the stress normalization to al-low for a variation of the stress exponent with SBTn index Ic and effective overburden stress (see Section 2.3.1).
Figure 2.12 shows the recommended correlation (updated by Roberston, 2009). The field ob-servation data used to compile the curve plotted in the figure were based on the following: o Holocene age, clean sand deposits;
o Level or gently sloping ground; o Magnitude M = 7.5 earthquakes;
o Representative average CPT values for the layer examined; o Depth range from 1 to 15 m, 85% for depths < 10 m
Figure 2.12: CRR7.5 from CPT normalized clean sand equivalent cone resistance (updated by Robertson, 2009)
21 As Robertson and Wride (1998) remarked, attention should be paid when extrapolating CPT correlation to conditions outside the above. However, the correlation can be conservative when applied to all measured CPT values in variable deposits, where a small amount of data could show possible liquefaction.
Based on the approach suggested by Robertson and Fear (1995), Robertson and Wride (1998) proposed estimating an equivalent clean sand using a correction factor Kc in the following way:
qc1N
cs Kcqc1N (2.27)where the correction factor Kc is a function of the soil behaviour type index Ic. The methodology proposed by Robertson and Wride (1998) to estimate CRR7.5 from CPT is summarized in Figure
2.13.
As Robertson and Wride (1998) suggested in their work, when Ic > 2.6, samples should be obtained and evaluated using other criteria (e.g. Marcuson et al., 1990).
Finally, the factor of safety against cyclic liquefaction is given by:
MSF CSR CRR
FS 7.5
(2.28) where MSF is the Magnitude Scaling Factor to convert the CRR7.5 for M = 7.5 to the equivalent
CRR for the design earthquake. Idriss (1999) recommended the following expression for MSF: 058 . 0 4 exp 9 . 6 M MSF (2.29) MSF ≤ 1.8 (2.30)
At any depth, if CSR is greater than the estimated CRR (adjusted to the same magnitude), cyclic softening (liquefaction) is possible (Robertson and Wride, 1998).
22 Figure 2.13: Flow chart to evaluate cyclic resistance ratio (CRR7.5) from CPT (Roberson and Wride, 1998)
23
2.3.3 Undrained CPT penetration
It is generally accepted that at the standard penetration rate, undrained penetration occurs in fine-grained soils and most of the geotechnical parameters are based on undrained behaviour.
2.3.3.1 In situ state and undrained shear strength
The in situ state for fine-grained soils is usually defined in terms of OCR. The OCR is de-fined: 0 ' ' v p OCR (2.31)
where σ’p is the maximum past effective consolidation stress and σ’v0 the present effective over-burden stress. This definition is appropriate for mechanically overconsolidated soils where the removal of overburden stress has been the only change the soils have experienced. Nevertheless, for cemented or aged soils the OCR is the ratio of the yield stress σ’y and σ’v0.
Kulhawy and Mayne (1990) suggested the well-known method to estimate OCR and yield stress in fine-grained soils:
qt v
/ 'v0 kQt1 k OCR (2.32) or
0
'p k qt
v
(2.33)where k is the preconsolidation cone factor.
Kulhawy and Mayne (1990) showed that an average value of k = 0.33 can be assumed, with a range varying from 0.2 to 0.5. Higher values of k are recommended in aged, heavily overcon-solidated clays. The Kulhawy and Mayne approach is valid for Qt < 20.
Ladd and Foott (1974) empirically developed the following relationship, relating the peak undrained shear strength, su with OCR:
m
m OCR v u v u s OCR S OCR s /' 0 /' 0 1 (2.34) The peak undrained shear strength su is estimated using:
t v
kt u q N s 0 / (2.35) or
kt
tn kt v v t v u N Q N q s 1/ / ' ' / 0 0 0 (2.36)where Nkt is the cone factor that varies from 10 to 20, with an average of 14. For normally con-solidated fine-grained soil, the undrained shear strength ratio
su /'v0
OCR1 ranges from 0.2 to 0.3 (Jamiolkowski et al., 1985), with an average value of 0.22 in direct simple shear.24 According to this, using Nkt linked to soil sensitivity via Fr and assuming S = 0.25, ϕ’ ~ 26° and m = 0.8 for most sedimentary clays, silts and organic fine-grained soils, Robertson (2012) suggested:
1.25 1 25 . 1 log 75 . 1 625 . 2 Fr Qt OCR (2.37)Based on the assumption that the sleeve friction measures the remolded shear strength of the soil, su(r) fs (e.g., Lunne et al. 1997), the remolded undrained shear strength ratio is expressed as:
/100 ' / ' / 0 0 ) (r v s v r tn u f FQ s
(2.38)By combining Equations (2.36) and (2.38), assuming Nkt = 14, soil sensitivity can be esti-mated: r r u u t s s F S / ( ) 7.1 (2.39) In this way, Robertson (2009) represented the remolded shear strength ratio contours on the normalized SBTn chart (Figure 2.14). As sensitivity increases, the contours move toward region 1, identified as “ sensitive fine-grained soils”. However, as Robertson (2009) remarks, the con-tours of
su(r)/
'v0
should be interpreted as guide, as any lack of accuracy in fs measurements will influence the result.Figure 2.14: Contours of remolded undrained shear strength ratio
su(r)/
'v0
and trends in the OCR and soil sen-sitivity on SBTn chart (Robertson, 2009)25 As recommended by Robertson, for moderate to high risk projects, site-specific correlations should be developed based on consistent values of the undrained shear resistance and the OCR.
2.3.3.2 Constrained modulus
The one-dimensional constrained tangent modulus, M, (Lunne et al. 1997), is used to esti-mate settlements at the end of primary consolidation:
r c z v C e m M / 0) ln10 ' 1 ( 1 (2.40)
where mv is the equivalent oedometer coefficient of compressibility, e0 is the initial void ratio
and Cc/r is the compression index, either Cc or Cr, depending on σ’v0.
Existing correlations between M and cone resistance typically have the form:
t v0
M q
M (2.41)
where αM is the constrained modulus cone factor.
Mayne (2007a) showed that αM varied with soil type and net cone resistance with values from 1 to 10, with low values applying to soft clays. Robertson (2009) suggested that αM varies with Qtn and proposed the following simplified correlation:
When Ic > 2.2 (fine-grained soil) use:
tn M Q when Qtn ≤ 14 (2.42) 14 M when Qtn > 14 (2.43) When Ic < 2.2 (coarse-grained soil) use:
0.55 1.68
10 03 . 0 Ic M (2.44)Robertson (2009) remarked that estimates of M can be improved with further information such as plasticity index and natural water content, where αM can be lower in soils with high water content and in organic soils.
2.3.3.3 Coefficient of consolidation from monotonic dissipation tests
In a CPTu test performed in saturated clays and silts, large excess pore water pressures are generated during penetration of piezocone. Once penetration is stopped, these excess pressures will decay with time and finally reach equilibrium conditions which correspond to hydrostatic values (Mayne 2002).
How rapidly the pore pressures dissipate depends on the permeability (k) as well as the hori-zontal coefficient of consolidation (ch). In silty sands excess pore pressures may dissipate in a few minutes whereas fat plastic clays may dissipate in 2 o 3 days.
26 Figure 2.15: Modified time factors for u2 monotonic porewater dissipations (Mayne, 2002)
During cone penetration the primary direction of pore water flow is horizontal, resulting in the rate of dissipation being more controlled by the horizontal coefficient of consolidation, ch, than by the vertical coefficient of consolidation, cv.
Soft to firm clays and silts will generally show monotonic pore pressure decays (readings always decrease with time). In these cases, the strain path method (Teh and Houlsby, 1991) may be used to determine ch: 50 2 * t I r T ch r (2.45)
where T* is the modified time factor, r is the probe radius, Ir (= G/su) is the rigidity index and t is the measured time usually taken at 50% equalization. For the particular case of 50% of consoli-dation, T* = 0.245 for the type 2 of piezocone element (shoulder u2).
27
2.4 Partially drained conditions on cone penetration testing
Drained or undrained conditions are required depending on desired measurements of interest for design (i.e., drained or undrained soil properties). Interpreting geotechnical parameters of ‘in-termediate’soils such as clayey sands and silts, silts and silty clays with the cone penetration test is a difficult task since partially drained conditions are likely to exist at the standard penetration rate of 2 cm/s.
However, the fact that the penetration velocity affects the cone resistance qc for such
‘inter-mediate’ soils was not considered when standards were prepared for the CPT (Kim et al., 2008). Hence, correlations developed for sands (drained conditions at v = 2 cm/s) or for clays (undrained conditions at v = 2 cm/s) will not be suitable for soils in which partially drained con-ditions prevail at standard penetration rate. The uncertainty concerning the degree of drainage complicates the interpretation of geotechnical parameters.
It is well known that varying the penetration velocity drainage conditions of the advancing penetrometer can be modified. For soils investigated up to now, the tip resistance of an advanc-ing penetrometer generally increases as the rate of penetration has reduced sufficiently for partial consolidation to occur. At very high rates of penetration, where conditions are fully undrained, viscous effects dominate and cause the tip resistance to increase with velocity. Hence, there is a transition point from undrained to partially drained conditions where viscous and partial consoli-dation effects equalize, showing a minimum resistance (Chung et al., 2006).
The influence of penetration velocity v and soil drainage properties (horizontal coefficient of consolidation) on the consolidation conditions can be captured by a normalized velocity V de-fined by Finnie and Randolph (1994):
h
c d v
V (2.46)
where v is the penetration velocity, d is the penetrometer diameter and ch is the coefficient of consolidation. Finnie and Randolph (1994) suggested transition points of V < 0.01 for drained re-sponse and V > 30 for fully undrained rere-sponse.
The majority of research to date has been mainly carried out in laboratory using centrifuge tests and reconstituted specimens clays (e.g., House et al., 2001; Randolph and Hope, 2004; Chung et al., 2006; Lehane et al., 2009). Schneider et al. (2007) tested normally consolidated and overconsolidated specimens of clay and silty clay. Jaeger et al. (2010) presented the results of variable penetration rate CPT in an intermediate soil (75% sand, 25% kaolin) performed in centrifuge. Oliveira et al. (2011) performed centrifuge tests with variable penetration rates in silty tailings.
28 Figure 2.16 shows the results of Jaeger et al. (2010). They observed that Q monotonically decreased as normalized velocity, V, increased from 0.01 to 160. However, no viscous effects were observed in their sand-kaolin experimental data. The figure also includes the results pro-vided by Schneider et al. (2007).
The variation of Q with V clearly differs for the four soil types investigated. Whereas there is a clear difference in the variation of Q with V for the normally consolidated kaolin (NC kaolin) and the lightly overconsolidated silica flour-bentonite (LOC SFB), the overconsolidated kaolin (OCR kaolin) and the overconsolidated silica flour-bentonite (HOC SFB) exhibit similar trends. The normalized velocity at which Q is minimum is approximately 100 for the kaolin and the SFB soils tested.
By contrast, very few contributions are based on results from field scale tests and full size penetrometer. Kim et al. (2008) performed CPT at various penetration rates ranging from 20 to 0.01 mm/s in saturated clayey silt and silty clay soils. Tonni and Gottardi (2019) showed the re-sults of two piezocone tests carried out at non-standard penetration rates (15 mm/s and 40 mm/s) performed in Venetian silty soils (Figure 2.17). Schnaid et al. (2010) presented piezocone results in gold and bauxite tailings carried out at penetration rates corresponding to 1 mm/s, 2 mm/s and 20 mm/s. Suzuki et al. (2012) presented the results of piezocone test performed in silty soils at rates that varied by five order of magnitude from 0.002 mm/s to 20 mm/s. Poulsen et al. (2013) carried out CPTs at 0.5, 1, 5, 20 and 60 mm/s in silty soils.
Figure 2.16: Effect of normalized penetration velocity on normalized penetration resistance in five materials: inter-mediate soils (75% sand, 25% kaolin mixture) data from Jaeger et al. (2010) and lightly and heavily overconsoli-dated silica flour-bentonite (SFB), and normally consolioverconsoli-dated and overconsolioverconsoli-dated kaolin data from Schneider et al.
29 Figure 2.17: Comparison between a) cone resistance and b) pore water pressure of adjacent in situ CPTU tests
per-formed at different penetration rates (Tonni and Gottardi, 2009)
Figure 2.18 shows the results from Kim et al. (2008) obtained conducting CPTUs with dif-ferent penetration rates in two layers. The figure evidences how the cone resistance depends on the penetration rate. For the silty clay layer, the transition from undrained to partially drained oc-curs at a penetration rate of 0.2 mm/s, whilst it ococ-curs at 1 mm/s for the clayey silt. This high-lights the fact that the change in drainage condition is dependent on soil type (Poulsen et al., 2011).
30
Backbone curve equation
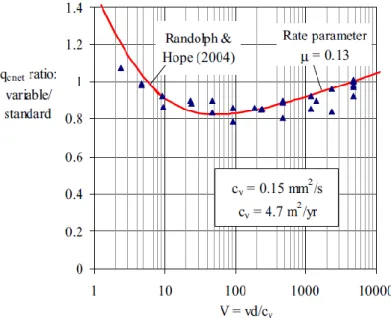
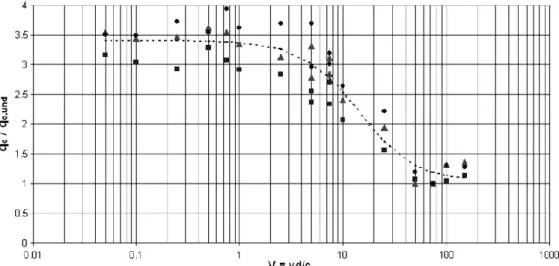
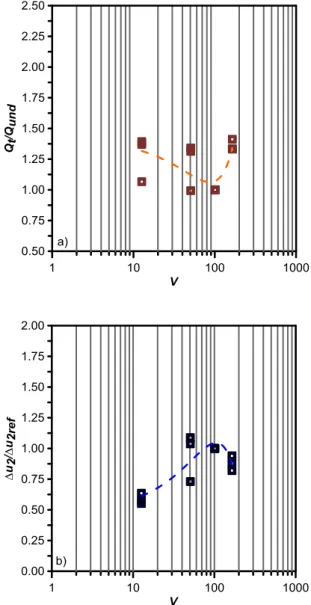
Randolph and Hope (2004), among others, based on studies performed in centrifuge using kaolin, presented backbone curves relating the variation of the normalized penetration resistance or excess pore pressure with the normalized penetration rate. Figure 2.19 shows the backbone curve reported by Randolph and Hope (2004), where the net cone resistance qcnet is normalized by a reference value (undrained value qcnet,ref). The normalized net cone resistance shows a grad-ual transition for V < 30. The backbone curves are of the form:
o ref o d ref V V V V cV b a q q / sinh / sinh 10 ln 1 1 1 1 (2.47) where qref is the minimum undrained tip resistance measured as proposed by House et al. (2001),Vref is the undrained normalized velocity, Vo is the normalized velocity at which viscous effects
start to decay, μ is the rate parameter and a, b, c and d are parameters.
As Randolph (2004) remarked, the resulting curve fits may be used either to evaluate whether a given penetration test is partially drained or not, or to obtain a value for the consolida-tion coefficient of a particular soil by matching the transiconsolida-tion point to an appropriate backbone curve.
House et al. (2001) suggested that the transition point for partially drained conditions may be evaluated varying the penetration velocity over a depth range. This procedure is referred as
twitch test. At a given depth the penetration rate was successively halved, from an initial value
down to a low value, and the penetrometer advanced by 1 or 2 diameters of the probe in each step. Following this approach, Randolph (2004) conducted a twitch cone test in a soft clay in Western Australia (Figure 2.20). The penetration rate was halved after each ~2 cone diameters, from an initial rate of 20 mm/s down to 0.02 mm/s before going back to the standard rate.
31 Figure 2.20: Standard and twitch tests in soft clay (Randolph, 2004)
As can be seen in Figure 2.20, initially, as the penetration rate reduces, the cone resistance decreases due to reduced viscous effects. Below 6.9 m the cone resistance starts to increase again towards the profile for the standard test.
Figure 2.21 shows the results of cone twitch test fitted using Equation (2.47), with the pa-rameters a, b, c and d based on those proposed by Randolph and Hope (2004). The horizontal position of the data (V) were adjusted by varying the coefficient of consolidation (cv) in order to give the best fit to the backbone curve (see Randolph, 2004 for details).
32 Oliveira et al. (2011) presented in their work a set of centrifuge tests with variable penetra-tion rates performed with a soil classified as silty tailings and an analytical approach to the back-bone curve equation:
1 4 , 1 1 1 b c v und c c c n d v b q q (2.48)
where qc is the cone penetration resistance, qc,und is the minimum undrained tip resistance and b, c and n are parameters. No increase in resistance due to viscous effects is considered. Figure 2.22
shows the best fit of data based on Equation (2.48).
DeJong and Randolph (2012) analyzed the effect of partial consolidation on normalized cone resistance and normalized excess pore pressure as a function of V in numerical and experimental data for contractive soils. The fitted curves through the data in Figure 2.23a and 2.23b are of the form, respectively:
c ref V V u u 50 2 2 / 1 1 1 (2.49)
drained ref c ref V V Q Q Q Q 50 / 1 1 / 1 (2.50)where Δu2ref is the initial excess pore pressure for undrained penetration, Qref is the Q value dur-ing undrained penetration, Qdrained is the Q value under fully drained conditions, V50 is the
nor-malized velocity corresponding to the penetration velocity at which 50% of the excess pore pres-sure for undrained penetration is mobilized and c is the maximum rate of change of the function with V. The dashed lines in Figure 2.23 are approximate bounds of other published data (Kim et
al., 2008; Jaeger et al., 2010; Schnaid et al., 2010).
33 Figure 2.23: a) Normalized velocity V versus normalized Δu2 ; b) normalized velocity V versus normalized Q
35
CHAPTER 3: VARIABLE RATE CPTU IN SILTY SAND
DEPOSITS
3.1 Introduction
Over the last decades cone penetration testing, with or without pore pressure measurements (CPTU/CPT), has become the most widely used in-situ testing technique for stratigraphic profil-ing and site characterization. The amount of knowledge so far gained on the interpretation of CPT/CPTU in sands and clays, in terms of fundamental mechanics of cone penetration, soil clas-sification charts and both theoretical and empirical correlations for the estimate of soil parame-ters, is undoubtedly wide.
However, a problem may arise when the existing interpretation approaches, developed for “standard” clays and sands, are evaluated for analysing cone penetration measurements in silts or other complex soil mixtures, such as sandy silts, silty or clayey sands. Indeed, these intermediate geomaterials are often characterized by permeability values within the range in which partial drainage is very likely to occur at the standard penetration rate of 20 mm/s, hence the application of the available and widely-known interpretation procedures, based on a stiff distinction between drained and undrained conditions, may result in invalid estimates of soil parameters.
In recent years, the issue of partial consolidation during cone penetration has been discussed in a number of contributions (e.g. Schnaid et al., 2004; Randolph, 2004; Schneider et al., 2007), all showing the importance of a preliminary assessment of drainage conditions in order to prop-erly interpret the in situ soil response.