MICROBIAL BIOTECHNOLOGIES FOR
PRODUCTION OF BIOCHEMICALS
INTERMEDIATES, BIOENERGY AND
BIOMATERIALS
Thesis Committe
Thesis supervisor
Prof. ssa Olimpia Pepe
Professor at the Dept. of Agricultural Sciences,
Division of Microbiology
University of Naples Federico II, Naples, Italy
Thesis co- supervisors
Dr.ssa Valeria Ventorino
Researcher at the Dept. of Agricultural Sciences,
Division of Microbiology
University of Naples Federico II, Naples, Italy
Dr. Ing. Antonio Panico
Researcher in Environmental Engineering
Telematic University Pegaso, Naples, Italy
PhD program coordinator
Prof. Guido D’Urso
Professor at the Dept. of Agricultural Sciences, Portici-
University of Naples Federico II, Naples, Italy
MICROBIAL BIOTECHNOLOGIES FOR
PRODUCTION OF BIOCHEMICALS
INTERMEDIATES, BIOENERGY AND
BIOMATERIALS
Giorgia Pagliano
Thesis
submitted in fulfilment of the requirements for the degree of doctor
in Agricultural and Agro alimentary Sciences
4
TABLE OF CONTENTS
Table of contents 4 List of tables 9 List of figures 12 List of abbreviations 17CHAPTER 1
Brief thesis presentation
Short overview of the thesis 19
Aims and thesis outline 19
CHAPTER 2
Literature Review
Integrated systems for biopolymers and bioenergy production from organic waste and by-products: a review of microbial processes
2.1 Introduction 22
2.2 Bio-based and biodegradable polymers: PHAs production and classification 23
2.3 Suitable substrates and bacterial strains for PHA production 26
2.3.1 Starch-based material as a source of PHAs 27
2.3.2 Molasses and sucrose as sources for PHAs 30
2.3.3 Lignocellulosic material as a source for PHAs 32
2.3.4 Whey-based culture media as a source for PHAs 36
2.3.5 Fatty acid and glycerol culture media as source for PHAs 40
2.3.6 Solid agro-industrial by-products and waste as a source for PHAs 42
2.4. Integrated systems to simultaneous produce intracellular (PHAs) and
extracellular by-products (biosurfactants) 46
2.5 Bioenergy production from industrial and agricultural waste 50
2.5.1 Anaerobic digestion and biogas production 50
5
2.6. Integrated systems for bioenergy production from industrial and agricultural wastes 60
Simultaneous production of PHAs and bioenergy from organic wastes 60
2.7 Conclusions 65
CHAPTER 3
Anaerobic digestion of dairy waste:
preliminary results
Biogas production from anaerobic digestion of dairy waste
3.1. Introduction 67
3.2. Materials and Methods 68
3.2.1. Batch experiments 68
3.2.2. Analytical methods 69
3.2.2.1 Characterization of waste mixture and inoculum 69
3.2.2.2 Bacterial enumerations 69
3.2.2.3 PCR-DGGE analysis 69
3.3. Results and Discussion 70
3.3.1. Biogas production in batch experiments 70
3.3.2. Microbial analyses 72
3.3.2.1. Enumeration of principal microbial groups 72
3.3.2.2. Molecular analysis 76
3.4. Conclusions 78
CHAPTER 4 Bioenergy production from dairy waste
The effect of bacterial and archaeal populations on anaerobic process fed with mozzarella cheese whey and buttermilk
4.1 Introduction 81
4.2 Materials and methods 82
4.2.1 Physico-chemical analysis of dairy wastes 82
4.2.2 Microbiological analysis of dairy wastes 84
4.2.3 Anaerobic tests set up and monitoring 84
4.2.3.1 Biological gas production and intermediate products evolution 85
4.2.3.2 Monitoring of microbial growth and bacterial community structure by
culture-dependent method 86
4.2.3.3 PCR amplification and DGGE analysis of bacterial 16S rRNA fragments 86
6
4.2.4 Archaeal DGGE bands sequencing 87
4.2.5 Statistical analyses 88
4.3 Results 88
4.3.1 Characterization of the dairy waste, their mixture and inoculum 88
4.3.2 Biological gas production and physico-chemical biosystem changes 90
4.3.3 Microbial counts during the biodigestion process 92
4.3.4 Bacterial and archaeal community structure 94
4.4. Discussion 98
4.4.1 Characterization of the dairy wastes and inoculum 98
4.4.2 Biological gas production,intermediates and end-products 101
4.4.3 Effects of microbial community changes on the physico-chemical
characteristics of the biological system and viceversa 102
4.5 Practical application and future perspectives 103
4.6 Conclusions 104
CHAPTER 5
Bacterial and archaeal
communities dynamics
Anaerobic process for bioenergy recovery from dairy waste: meta-analysis and enumeration of microbial community related to intermediates production
5.1 Introduction 106
5.2 Materials and Methods 107
5.2.1 Dairy wastes characterization and experimental set up 107
5.2.2 Anaerobic biosystem monitoring 108
5.2.2.1 Biological gas production and intermediate products evaluation 108
5.2.2.2 Monitoring of microbial growth by cultural dependent analysis 108
5.2.3 Microbiota analysis by high-throughput sequencing of the 16S rRNA gene 109
5.2.4 Bioinformatics and data analysis 109
5.2.4.1 Data Accessibility 110
5.3 Results 110
5.3.1 Characterization of dairy wastes 110
5.3.2 Biological gas production and biosystem monitoring 112
5.3.3 Microbial analysis by culture-dependent method 115
7
5.3.4.1 Bacteria 116
5.3.4.2 Archaea 120
5.4 Discussion 123
5.5 Conclusions 127
CHAPTER 6
Pure culture for PHAs production
Screening for polyhydroxyalkanoates (PHAs)-producing bacterial strains using organic acids as carbon source
6.1 Introduction 129
6.2 Materials and Methods 130
6.2.1 PHAs producing bacterial strains 130
6.2.2 Preliminary selection by bacterial growth in medium containing synthetic acids 130 6.2.3 Bacterial selection by PHA accumulation in batch culture with synthetic and natural
VFA 130
6.2.4 PHAs extraction and quantification 132
6.3 Results and discussion 132
6.3.1 Bacterial capacity to grow using VFA mixture 132
6.3.2 Bacterial capacity to grow using VFAextracted 133
6.3.3 Evaluation of PHA production from VFA 134
6.3.4 Evaluation of PHA production from VFAextracted 141
6.4 Conclusion 144
CHAPTER 7
Mixed microbial culture for PHAs
production
Polyhydroxyalkanoates (PHAs) production under different salinity concentration by mixed microbial culture
7.1 Introduction 146
7.2 Materials and Methods 146
7.2.1 MMC enrichment for PHA-accumulating microorganisms 146
8
7.2.3 Biopolymer recovery 148
7.2.4 Analytical procedures 149
7.3 Results and discussion 149
7.4 Conclusions 158
CHAPTER 8
General discussion
Bioenergy and polyhydroxyalkanoates (PHAs) production 159
References
164
Scientific curriculum
196
9
LIST OF TABLES
Table 2.3.1 Overview of studies reporting PHAs production from starch-based materials. Table 2.3.2. Overview of studies reporting PHAs production from molasses and sucrose. Table 2.3.3. Overview of studies reporting PHAs production from lignocellulosic materials. Table 2.3.4. Overview of studies reporting PHAs production from whey-based culture media. Table 2.3.5. Overview of studies reporting PHAs production from oil, fatty acid and glycerol
culture media.
Table 2.3.6. Overview of studies reporting PHAs production from solid agro-industrial
by-products.
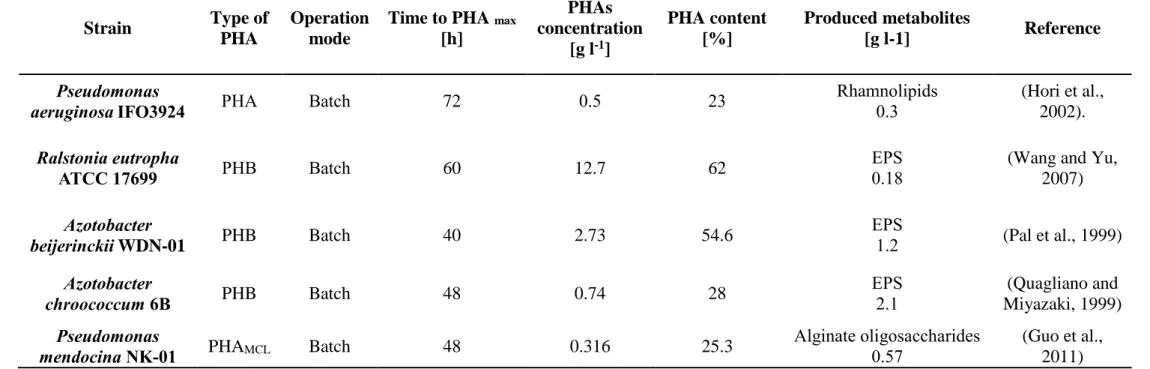
Table 2.4. Overview of studies reporting PHAs production coupled to metabolites used in
industry.
Table 2.5.1. Methane yields of solid organic substrates (adapted from Raposo et al. (2012)). Table 2.5.2. Hydrogen yields of different substrates (adapted from Li and Fang [114];
Davila-Vazquez et al. (2008)).
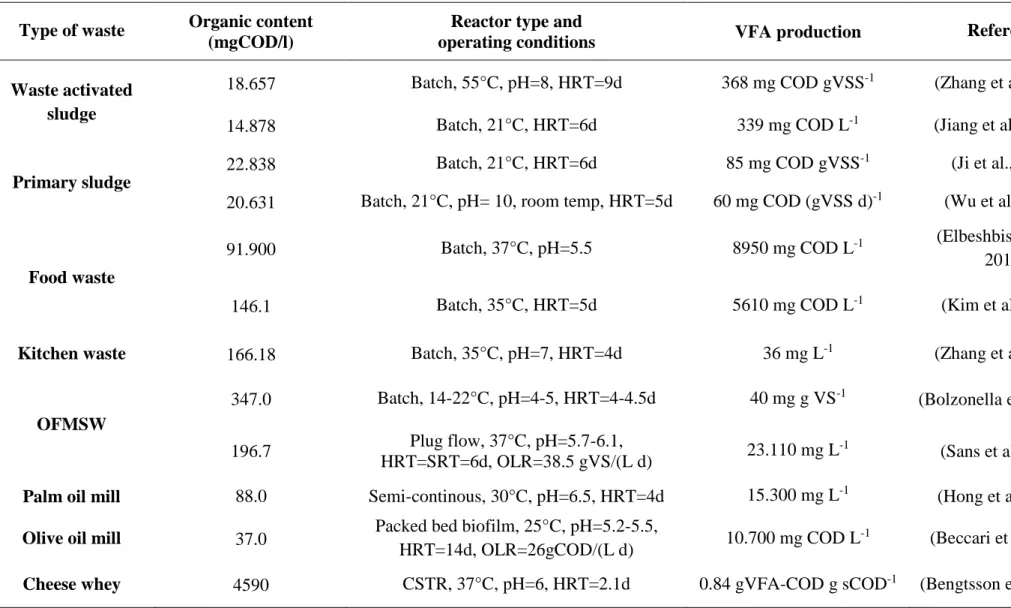
Table 2.6. Waste, reactor configuration and operation for the production of VFAs (adapted
from Lee et al. (2014)).
Table 3.3.1. Biogas production during biodigestion of WBM (cheese whey and buttermilk
mixture at ratio 1/1 v/v prepared immediately after sampling) with 5% of inoculum under natural acid condition (pH 4.8) at 30°C.
Table 3.3.2. Biogas production during biodigestion of WBM (cheese whey and buttermilk
mixture at ratio 1/1 v/v prepared immediately after sampling) with 5% of inoculum under sub-acid condition (pH 6) at 30 °C.
Table 3.3.3. Biogas production during biodigestion of WBM14 (cheese whey and buttermilk
mixture at ratio 1/1 v/v after pre- incubation period) with 5% of inoculum under acid condition (pH 4) at 30 °C.
Table 3.3.4. Biogas production during biodigestion of WBM14 (cheese whey and buttermilk
mixture at ratio 1/1 v/v after pre- incubation period) with 5% of inoculum under sub-acid condition (pH 6) at 30 °C.
Table 3.3.2.1. Enumerations of bacterial groups of WBM and WBM14 before starting the
10
Table 3.3.2.2. Microbial analyses at the end of the experiments fed with WBM and WBM14
and inoculated at 5%w/v under acid and sub acid conditions. Data of no-inoculated digesters were reported as control. Data are means ± SD of duplicate counts: 0.04 ≤ SD ≤ 0.20.<0.5 = under the detection limit (<3 log CFU g-1).
Table 4.1. The main biochemical reactions involved in anaerobic processes with the relative value of standard Gibbs free energy (ΔG°).
Table 4.2. Tests set-up and operating conditions.
Table 4.3. Physico-chemical characterists of whey cheese, buttermilk, their mixture and
inoculum.
Table 4.4. Biological gas composition.
Table 4.5. Identification based on Blast comparison in the GenBank data libraries of the
archaeal bands obtained by PCR-DGGE. The gray color indicates the presence of the bands in different samples.
Table 4.6. Yields of combined production of H2 and CH4 from different substrates and under
different operating conditions (adapted from Roy et al., 2016).
Table 5.1. Physico-chemical characterization of cheese whey, buttermilk, their mixture and the
animal manure inoculum.
Table 5.2. Cultural monitoring of bacterial populations during incubation for 30 days at
30°C. The values represent the means ± SD of three replicates. Different letters after the values indicate significant differences (p < 0.05).
Table 5.3. Observed diversity and estimated sample coverage for bacterial and archaeal 16S
rRNA amplification from DNA extracted from biodigesters during the anaerobic process. The entire data set was rarefied to 77670 reads or 47510 reads per sample, for bacteria and archaea respectively, before alpha-diversity was calculated.
Table 6.2.3. Composition (g L-1) of natural organic acids mixture extracted from digestate
obtained after 30 days of anaerobic digestion of cheese whey (VFAextracted).
Table 6.3.3 Growth in terms of optical density OD (600nm), microbial count Log (CFU mL-1) and percentage of PHB accumulated by selected microbial strains Cupriavidus necator DSM 13513, Pseudomonas resinovorans SA38 and SA39 at different time (0, 3, 6, 9, 24, 30 and 48 h) in the batch experiments conducted on the optimal medium and with VFA. Data are means ± SD of duplicate measurement: 0.01≤ SD ≤ 0.05.
Table 7.3.1 PHA percentage and concentration at the end of each feeding pulse of the
11
concentration of 0 g NaCl L-1, 10 g NaCl L-1 and 20 g NaCl L-1. The composition of the obtained polymer is also reported as HB:HV ratio (% w w-1).
Table 7.3.2 PHA percentage and concentration at the end of each feeding pulse of the
accumulation tests with MMCs acclimatized at salinity of 10 g NaCl L-1, under salinity concentration of 0g NaCl L-1, 10 g NaCl L-1and 20 g NaCl L-1. The composition of the obtained
polymer is also reported as HB:HV ratio (% w w-1).
Table 7.3.3 Organic acids concentration in the fermented cheese whey used as feeding
substrate. The organic acids are divided in HB and HV precursors respectively in order to calculate an expected polymer composition based on the feed.
12
LIST OF FIGURES
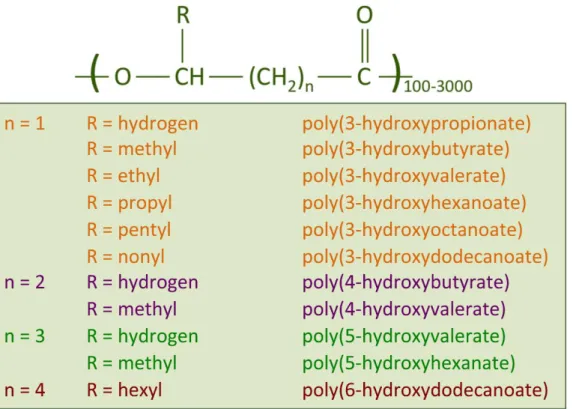
Figure 2.2 General structure of polyhydroxyalkanoates (PHAs). The most studied PHA type
is the homopolymer P(3HB), for which n is equal to 1 and R is a methyl group (Castilho et al., 2009).
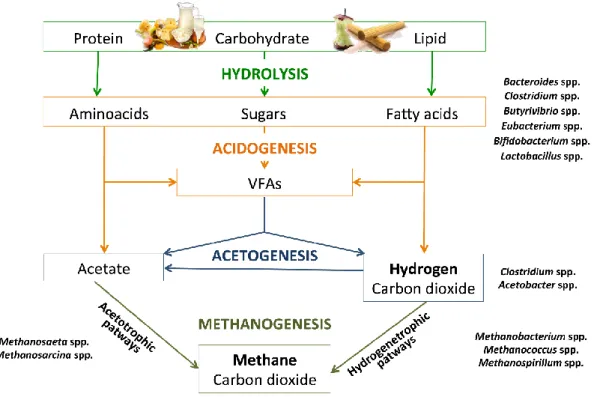
Figure 2.5.1 Phases of biological production of methane with the occurrence of VFAs, acetate,
hydrogen and carbon dioxide. Anaerobic bacteria involved are positioned according to their probable role in the process.
Figure 2.6.1 Cycle of polyhydroxyalkanoates (PHAs) production system (adapted from
Serafim et al. 2008).
Figure 2.6.2 Sustainable PHAs and bioenergy production from organic wastes and by-products
converted by different bacterial species: an overview of the principal process considered in this review.
Figure 3.3.2.2. DGGE profiles of bacterial populations for cheese whey, buttermilk, inoculum
and samples from the bioreactor inoculated at 5% v/v. Lanes: 1, fresh cheese whey (T0); 2,
fresh buttermilk (T0); 3, WBM before anaerobic digestion under acidic condition; 4, WBM
after anaerobic digestion under acidic condition; 5, WBM before anaerobic digestion under sub-acidic condition; 6, WBM after anaerobic digestion under sub-acidic condition; 7, inoculum; 8, pre-incubated cheese whey (T14); 9, pre-incubated buttermilk (T14); 10, WBM14
before anaerobic digestion under acidic condition; 11, WBM14 after anaerobic digestion under
acidic condition; 12, WBM14 before anaerobic digestion under sub-acidic condition; 13,
WBM14 after anaerobic digestion under sub-acidic condition.
Figure 3.3.2.3. Dendrogram showing the degree of similarity (%) of PCR-DGGE profiles of
the starting matrices (whey and buttermilk), manure inoculum and sludge sampled from the bioreactor inoculated with 5% with animal manure. Sample: W_T0, whey processed
immediately after sampling (T0); BM_T0, buttermilk processed immediately after sampling
(T0); BT0_acid_B, WBM before anaerobic digestion under acidic condition; BT0_subacid_B,
WBM before anaerobic digestion under sub-acidic condition; W_T14, whey processed after
pre-incubation period (T14); BT14_acid_B, WBM14 before anaerobic digestion under acidic
condition; BT14_subacid_B, WBM14 before anaerobic digestion under sub-acidic condition;
BM_T14, buttermilk processed after pre-incubation period (T14); BT0_acid_A, WBM after
anaerobic digestion under acidic condition; BT0_subacid_A, WBM after anaerobic digestion
under sub-acidic condition; BT14_acid_A, WBM14 after anaerobic digestion under acidic
13
inoculum.
Figure 4.1. Initial microbial characterization of the cheese whey, buttermilk and mixture (ratio
2:1).
Figure 4.2. H2 (white symbols) and CH4 (black symbols) produced during incubation time
from test A (triangle) and test B (square).
Figure 4.3. Concentrations of lactose, galactose, lactic acid, acetic acid, ethanol and propionic
acid in samples collected from test A (A) and test B (B).
Figure 4.4. Counts of the principal microbial groups in test A (A) and test B (B) and counts of
methanogen and LAB (C) in both tests during incubation time.
Figure 4.5. Molecular analysis by the culture-independent method (PCR-DGGE) – bacterial
community structure. The DGGE band patterns (A) and the cluster analysis (B) were representative of the samples collected from test A and test B at different days of the incubation time. Lanes: 1, animal manure inoculum (I); 2, test A at initial time (T0 A); 3, test A at day 7 (T7 A); 4, test A at day 14 (T14 A); 5, test A at day 21 (T21 A); 6, test A at day 28 (T28 A); 7, test B at initial time (T0 B); 8, test B at day 7 (T7 B); 9, test B at day 14 (T14 B); 10, test B at day 21 (T21 B); 11, test B at day 28 (T28 B).
Figure 4.6. Molecular analysis by the culture-independent method (PCR-DGGE) – archaeal
community structure. The DGGE band patterns (A) and the cluster analysis (B) were representative of samples collected from test A and test B at different days of the incubation time. Lanes: 1, Marker: a: Methanococcus voltae; b: Methanobrevibacter ruminantium; c: Methanobacterium congolense; d: Methanosarcina acetivorans; e: Methanosarcina barkeri; f: Methanosarcina mazei; 2, animal manure inoculum (I); 3, test A at initial time (T0 A); 4, test A at day 7 (T7 A); 5, test A at day 14 (T14 A); 6, test A at day 21 (T21 A); 7, test A at day 28 (T28 A); 8, test B at initial time (T0 B); 9, test B at day 7 (T7 B); 10, test B at day 14 (T14 B); 11, test B at day 21 (T21 B); 12, test B at day 28 (T28 B).
Figure 5.1. Viable counts of main bacterial groups evaluated in samples of cheese whey,
buttermilk and their mixture. The error bars represent the means ± SD of two replicates.
Figure 5.2. Cumulative specific production of H2 and CH4 monitored during 30 days of
incubation. X-axis displays the day, and the Y-axis is the corresponding cumulative H2 or CH4
specific production per gram of the initial concentration of VS of the dairy waste mixture. The error bars represent the means ± SD of two replicates.
14
Figure 5.3. pH and concentration of lactose, lactic acid and ethanol (a), and concentration of
acetic acid and propionic acid (b) in liquid samples collected from biodigesters at different times of incubation.
Figure 5.4. Abundance of bacterial families during the anaerobic process. Only OTUs with an
incidence > 1% in at least one sample are shown. Abbreviations: Mix_T0, mixture of cheese whey and buttermilk at day 0 of incubation; MixI_T0, mixture of cheese whey and buttermilk inoculated at day 0 of incubation; B1_T7, sample collected from B1 after 7 days of incubation; B2_T7, sample collected from B2 after 7 days of incubation; B1_T14, sample collected from B1 after 14 days of incubation; B2_T14, sample collected from B2 after 14 days of incubation; B1_T30, sample collected from B1 after 30 days of incubation; B2_T30, sample collected from B2 after 30 days of incubation.
Figure 5.5. Neighbor-joining tree for the representative Clostridiaceae and Tissierellaceae
OTUs (representatives with relative abundance > 0.1%). OTUs from this study were shown in bold reporting in brackets the total relative abundance. The sequence accession numbers of reference sequences from NCBI used for the phylogenetic analysis are shown in parentheses following the species name. Bootstrap values (> 50%, expressed as percentages of 1,000 replications) are given at the nodes. The scale bar estimates the number of substitutions per site.
Figure 5.6. Principal Coordinates Analysis of weighted UniFrac distances for bacterial (panel
a) and archaeal (panel b) 16S rRNA gene sequence data of samples during the incubation process. Colour label. red: mixture of cheese whey and buttermilk at day 0 of incubation; green: samples collected after 7 days of incubation; blue: samples collected after 14 days of incubation; orange: samples collected after 30 days of incubation.
Figure 5.7. Abundance of archaeal genera during the anaerobic process. Only OTUs with
an incidence > 1% in at least one sample are shown. Abbreviations: Mix_T0, mixture of cheese whey and buttermilk at day 0 of incubation; MixI_T0, mixture of cheese whey and buttermilk inoculated at day 0 of incubation; B1_T7, sample collected from B1 after 7 days of incubation; B2_T7, sample collected from B2 after 7 days of incubation; B1_T14, sample collected from B1 after 14 days of incubation; B2_T14, sample collected from B2 after 14 days of incubation; B1_T30, sample collected from B1 after 30 days of incubation; B2_T30, sample collected from B2 after 30 days of incubation.
Figure 5.8. Neighbor-joining tree for the representative Methanoculleus OTUs
(representatives with relative abundance > 0.1%). OTUs from this study were shown in bold reporting in brackets the total relative abundance. The sequence accession numbers of reference sequences from NCBI used for the phylogenetic analysis are shown in parentheses following
15
the species name. Bootstrap values (> 50%, expressed as percentages of 1,000 replications) are given at the nodes. The scale bar estimates the number of substitutions per site.
Figure 6.3.1 Microbial growth of different strains of C. necator (a,b) Pseudomonas spp. (c,d)
and Azotobacter spp. (e,f) on specific optimal medium without (a,c,e) and with (b,d,f) the synthetic acids addition.
Figure 6.3.2 Microbial growth of different of C. necator 13513, 531 and 428 on the optimal
medium (LB) with the addition of VFAextracted.
Figure 6.3.3 Microbial growth of different strains of P. oleovorans DSM 21016, P. fluorescens
DSM 50415, P. resinovorans SS233, SA38 and SA39 on the optimal medium (TSB) with the addition of VFAextracted.
Figure 6.3.4 C. necator DSM 13513 growth in the batch tests with LB as optimal medium (a)
and with the VFA (b) addition in terms of microbial count (log CFU mL-1) and PHB production (%) during 48 h of incubation at 30 °C.
Figure 6.3.5 Observations with fluorescence microscope (Nikon Eclipse E400) of C. necator
DSM 13513 growth after 9 (a), 24 (b), 30 (c) and 48 h (d) in the batch tests with the synthetic VFA addition.
Figure 6.3.6 P. resinovorans SA38 growth in the batch tests with TSB as optimal medium (a)
and with the VFA (b) addition in terms of microbial count (log CFU mL-1) and PHB production (%) during 48 h of incubation at 28 °C.
Figure 6.3.7 Observations with fluorescence microscope (Nikon Eclipse E400) of P.
resinovorans SA38 growth after 9 (a), 24 (b), 30 (c) and 48 h (d) in the batch tests with the synthetic VFA addition.
Figure 6.3.8 P. resinovorans SA39 growth in the batch tests with TSB as optimal medium (a)
and with the VFA (b) addition in terms of microbial count (log CFU mL-1) and PHB production (%) during 48 h of incubation at 28 °C.
Figure 6.3.9 Observations with fluorescence microscope of P. resinovorans SA39 growth after
9 (a), 24 (b), 30 (c) and 48 h (d) in the batch tests with the synthetic VFA addition.
Figure 6.3.10 C. necator DSM13513 growth in the batch tests with TSB and with the
VFAextracted addition in terms of microbial count (log CFU mL-1) and PHB production (%)
during 48 h of incubation at 30 °C.
Figure 6.3.11 Observations under optical and fluorescence microscope (Axiovert 200M, Zeiss)
of C.necator DSM 13513 growth after 9 (a, e), 24 (b, f), 30 (c, g) and 48 h (d, h) in the batch tests with the VFAextracted addition.
16
Figure 6.3.12 P. resinovorans SA39 growth in the batch tests with TSB and with the
VFAextracted addition in terms of microbial count (log CFU mL-1) and PHB production (%)
during 48 h of incubation at 28 °C.
Figure 6.3.13 Observations under optical and fluorescence microscope (Axiovert 200M, Zeiss)
of P. resinovorans SA39 growth after 9 (a, e), 24 (b, f), 30 (c, g) and 48 h (d, h) in the batch tests with the VFAextracted addition.
Figure 7.3.1 Trend of DO concentration (mg L-1) from the tests with MMCs acclimatized at
salinity of 20 g NaCl L-1, under salinity concentration of 0g NaCl L-1 (a), 10 g NaCl L-1 (b) and
20 g NaCl L-1 (c). The black dashed lines indicate the time of fermented cheese whey addition in pulses.
Figure 7.3.2 Trend of DO concentration (mg L-1) from tests with MMCs acclimatized at salinity of 10 g g NaCl L-1, under salinity concentration of 0g g NaCl L-1 (a), 10 g g NaCl L-1 (b) and 20 g NaCl L-1 (c). The black dashed lines indicate the time of fermented cheese whey addition in pulses.
Figure 7.3.3 Observations under optical (a,b,c) and fluorescence microscope (d,e,f) before
each feeding pulse (I; a, d; II; b, e; III; c, f) in the experiment with MMCs adapted at 20 g NaCl L-1 under salinity condition of 10 g NaCl L-1.
Figure 7.3.4 Observations under optical (a,b,c) and fluorescence microscope (d,e,f) before
each feeding pulse (I; a, d; II; b, e; III; c, f) in the experiment with MMCs adapted at 10 g NaCl L-1 under salinity condition of 10 g NaCl L-1.
Figure 7.3.5 Biopolymers recovered from the pellet obtained at the end of the accumulation
tests. a) d) and b) are examples of the bioplastic disk obtained; c) Bioplastic disks detached from the Petri dishes; e) demonstration of the elastomeric properties of the bioplastics obtained.
17
LIST OF ABBREVIATIONS
3HV: 3-hydroxyvalerate; 4HB: 4- hydroxybutyrate; AO: alginate oligosaccharides; BMP: bio- methane potential test; C/N: carbon to nitrogen ratio; CDW: cell dry weight;
COD: chemical oxygen demand; CWs: cellulose wastes;
EPS: exopolysaccharides;
GHG: green house gas;
HRT: hydraulic retention time; LCA: life cycle assessment; MCL: medium chain- length; MMC: mixed microbial cultures.
OFMSW: organic fraction of municipal solid waste; OLR: organic loading rate;
P(3HB): poly(3-hydroxybutyrate);
P(3HB-3HV): poly(3-hydroxybutyrateco- 3-hydroxyvalerate);
PCR-DGGE: polymerase chain reaction denaturing gradient gel electrophoresis; PHAs: polyhydroxyalkanoates;
PHB: polyhydroxybutyrate;
PHBV: poly (hydroxybutyrate-co-hydroxyvalerate); S/I: substrate/inoculums ratio;
SCL: short-chain-length; SRT: solid retention time; TS: total solids;
TTA: total titratable acidity;
UASB: upflow anaerobic sludge blanket; VFAs: volatile fatty acids;
VS: volatile solids;
18
CHAPTER 1
19
1.1 Short overview
Recently, issues concerning the sustainable and harmless disposal of organic solid waste have generated interest in microbial biotechnologies aimed at converting waste materials into bioenergy and biomaterials, thus contributing to a reduction in economic dependence on fossil fuels.
In particular, the development of high-performance microbial strains to bioenergy and biomaterials production using organic by-products and waste, could reasonably make their production costs comparable to those required by fossil fuels and petrochemical-derived plastics, thus promoting their use.
For this purpose, promising food processing by-products are dairy wastes, such as cheese whey and buttermilk, because they can be conveniently processed and valorized in a biorefinery value chain since they are abundant, zero-cost and all year round available. For this reasons, in the recent past, many studies have been focused on the use of dairy waste for the production of either bioenergy or biopolymers separately. On the contrary, only few studies have been focused on a new integrated system based on a series of anaerobic and aerobic stages aimed at yielding biogas and/or hydrogen coupled with polyhydroxyalkanoates (PHA) production. In fact, in the same processing chain, the volatile fatty acids (VFAs) resulting from the acidogenic and acetogenic steps of the anaerobic digestion are used as substrates for aerobically producing PHA. In this context, a comprehensive knowledge of the microbial species involved in producing biological gases (biohydrogen and biogas) and valuable intermediates (VFAs) from dairy wastes is necessary to further improve the performance of the integrated system. Therefore, critical aspects, designing as well as managing criteria and future perspectives of this integrated system are handled and discussed as topics in this PhD thesis.
1.2 Aims and outline
The objective of this research was achieved by developing the experimental work in two main stages, respectively focused on the following intermediate aims: i) enhance the current knowledge on the microbial communities involved in the anaerobic digestion of dairy wastes; ii) address the valuable chemical intermediates (VFAs) resulting from the anaerobic phase to polyhydroxyalkanoates (PHAs) synthesis. Therefore in the first stage of the research, it was
20
investigated the role of microbial groups in the anaerobic processes and the correlation between the intermediates or end-products (e.g., H2, CH4 and VFAs) with the bacterial groups during
the anaerobic process, whereas through the second stage it was examined the PHAs formation from the organic acids resulting from the acidogenic and acetogenic phases (anaerobic process) using pure cultures as well as mixed. This research led to intermediate results that are reported in the different chapters that compose this thesis according to the following structure:
In Chapter 2, an overview of the suitable substrates and microbial strains used in low-cost polyhydroxyalkanoates as well as biohydrogen and biogas production is given with the possibility of creating a unique integrated system. The results of a preliminary study on the anaerobic digestion of cheese whey and buttermilk collected from a buffalo mozzarella cheese factory located in Casoria in the Campania region (Italy) under different operating conditions (inoculum percentage and pH) are reported in Chapter 3: the inoculum concentrations was set between 1-5% (w/v), natural acid conditions were set and different microbial groups related to biogas production were selected. In order to limit the use of the inoculum and make the process performance independent on its availability, in Chapter 4 it was investigated the effect of inoculum ranging between 1-3% (w/v) on the anaerobic digestion of dairy waste. This effect was evaluated by monitoring the microbial growth and communities’ structure with culture-dependent and inculture-dependent methods: many archaeal species, mostly involved in the production of CH4, were identified by sequencing denaturing gradient gel electrophoresis (DGGE) bands.
Since the DGGE analysis, although is highly efficient, analyze a limited number of aspects if compared with the emerging metagenomic approaches based on high-throughput sequencing (HTS), in Chapter 5, it was examined the use of a polyphasic approach including HTS in lab-scale batch tests addressed to follow the microbiota dynamic in different stages of the anaerobic process fed with cheese whey and buttermilk. The fermented cheese whey obtained in these last experiments with high concentrations of organic acids, were characterized and used in further assays aimed to PHAs accumulation. Actually, in Chapter 6 pure culture of PHAs accumulating bacteria were screened for their ability to grow and accumulate PHAs by using the fermented cheese whey (organic acids resulting from the previous experiments) and comparing their performance with synthetic pure acids. In order to promote low cost processes for PHAs production, in Chapter 7,the use of mixed microbial cultures (MMC) in producing PHAs was tested: bacteria were selected from the activated sludge of a wastewater treatment plant (Mutela, Portugal) using as carbon source a fermented cheese whey at different level of salinity. The last chapter, Chapter 8, presents a critical synthesis of the main findings from the research and conclusions based on knowledge generated.
21
CHAPTER 2
Literature Review
This chapter has been published as:
Pagliano G, Ventorino V, Panico A, Pepe O. Integrated systems for biopolymers and bioenergy production from organic waste and by-products: a review of microbial processes. Biotechnol Biofuels 2017;10:113.
22
2.1 Introduction
Over the past few decades, the need to reduce pollutant emissions produced by conventional systems of organic waste disposal has promoted the development of technologies that convert organic waste into bioenergy and biomaterials. In the near future, this new approach in waste management, in addition to being eco-friendly, can reasonably replace fossil fuels with biomass (organic waste or energy crops) as a source of both energy and materials (e.g., plastics) and therefore make two contributions toward reducing greenhouse gas (GHG) emissions into the atmosphere (Bauen et al., 2009).
Petrochemical-derived materials can be replaced with biodegradable materials and biochemicals derived from renewable sources. In fact, organic waste materials are interesting renewable resources that can be converted into different value-added products, such as bioethanol or biochemicals obtained by sugar fermentation (Mezule et al., 2015; Liguori et al., 2016). Recent technological developments have explored the value of biochemical products as precursors to biopolymers, e.g., succinic acid (Ventorino et al., 2016a; Ventorino et al., 2017) and 2, 3-butanediol (Saratale et al., 2016) derived from lignocellulosic biomass. Some biopolymers can be produced by microorganisms from the accumulation of extracellular materials, such as exopolysaccharides (EPS) (Pepe et al., 2013), and used in the food, chemical, cosmetic, and packaging industries as adhesives, absorbents, lubricants, and cosmetics. Furthermore, several biopolymers, such as polyhydroxyalkanoates (PHAs), polylactides, aliphatic polyesters, and polysaccharides (Lee 1996), have already been successfully tested as bioplastics (Steinbüchel et al., 1998) because their physical and chemical properties perform just as well as conventional synthetic plastics. Among them, PHAs have gained much attention thanks to their complete biodegradability under various conditions within a period of one year (Cavalheiro et al., 2009). Different bacteria (e.g., Alcaligenes spp., Azotobacter spp., methylotrophs, Pseudomonas spp., Bacillus spp., and recombinant Escherichia coli)have been used in PHA production from different low-cost substrates. In fact, to replace conventional petrochemical-derived plastics, useful substrates for PHA production include organic waste and by-products. In fact, to commercialize PHAs, substantial effort has been devoted to reducing the production cost through the development of bacterial strains and more efficient fermentation/recovery processes because the price of the substrate has the largest influence on the production cost of PHA (Salehizadeh et al., 2004).
To make PHA production more feasible for industrial application, future prospects are mainly focused on promoting less expensive substrates, improved microorganism cultivation strategies,
23
and easier downstream processing methods, which are required for reducing production costs (Ahn et al., 2001). For this reason, different inexpensive substrates, such as molasses and sucrose, starch-based materials, cellulosic and hemicellulosic materials, sugars, whey, oils, fatty acids and glycerol, and organic matter from waste and wastewater (Castilho et al., 2009), have been tested to produce biopolymers, and the results are promising.
Furthermore, it is important to highlight that the same substrates used to produce biopolymers represent a source of renewable energy (biomethane and biohydrogen) obtainable through an anaerobic digestion process. Therefore, such substrates can be simultaneously used to produce bioenergy and biopolymers, thus achieving a maximum valorization when they are used as organic waste.
The anaerobic digestion process is characterized by biochemical reactions in series carried out by different consortia of bacteria that convert organic compounds into methane, carbon dioxide, water, and ammonia. In the first step, complex and not negligibly sized biomolecules of organic materials are disintegrated and subsequently hydrolyzed into soluble, biodegradable organics by extracellular enzymes (Panico et al., 2014). Then, acidogenic microorganisms metabolize products by hydrolysis into volatile fatty acids (VFAs) (Acidogenic phase) (Sans et al., 1995). Acidogenic products are first converted into acetic acid, hydrogen, and carbon dioxide (Acetogenic phase) and, finally, into methane by methane-producing Archaea (Methanogenic phase) (Chynoweth et al., 2001). The same substrates of methanogenic metabolism are the precursors that form PHAs (Patel et al., 2011). Thus, this review gives insights into the current methodology for producing PHAs and biogas, with a focus on the use of organic waste and by-products as raw materials to keep production costs low. Moreover, this review examines the potential of several biological processes that can occur in the development of an innovative unique integrated system able to simultaneously produce bioenergy and biopolymers.
2.2 Bio-based and biodegradable polymers: PHAs production and classification
Polyhydroxyalkanoates (PHAs) represent a group of bio-based and biodegradable polymers, considered similar to petroleum-based polymers (Carvalho Morais, 2013).
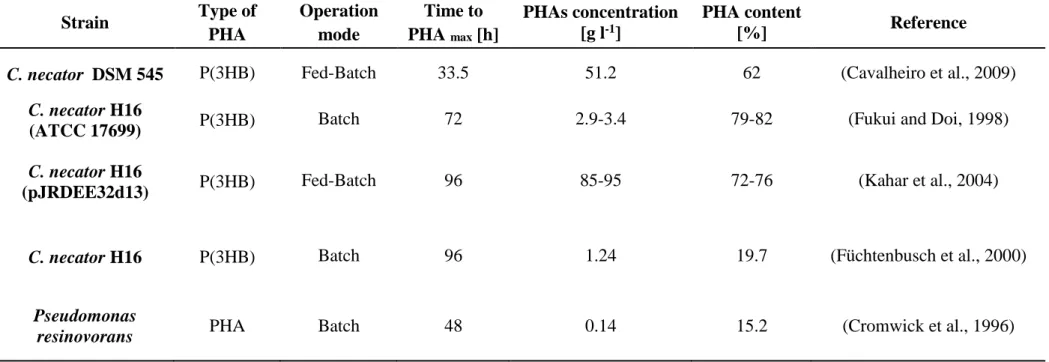
Many bacteria, such as Cupriavidus (C.) necator (Koutinas et al., 2007; Xu et al., 2010; Haas et al., 2008; Yu et al., 2008; Cavalheiro et al., 2009; Fukui and Doi, 1998; Kahar et al., 2004; Füchtenbusch et al., 2000; Yu, 2001; Wang and Yu, 2007) different Pseudomonas (P.) species (P. fluorescens, P. hydrogenovora, P. oleovorans, P. resinovorans, P. aeruginosa, P. mendocina) (Jiang et al., 2007a; Koller et al., 2008; Füchtenbusch et al., 2000; Cromwick et
24
al., 1996; Hori et al., 2002; Guo et al., 2011), strains belonging to Azotobacter (A.) species (A. vinelandii, A. chroococcum, A. beijerinckii) (Page et al., 1992; Chou et al., 1997; Kim 2000; Quagliano et al., 1999; Pal et al., 1999, Bacillus (B.) spp. (Halami 2008; Yilmaz and Beyatli 2005; Law et al., 2003), recombinant Escherichia (E.) coli (Lee 1996; Liu et al., 1998; Lee et al., 1997; Kim 2000; Nikel et al., 2006; Ahn et al., 2001; Park et al., 2002) and Burkholderia (Bk.) spp. (Nonato et al., 2001; Silva et al., 2004), synthesize PHAs as intracellular carbon and energy storage, accumulating these polyesters of hydroxyalkanoates as granules in the cytoplasm of cells (Reddy et al., 2003). Polyhydroxyalkanoic acids produced by bacteria are the building blocks of biodegradable thermoplastics and elastomers currently in use, or candidates to be used, in the medical and pharmaceutical industries as well as in agriculture (Suriyamongkol et al., 2007). The production of PHAs occurs mainly when cells are cultivated in the presence of a carbon source in excess, and their growth is limited by the lack of another nutrient, such as nitrogen, phosphorus, sulfur, or oxygen (Anderson et al., 1990). When the supply of the limiting nutrient is restored, PHAs are degraded by an intracellular depolymerase and subsequently metabolized as a carbon and energy source (Taidi et al., 1994) and the number of bacteria rapidly increases.
PHAs can be divided into two groups depending on the number of carbon atoms in the monomer units: short-chain-length (SCL) PHAs, which consist of 3-5 carbon atoms, and medium chain-length MCL-PHAs, which consist of 6-14 carbon atoms (Anderson et al., 1990). The length of the side chain and functional group has great importance for the physical properties. The SCL-PHAs are crystalline, brittle, and stiff polymers, with a high melting point and a low glass transition temperature. In contrast, MCL-PHAs show low crystallinity and tensile strength and lower melting points.
PHAs have the general formula shown in Figure 2.2 (Castilho et al., 2009), where “n” is equal to 1, and “R” is a methyl group. The most abundant PHA family member is poly(3-hydroxybutyrate) (P(3HB)). Using different substrates in a co-feeding system, copolymers of PHB (polyhydroxybutyrate) can be formed, such as polymers containing 3-hydroxyvalerate (3HV) or 4-hydroxybutyrate (4HB) monomers. 3HV can be incorporated into the PHB molecule, forming poly(3-hydroxybutyrateco-3-hydroxyvalerate) [P(3HB-3HV)], resulting in a more brittle compound than P(3HB) (Reddy et al., 2003).
25
Figure 2.2. General structure of polyhydroxyalkanoates (PHAs). The most studied PHA type
is the homopolymer P(3HB), for which n is equal to 1 and R is a methyl group (Castilho et al., 2009).
Thus, to reduce the environmental footprint by producing and using petrochemical-derived products, they can be replaced partially and even completely by polyesters derived from biological processes (i.e., PHAs) that have the significant advantage of being completely biocompatible (Reddy et al., 2003). Biocompatibility is the property shown by certain materials that generates non-toxic compounds when they are disposed of after use as well having the same physical property of the artificial material derived from petrol that they would replace (Castilho et al., 2009). Unlike petroleum-derived plastics that take several decades to degrade, PHAs can be completely bio-degraded within a year by a variety of microorganisms, mainly bacteria and fungi (Suriyamongkol et al., 2007). In particular, several aerobic and anaerobic PHA-degrading bacteria, such as Comamonas sp. (Jendrossek et al., 1993), P. lemoignei (Delafield et al., 1965) from soil, Alcaligenes faecalis (Tanio et al., 1982) and P.fluorescens from activated sludge (Mergaert et al., 1994) and P. stutzeri from lake water (Mukai et al., 1994), and fungi, such as Aspergillus fumigatus (Mergaert et al., 1994), have been isolated from various environments. These microorganisms excrete extracellular PHA depolymerases to degrade PHAs into water-soluble monomers and oligomers, using them as a carbon source (or methane under anaerobic conditions) (Lee, 1996).
26
Thus, life cycle assessment (LCA) conducted on the use of PHAs has been proven as the main advantage to avoid the accumulation of plastics in the environment (Patel et al., 2003). Therefore, PHAs are better than petrochemical analogues, such as polyethylene and polypropylene (Akiyama et al, 2003; Harding et al., 2007; Pietrini et al., 2007), in terms of sustainability and environmental protection (Atlić et al., 2011), but the realization and more widespread use of these environmentally friendly processes are related to the cost of the final product. The current PHA price also depends on monomer composition, and it is usually higher for copolymers; overall, it ranges from 2.2-5.0 € Kg-1 (Gholami et al., 2016; Chanprateep, 2010; Castilho et al., 2009), which is less than the typical range of 10-12 € Kg-1 reported at the beginning of the past decade (Gholami et al., 2016). Notwithstanding the burden of costs and the environmental impacts of plastic trash, the current PHA prices are not deemed to be commercially competitive with respect to conventional petroleum-based polymers, which typically cost less than 1.0 € Kg-1 (Gholami et al., 2016; Chanprateep, 2010; Valentino et al.,
2017). Although the price of PHAs is high, several companies are producing PHA products worldwide to meet the demand of the market, including in the UK, Japan, US, Germany, Brazil, Italy, and China (De Marco, 2005; Tian et al., 2009).
2.3 Suitable substrates and bacterial strains for PHA production
The synthesis of PHAs occurs in many microorganisms under well-defined operating conditions and when they are supplemented with specific substrates, better known as PHA precursors. These compounds are incorporated into PHAs and used as the sole carbon source by microorganisms (or coupled with others as cosubstrates) if the cells are cultivated in the presence of an excess carbon source. Moreover, PHAs are also formed when growth is impaired or restricted by the lack of another nutrient, such as nitrogen, phosphorus, or oxygen (Lee, 1996). Thus, different PHAs could be synthesized from the combination of different substrates and microorganisms under different growth conditions (aerobic or anaerobic, temperature, and pH).
Relevant substrates for the production of PHAs are as follows: carbon dioxide (Tsuge, 2002) or fossil resources, such as low rank coal (Füchtenbusch et al., 1999) renewable resources (e.g., starch (Yu, 2001; Halami, 2008; Koutinas et al., 2007; Xu et al., 2010; Vandamme and Coenye, 2004), cellulose (Lee, 1998), sucrose (Jiang et al., 2007a; Page et al., Koutinas et al., 2007)), waste materials (e.g., molasses (Page et al., 1992; Yilmaz and Beyatli, 2005; Liu et al., 1998), whey (Ahn et al., 2001; Koller et al., 2008; Lee at al., 1997; Nikel et al., 2006; Park et al.,
27
2002), glycerol (Cavalheiro et al., 2009), and chemicals (e.g., propionic acid (Kalia et al., 2000)). To avoid the use of fossil resources due to environmental issues and to limit PHA production costs, renewable resource and waste materials are reasonably considered suitable and promising substrates.
In the following paragraphs, an overview of different works categorized on the basis of the different substrates used is given. The results are presented in terms of the PHA content (%PHAs, %) and concentration ([PHAs], g l-1) calculated by the following equations 1 and 2,
respectively, where mPHAs is the amount of PHAs [mg], mcells [mg] is the amount of freeze-dried biomass in samples, and CDW is the cell dry weight [g l-1]:
%𝑃𝐻𝐴𝑠 =𝑚𝑃𝐻𝐴𝑠
𝑚𝑐𝑒𝑙𝑙𝑠 × 100 (1)
[𝑃𝐻𝐴𝑠] =%𝑃𝐻𝐴𝑠
100 × 𝐶𝐷𝑊 (2)
2.3.1Starch-based material as a source of PHAs
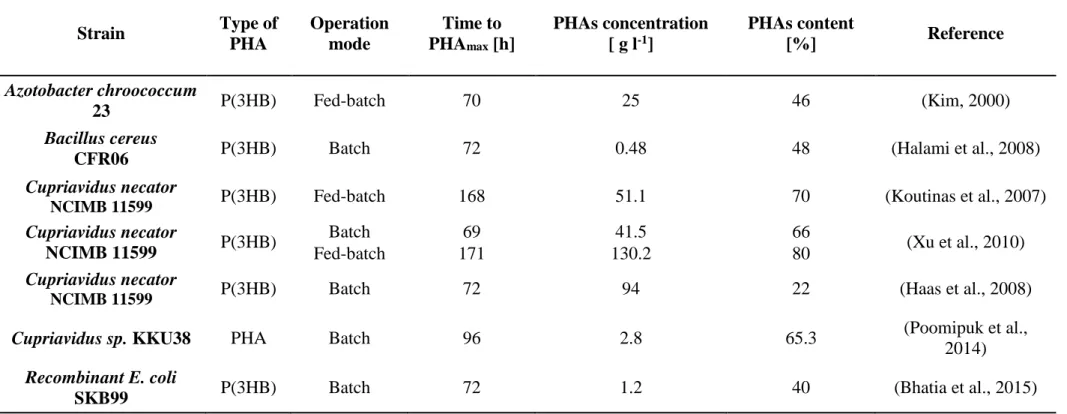
Starch is a renewable carbon source available in large amounts. Prior to fermentation, starch is hydrolyzed to glucose by a two-step process, liquefaction and saccharification, because PHA-producing bacteria cannot synthetize amylase enzymes for starch degradation. Commercial hydrolyzing enzymes are often used, but they contribute to an increase in the cost of the glucose production process (Kim, 2000). Kim (2000) used soluble starch to produce P(3HB), obtained after 70 h of incubation with 25 g l-1 of PHB (content of 46% in cell dry weight), in fed-batch
cultures of A. chroococcum strain 23 under oxygen-limiting conditions. Halami (2008) reported the ability of the isolated strain Bacillus cereus CFR06 to accumulate PHAs in a starch medium composed of soluble starch, yeast extract, and salts. The genus Bacillus was identified as one of the first Gram-positive bacteria suitable to produce PHAs and was cultivated under nitrogen limitationin Luria–Bertani (LB) broth for 24 h at 37°C on a rotary shaker at 100–150 rpm/min. The results obtained were less promising than those found by Kim (2000) because, after 72 h of incubation, a P(3HB) concentration of 0.48 g l-1 with a content of 48% was achieved.
28
Koutinas et al. (2007) proved the potential of Cupriavidus necator (synonym Wautersia eutropha and formerly classified as Alcaligenes eutrophus, formerly classified as Ralstonia (R.) eutropha (Vandamme et al., 2004)) in PHB production from a specific substrate derived from wheat. The authors conducted fed-batch tests using a 500 ml shake flask on a 250 rpm rotary shaker at 30°C and a pH range of 6.5–6.8. The results showed a PHB concentration of 51.1 g l-1 using a culture medium with free amino nitrogen as substrate at a concentration of 1.2 g l-1. Under the same operating conditions (working volume, rpm, temperature, and pH
range), Xu et al. (2010) compared the batch and fed-batch modes using C. necator NCIMB 11599 grown on wheat-derived media. They demonstrated that more PHB was accumulated in cells operating in fed-batch mode. In fact, the use of fed-batch mode allowed for an increase in PHB concentration to 130.2 g l-1 (PHB cells content ~80%) compared with batch fermentation that showed a production of 41.5 g PHB l-1 (PHB cells content ~66%). Haas et al. (2008) used saccharified waste potato starch as a carbon source for PHB production by C. necator NCIMB 11599, obtaining a PHB concentration of 94 g l-1, with a specific yield from starch of 0.22 PHB g starch g-1 under phosphate-limiting conditions. Poomipuk et al. (2014) isolated and selected the strain Cupriavidus sp. KKU38, which was able to accumulate PHAs up to 65.27% (PHAs concentration of 2.8 g l-1)from cassava starch hydrolysate as a sole carbon source in a 250 ml flask (Table 2.3.1).
However, to overcome the high costs of the hydrolysis of starch into glucose by a two-step process (liquefaction and saccharification), making this feedstock less economically viable, Bhatia et al. (2015) constructed the recombinant E. coli strain SKB99 harboring plasmids containing genes for starch hydrolysis (from Paenibacillus sp.) and PHB synthesis (from R. eutropha). This engineered strain utilized starch as the sole carbon source, with a maximum PHB production of 1.24 g l-1 (PHB content 40%) for 72 h with 2% (w/v) starch (Table 2.3.1). In addition, the accumulation of PHB started with the growth of the strain E. coli SKB99 and remained consistent until it attained the stationary phase, highlighting that PHB production in this engineered strain is not regulated by the stress response, unlike in R. eutropha and other microorganisms.
Therefore, starch-based materials are suitable substrates for PHA accumulation and, in particular, for P(3HB) accumulation. However, PHA accumulation strictly depends on the bacterial species and strains that exhibit different biotechnological performances depending on the carbon source and the culture conditions. The best results were obtained using C. necator NCIMB 11599 cultured on wheat and hydrolyzed waste potatoes under nutrient (nitrogen or phosphorus) limiting conditions, operating in batch and fed-batch mode, respectively.
29
Table 2.3.1 Overview of studies reporting PHAs production from starch-based materials
Strain Type of PHA Operation mode Time to PHAmax [h] PHAs concentration [ g l-1] PHAs content [%] Reference Azotobacter chroococcum 23 P(3HB) Fed-batch 70 25 46 (Kim, 2000) Bacillus cereus
CFR06 P(3HB) Batch 72 0.48 48 (Halami et al., 2008)
Cupriavidus necator
NCIMB 11599 P(3HB) Fed-batch 168 51.1 70 (Koutinas et al., 2007)
Cupriavidus necator NCIMB 11599 P(3HB) Batch 69 41.5 66 (Xu et al., 2010) Fed-batch 171 130.2 80 Cupriavidus necator
NCIMB 11599 P(3HB) Batch 72 94 22 (Haas et al., 2008)
Cupriavidus sp. KKU38 PHA Batch 96 2.8 65.3 (Poomipuk et al.,
2014)
Recombinant E. coli
30
2.3.2 Molasses and sucrose as sources for PHAs
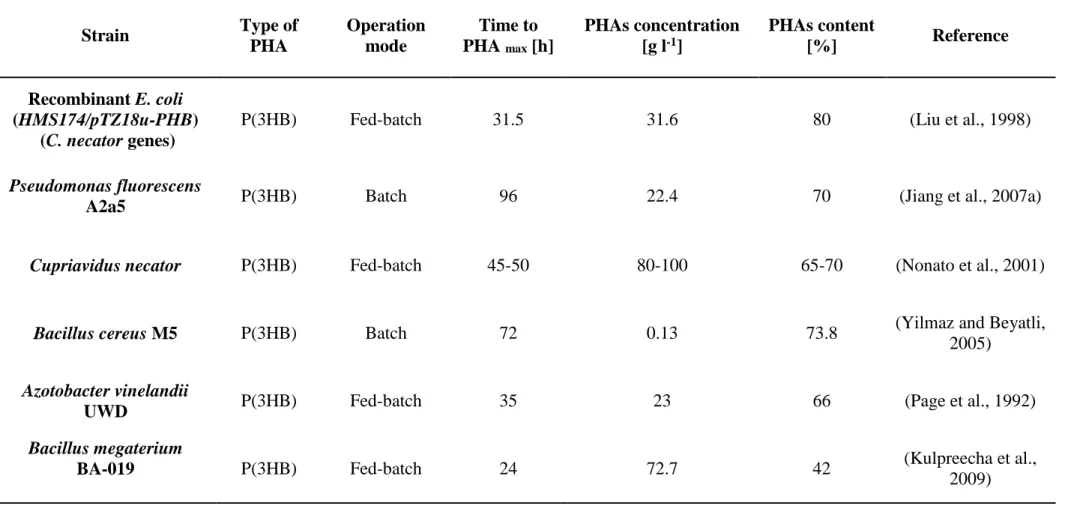
Molasses is a common industrial by-product of sugar production, is much cheaper than glucose, and is extensively used as a carbon source for PHA production from biological processes (Table 2.3.2). Liu et al. (1998) demonstrated that recombinant Escherichia coli (HMS174/pTZ18u-PHB) can efficiently utilize molasses as the sole carbon source to produce PHB. A fed-batch feeding strategy was developed to improve cell growth and PHB production. The final PHA concentration was 31.6 g l-1, and 80% of PHAs was accumulated. Jiang et al.
(2007a) isolated a strain of (PHB)-accumulating bacteria from the soil in Alaska (USA), identified as P. fluorescens A2a5. This microorganism is capable of accumulating a large amount of granules in its cells when grown in sugarcane liquor medium. Batch cultivation was carried out at 25°C in a 5 l bioreactor inoculated with 1% inoculum (v/v) at pH 7.0. In this way, a maximum cell dry weight (CDW) of 32 g l-1 with a PHB concentration of 22.4 g l-1 was obtained, and the PHB content was approximately 70%. C. necator was aerobically grown in a well-balanced medium consisting of sugarcane and inorganic nutrients to reach a high cell density (Nonato et al., 2001). Then, cell growth was shifted to PHB synthesis by limiting nutrients other than the carbon source. The fed-batch fermentation process was carried out by continually feeding (45-50 h) a high concentration of sugar syrup to achieve a biomass of nearly 65-70% PHB, with a concentration ranging from 80 to 100 g l-1.
The effect of different molasses concentrations (1-5 g molasses/100 ml water) on PHB production by B. cereus M5 was investigated by Yilmaz and Beyatli (2005). They observed that PHB productivity by this strain decreased with increasing molasses concentration. In fact, the highest P(3HB) concentration produced by this strain was 0.1 g l-1 (polymer content of
73.8%) with 1% molasses concentration.
31
Table 2.3.2. Overview of studies reporting PHAs production from molasses and sucrose
Strain Type of PHA Operation mode Time to PHA max [h] PHAs concentration [g l-1] PHAs content [%] Reference Recombinant E. coli (HMS174/pTZ18u-PHB) (C. necator genes)
P(3HB) Fed-batch 31.5 31.6 80 (Liu et al., 1998)
Pseudomonas fluorescens
A2a5 P(3HB) Batch 96 22.4 70 (Jiang et al., 2007a)
Cupriavidus necator P(3HB) Fed-batch 45-50 80-100 65-70 (Nonato et al., 2001)
Bacillus cereus M5 P(3HB) Batch 72 0.13 73.8 (Yilmaz and Beyatli, 2005)
Azotobacter vinelandii
UWD P(3HB) Fed-batch 35 23 66 (Page et al., 1992)
Bacillus megaterium
BA-019 P(3HB) Fed-batch 24 72.7 42 (Kulpreecha et al.,
32
source. Fed-batch bioreactors were operated with 5% (w/v) molasses at pH 7.2 and inoculated with 4%(v/v) of the pre-grown strain. In the beet molasses medium, NH4 was depleted by 10
to 12 h to establish NH4-limiting conditions and fix nitrogen during the PHA production phase
of growth. After 35 h, a P(3HB) concentration of 23 g l-1 and a polymer content of 66% were achieved.
Kulpreecha et al. (2009) tested B. megaterium BA-019 on sugarcane molasses (20 g l-1) as a carbon source and urea or ammonium sulfate at 0.8 g l-1 as the investigated nitrogen sources.
In the experiments, a cell dry mass concentration of 72.7 g l-1 in 24 h, with a PHB content of
42% (w/w), was achieved under nitrogen-limiting conditions operating in fed-batch mode. In addition, with sugarcane, C. necator showed the best PHA concentration among the bacterial strains (recombinant E. coli, A. vinelandii UWD, and B. megaterium) operating in fed-batch mode with molasses as a carbon source. In fact, C. necator is able to accumulate approximately 100 g l-1 synthesizing glucose (from starch) and sucrose (from sugarcane).
2.3.3 Lignocellulosic material as a source for PHAs
To produce fuels and other valuable bioproducts, lignocellulosic biomass from dedicated crops and agricultural and forestry waste are promising renewable sources (Di Pasqua et al., 2014; Ventorino et al., 2015; Ventorino et al., 2016a,b).
Lignocellulosic materials, consisting of lignin (complex polyphenolic structure), cellulosic (b-1,4-glucan), and hemicellulosic (arabinose, xylose, mannose, glucose, D-galactose, and sugar alcohols) fibers, constitute the most abundant renewable resources on our planet (Castilho et al., 2009).
The composition of lignocellulosic biomass differs in terms of lignin (10–25%), cellulose (30– 60%), and hemicellulose (25–35%) content (Kumar et al., 2010).
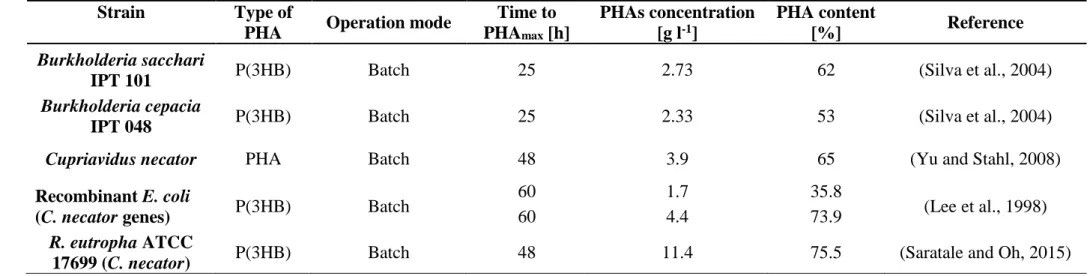
Silva et al. (2004) studied the potential of two bacterial strains, Bk.. cepacia IPT 048 and Bk. sacchari IPT 101A, in producing P(3HB), comparing biosynthesis from xylose and glucose with bagasse hydrolysate. In high-cell-density cultures using a mixture of xylose with glucose under P limitation, both strains reached a maximum P(3HB) concentration of 60 g l-1 dry biomass, containing 60% biopolymer. Higher polymer content and yield were observed under P limitation than under N limitation for Bk. sacchari IPT 101A, whereas Bk. cepacia IPT 048 showed a similar performance in the presence of both growth-limiting nutrient conditions. Using bagasse hydrolysate as the carbon source, polymer contents reached 62% and 53% for
33
B. sacchari IPT 101A and B. cepacia IPT 048, respectively, with a CDW of 4.4 g l-1 for both strains under N limitation (Table 2.3.3). Yu and Stahl (2008) also studied the performance of C. necator with the same substrate. In their experiment, the cultures were shaken in flasks at 200 rpm and 30°C for 48 h with pH adjusted to approximately 7.5. They demonstrated that P(3HB) was the predominant biopolyester formed from the hydrolysis of sugarcane bagasse, with a concentration of 3.9 g l-1, corresponding to a P(3HB) accumulation of 65% of the CDW, achieved with a high carbon to nitrogen ratio (C/N = 20 or above). Since a minimum nitrogen level should be maintained during cultivation, this high C/N ratio implies a high concentration of residual organic carbon or a high amount of hydrolysates. A moderate C/N ratio (7–10) may be used to yield a low concentration (less than 1 g l-1) of residual carbons and a moderate level of PHA content in the cells (45–50% w/w). Lee et al. (1998) investigated P(3HB) production from xylose and hydrolyzed cellulose by growing recombinant E. coli strains with C. necator PHA biosynthesis genes, testing the effects of supplementing a complex nitrogen source on cell growth and PHB production. The cells were cultivated for 60 h in a 250 ml flask containing 50 ml of medium in a shaking incubator at 250 rpm. When the strain TG1 (pSYL107) was grown on 20 g l-1 xylose, it was capable of accumulating 1.7 g l-1 of P(3HB) with 35.8% of polymer content. A higher P(3HB) concentration, equal to 4.4 g l-1, and a polymer content of 73.9% were reached when the previous culture medium was supplemented with 10 g l-1 of soybean hydrolysate. To evaluate the effects of the nitrogen source, tryptone and peptone were also tested, achieving 47.7% and 10.3% of PHB content, respectively.
The ability of R. eutropha ATCC 17699 (C. necator) to produce PHB in the presence of different waste biomass hydrolysates (rice paddy straw, soybean husk, sunflower husk, and wood straw) was evaluated by Saratale and Oh (2015). The most suitable substrate for PHB accumulation by this strain was the rice paddy straw hydrolysate, which was selected by the authors for optimization of the process, obtaining the maximal PHA accumulation (75.45%) and PHB production (11.42 g l-1) within 48 h of fermentation. Moreover, lignin and its
derivatives are also used for PHA production. Tomizawa et al. (2014) tested PHA-accumulating strains on mineral salt media containing each of the 18 lignin derivatives and hydroxybenzoic acids, including intermediates derived from the metabolism of lignin derivatives in bacteria. Most of the strains grew poorly in media containing lignin derivatives, such as p-coumaric acid, caffeic acid, ferulic acid, and sinapinic acid. On the contrary, R. eutropha PHB-4 accumulated P(3HB) from 3-hydroxybenzoic acid and 4-hydroxybenzoic acid as the sole carbon sources, with a PHA content of 65 and 63 wt % and a dry cell weight of 1.6 and 0.69 g l-1, respectively.
34
Although C. necator species seems to be the best bacterial candidate for PHB production using lignocellulosic hydrolysate, the accumulation is lower than that obtained with sucrose- and starch-based materials as carbon sources. The lowest PHA accumulation could be due to the presence of specific toxic compounds (e.g., furfural, HMF, p-hydroxybenzoic aldehyde, and vaniline) that are usually released during the pretreatment of lignocellulosic biomass, which are known to have an inhibitory effect on microbial growth and metabolism.
35
Table 2.3.3. Overview of studies reporting PHAs production from lignocellulosic materials.
Strain Type of
PHA Operation mode
Time to PHAmax [h] PHAs concentration [g l-1] PHA content [%] Reference Burkholderia sacchari
IPT 101 P(3HB) Batch 25 2.73 62 (Silva et al., 2004)
Burkholderia cepacia
IPT 048 P(3HB) Batch 25 2.33 53 (Silva et al., 2004)
Cupriavidus necator PHA Batch 48 3.9 65 (Yu and Stahl, 2008)
Recombinant E. coli
(C. necator genes) P(3HB) Batch
60 1.7 35.8
(Lee et al., 1998)
60 4.4 73.9
R. eutropha ATCC
36
2.3.4 Whey-based culture media as a source for PHAs
Whey is the major by-product of cheese factories, representing 80–90% of the volume of transformed milk (Lee et al., 1997). It contains approximately 4.5% (w/v) lactose, 0.8% (w/v) protein, 1% (w/v) salts, and 0.1–0.8% (w/v) lactic acid, and its high biological oxygen demand (40 g l-1) makes it difficult to dispose. The discharge of large amounts of cheese whey into the environment can damage the chemical and physical structure of soil and pollute groundwater and can also affect the air (Zhong et al., 2015). This by-product represents an attractive low-cost substrate for producing PHAs (Table 2.3.4).
As seen in the previous sections, C. necator is one of the best-known bacteria among PHA-producing microorganisms, but it is unable to hydrolyze lactose or metabolize galactose (Gomez et al., 2012). In fact, C. necator was able to use lactose only after the expression of genes encoding β-galactosidase and galactokinase, although at a very slow rate (Pries et al., 1990). Therefore, recombinant E. coli containing the C. necator PHA biosynthesis genes for the production of PHB from glucose is considered a good candidate for PHB production from whey (Lee et al., 1997). Lee et al. (1997) cultivated recombinant E. coli strains in a defined medium supplemented with varying concentrations of whey solution and obtained 5.2 g l-1 of PHB, corresponding to 81.3% (w/w) of PHB, with a concentration of 30 g l-1 of whey solution. Kim (2000) also studied recombinant E. coli strains as PHB-accumulating microorganisms under O2 limitation compared with conditions without O2 limitation. The highest PHB
accumulation (80%) was observed under O2-limiting conditions, with a PHB concentration of
25 g l-1. Instead, without O2 limitation, 57% of PHB was achieved with a concentration of 32
g l-1. A recombinant E. coli strain containing the PHA biosynthetic genes from Azotobacter
spp., specially designed for the production of PHB from milk whey, was studied by Nikel et al. (2006). Fed-batch cultures were carried out at 37°C in a 5.6-liter fermentor with a starting volume of 2.0 liters and a controlled pH of 7.20. The feeding solution used for fed-batch cultures was a concentrated and deproteinated whey solution containing 25% (w/v) lactose. They reported that after 24 h, the cells accumulated PHB up to 72.9% of their cell dry weight, reaching a PHA concentration of 51.1 g l-1. Physical analysis of PHB collected from the recombinants showed that its molecular weight was similar to PHB produced by an Azotobacter spp. strain.
A new fermentation strategy using a cell recycle membrane system was developed by Ahn et al. (2001) for the efficient production of P(3HB) from whey by a recombinant E. coli strain
37
harboring the Alcaligenes latus PHA biosynthesis genes.
Cell fed-batch cultures of recombinant E. coli CGSC 4401 (pJC4) were carried out to overcome the volumetric limitation of a fermentor (2.7 l) fed with a solution with low lactose solubility to increase PHB productivity. A whey solution containing 210 g lactose l-1 was used as a feeding solution. The final cell concentration, PHB concentration, and PHB content obtained in 39 h were 150 g l-1, 100 g l-1, and 67%, respectively. In another experiment, a whey solution containing 280 g lactose l-1 was used as a feeding solution. After 36.5 h, a PHB concentration
and a PHB content of 96.2 g l-1 and 80.5%, respectively, were obtained using a whey solution
concentrated to contain 280 g lactose l-1 as a feeding medium. No inhibitory effects of the by-products or nutrients on cell growth and PHB production were found during fermentation by the authors.
The production of P(3HB) from whey by fed-batch cultures of recombinant E. coli harboring a plasmid containing the Alcaligenes latus PHA biosynthesis genes was examined byPark et al. (2002).Fed-batch cultures of recombinant Escherichia coli SGSC 4401 (pJC4) were carried out at 30°C in 30 l (working volume of 10 l) and 300 l (working volume of 150 l) fermenters supplying only air. The culture pH was controlled at 6.9. With lactose below 2 g l-1, the cells grew to 12 g l-1 with 9% (w/w) P(3HB) content in a 30 l fermenter. The accumulation of P(3HB) could be triggered by increasing lactose to 20 g l-1. Using this strategy, 35.5 g l-1 was obtained with a 70% (w/w) P(3HB) content after 26 h. The same fermentation strategy was used in a 300 l fermenter, and a 20 g l-1 with 67% (w/w) P(3HB) content was obtained in 20 h by Park et al. (2002). Koller et al. (2008) compared the production of PHB under nitrogen-limiting conditions obtained with P. hydrogenovora using the following two substrates: hydrolyzed whey permeate and glucose/galactose medium. Shake flasks (1 l) containing 250 ml of hydrolyzed whey permeate or synthetic medium supplemented with glucose and galactose (each 2.5 g l-1) were both inoculated with 5% (v/v) P. hydrogenovora. The flasks were shaken
at 30°C for 48 h. Furthermore, the study investigated the influence of the 3HV precursor sodium valerate on the bacterial growth of P. hydrogenovora. Thanks to its advanced properties compared with those of highly crystalline pure PHB (Koller et al. 2008), the ability of the strain to biosynthesize P(3HB-co-3HV) in media supplemented with hydrolyzed whey permeate and sodium valerate was evaluated. In these two different experiments, PHA content was confirmed at 12% for both types of PHAs, but the PHA concentration was higher when sodium valerate was added to P(3HB-co-3HV) production.
A recombinant strain of E. coli was generally used to obtain the PHA concentration (more than 90 g l-1) from whey-based culture media because C. necator is unable to hydrolyze lactose. In
38
fact, several studies tested different lactose concentrations to correlate this parameter to PHA accumulation. Fed-batch experiments supplemented with a high amount of lactose (hydrolyzed from chees whey) were performed to obtain a higher PHA concentration. Otherwise, when increasing the lactose concentration to 280 g l-1, a relevant increase in PHA concentration was not observed.
In addition, it is interesting to note that with whey-based culture media, the oxygen-limiting conditions enhance PHB biosynthesis from recombinant E. coli but decrease PHA concentration in the cells.
39
Table 2.3.4. Overview of studies reporting PHAs production from whey-based culture media.
Strain Type of PHA Operation mode Time to PHA max [h] PHAs concentration [g l-1] PHA content [%] Reference Recombinant E. coli (C.
necator genes) P(3HB) Batch 49 5.2 81.3 (Lee et al., 1997)
Recombinant E. coli (C. necator genes)GCSC 6576 P(3HB) Fed-batch with oxygen limitation 52 25 80 (Kim, 2000) Fed-batch without oxygen limitation 35 32 57 Pseudomonas hydrogenovora DSM 1749 P(3HB) Fed-batch 41 1.27 12 (Koller et al., 2008) P(3HB-co-3HV) 31 1.44 12 Recombinant E. coli K24K
(Azotobacter spp. genes) P(3HB) Fed-batch 24 51.1 72.9
(Nikel et al., 2006)
Recombinant E. coliCGSC
4401 P(3HB) Fed-batch 36.5 96.2 80.5 (Ahn et al., 2001)
Recombinant E. coli CGSC
4401 (A. latus genes) P(3HB)
Fed batch 30 l
bioreactor 26 35.5 70
(Park et al., 2002) Fed batch 300 l