Functional Characterization of
Protein PDIA3
Doctor of Philosophy in Biochemistry
XXXI Cycle (2015-2018)
Department of Biochemical Sciences
“Alessandro Rossi Fanelli”
Candidate
Flavia Giamogante
Thesis Advisor
PhD Cordinator
A papa’,
alla mia terra e
alla sua gente…
Introduction ... 9
1.1. Protein Disulfide Isomerase family: a member of the thioredoxin superfamily ... 9
1.2. PDIA3 protein ... 12
1.2.1. PDIA3 structure and functions ... 12
1.2.2. PDIA3 localization in the ER ... 14
1.2.3. PDIA3 localization in the cytosol ... 16
1.2.4. PDIA3 localization in the nucleus ... 17
1.2.5. PDIA3 localization on cell membrane ... 19
1.3. PDIA3 and diseases ... 20
1.3.1. PDIA3 and Alzheimer’s disease ... 21
1.3.2. PDIA3 and platelet aggregation ... 23
1.4. Polyphenols ... 24
Chapter 2: Aim of the research ... 29
2.1. Identification of specific natural PDIA3 interactors able to bind and modulate its activity ... 29
2.2. Assessment of PDIA3 involvement in platelet aggregation ... 30
2.3. PDIA3 expression is altered in the limbic brain regions of triple-transgenic mouse model of Alzheimer's disease ... 32
Chapter 3: Materials and methods ... 35
3.1. Identification of specific natural PDIA3 interactors able to bind and modulate its activity ... 35
3.1.1. Chemicals ... 35
3.1.2. Protein expression and purification ... 36
3.1.3. Fluorescence Quenching Measurements ... 36
3.1.4. Determination of Protein Disulfide Reductase Activity... 37
3.1.5. Isothermal titration calorimetry (ITC) ... 38
3.1.6. Cell Culture ... 39
3.1.7. Cell Viability ... 39
3.1.8. Cellular PDIA3 expression evaluated by Western Blotting .... 40
3.1.9. Statistical analysis ... 41
3.2. Assessment of PDIA3 involvement in platelet aggregation ... 41
3.2.1. Chemicals ... 41
3.2.2. Platelets isolations and activation... 41
3.2.3. PDIA3 Immunoblotting ... 42
3.2.4. PDIA3 immunoprecipitation from surrounding medium of aggregated platelets ... 43
3.2.5. Statistical analysis ... 44
3.3. PDIA3 expression is altered in the limbic brain regions of triple-transgenic mouse model of Alzheimer's disease ... 44
3.3.1. Animals ... 44
3.3.2. Protein isolation and Dot Blotting ... 45
3.3.3. Double-fluorescence immunohistochemistry ... 46
3.3.4. Triple-fluorescence immunohistochemistry ... 46
4.1.3. Punicalagin effects on PDIA1 ... 57 4.1.4. Calorimetric analysis of Punicalagin-PDIA3 interaction ... 58 4.1.5. PDIA3 responses to H2O2 exposure in SH-SY5Y cells ... 61
4.1.6. Punicalagin increases cell sensitivity to oxidative stress in SH-SY5Y respect to shPDIA3-SH-SH-SY5Y cells ... 63 4.2. Assessment of PDIA3 involvement in platelet aggregation ... 65 4.2.1. PDIA3 protein levels after platelet stimulation ... 65 4.2.2. PDIA3 can be released under arachidonic acid and ADP treatment ... 67
4.3. PDIA3 expression is altered in the limbic brain regions of triple-transgenic mouse model of Alzheimer's disease ... 68 4.3.1. Alteration of PDIA3 expression in the limbic brain region .... 68 4.3.2. Aβ/APP-PDIA3 double-fluorescent immunostaining ... 69 4.3.3. GFAP/NeuN/PDIA3 triple-fluorescent immunostaining ... 73
Chapter 5: Discussions ... 77
5.1. Identification of specific natural PDIA3 interactors able to bind and modulate its activity ... 77
5.2. Assessment of PDIA3 involvement in platelet aggregation ... 78 5.3. The study of PDIA3 profile in brain areas of 3xTg Alzheimer murine model ... 79
Chapter 6: Conclusions ... 85 References ... 87
Ringraziamenti ... 101 Chapter 7: Appendix ... 105
1.1. Protein Disulfide Isomerase family: a member
of the thioredoxin superfamily
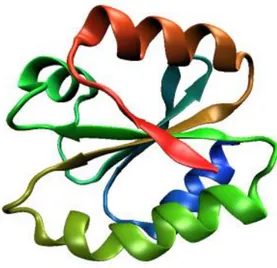
Thioredoxins (Trx) are small globular proteins that are found in all living cells from archeabacteria to humans [Holmgren, 1985]. The 3-D structures of Trx proteins are highly conserved and are characterized by a central core, consisting of five β-sheets surrounded by four α-helices and their active sites are characterized by the CXXC sequence, also known as the “Trx-motif” (Fig. 1) [Holmgren, 1995; Martin et al., 1995]. This structural configuration is known as thioredoxin fold and is present in different protein families, such as protein disulfide isomerases (PDIs), in DSB (disulphide bond formation) proteins, in glutaredoxin (Grx), in the glutathione reductase and glutathione peroxidase. The structural features that are conserved in Trx family members, such as the Trx-fold and the specific primary and secondary structures, lead to a different reactivity in catalyzing protein disulfide interchange reactions. It has been shown that both active site cysteine residues play an important role in the differentiation of the properties across the family and the relative stability (depending on cysteines nucleophilicity) of thiolates determines whether these enzymes catalyze oxidation, reduction or isomerization of thiol
residues in protein substrates [Cheng et al., 2011; Hatahet et al., 2009; Carvalho et al., 2009].
Figure 1. The typical Trx-fold.
PDI proteins with active Trx-domains are generally localized in the lumen of the endoplasmic reticulum (ER), where they mediate thiol-disulfide interchanges critical during post-translational protein folding [Galligan & Petersen, 2012].
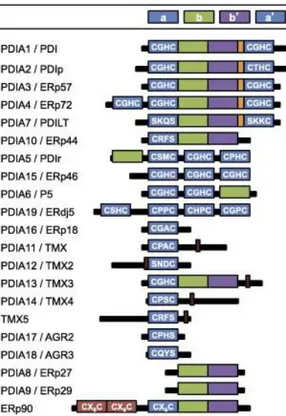
The protein disulfide isomerase (PDI) family is composed of 21 known proteins in humans, that belong to the thioredoxin superfamily, classified by sequence and structural homology (Fig. 2).
Figure 2. PDI family members in humans. In blue: catalytic domains a and a’, in green and purple non-catalytic b and b’ domains.
These enzymes catalyze the formation, reduction or isomerization of disulfide bonds of newly synthesized proteins in the lumen of the endoplasmic reticulum (ER). They are also part of a quality-control system, thanks to their molecular chaperone function. These proteins show a structural organization with multiple domains; each domain shows the typical Trx-fold and two or three of these domains contain the redox-active -CXXC- motif, while the others are considered Trx inactive domains [Turano et al., 2002]. Because of these redox-inactive domains, PDIs have the ability to bind peptides or proteins and to exert a molecular chaperone function [Ferrari et al., 1999; Ellgaard et al., 2005]. The number, the arrangement of tioredoxin-like domains and the specific sequence of the catalytic -CXXC-
motif can be used to differentiate the members of this family. These differences determine their distinct role in the oxidative folding, but also contribute to their specific functions in other pathways. Furthermore, the differences in their redox active motifs can reflect separated roles in oxidation, reduction and isomerization (Fig. 3) [Kozlov et al., 2006].
Figure 3. PDIs disulphide bond exchange. Depending on the redox form, they can catalyse oxidation, reduction or isomerization.
1.2. PDIA3 protein
1.2.1. PDIA3 structure and functions
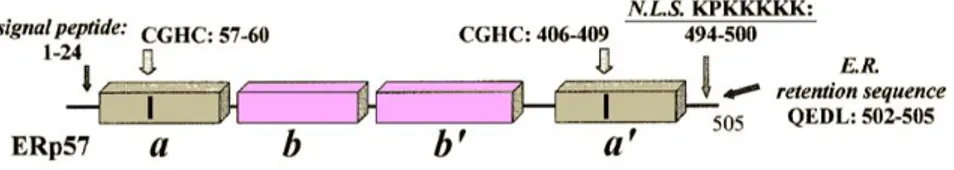
PDIA3, also known as ERp57, ERp60, GRP58, and 1,25D3-MARRS; encoded by PDIA3, is a prominent member of the PDI family that has attracted significant attention by the research community. PDIA3 was first detected as a stress-responsive protein with upregulated expression following glucose depletion-induced cellular stress [Lee et al., 1981]. Trx-like domains of the PDI proteins are present as catalytically active domains (a or a′) or
Figure 4. PDIA3 Protein modular structure.
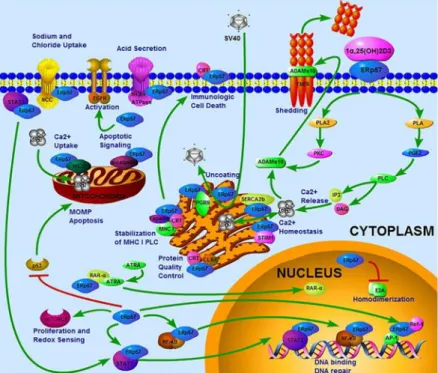
The catalytically inactive central domains, b and b′, have a vital role in the specific functionality of PDIA3 in protein binding and folding. The N-terminal signal sequence directs initial ER localization while the C-terminus contains a QDEL ER retention/retrieval motif [Khanal & Nemere, 2007]. PDIA3 is classically considered an ER resident protein, but also contains a nuclear location sequence. Indeed, there are evidences that the stimulation with various macrophage differentiation-inducing agents and cellular stressors is able to induce PDIA3 transfer from cytoplasm to nucleus [Grillo et al., 2006; Grindel et al., 2011; Wu et al., 2010]. PDIA3 has also been detected on cell surface [Khanal & Nemere, 2007], as well as in mitochondria [He et al., 2014; Ozaki et al., 2008]. Regardless of the mechanism(s) underlying PDIA3's subcellular localization, it is clear that the enzyme's activity is not limited to those attributed to classical ER-resident proteins (Fig. 5).
Figure 5. Representative PDIA3 cellular localizations and functions.
1.2.2. PDIA3 localization in the ER
PDIA3 is mainly located in the ER, where it participates to the correct folding and to the quality control of neo-synthesized glycoproteins destined to be secreted or localized to the cell membrane. To do this, PDIA3 interacts with lectins calreticulin (CRT) or calnexin (CNX), which are responsible for recognizing and binding to monoglycosylated proteins [Oliver et al., 1997; Molinari et al., 1999; Oliver et al., 1999]. It has been reported that modifications of specific residues in the b’ domain of PDIA3 reduce or abolish its binding to calreticulin, indicating that this domain is responsible for this interaction [Russell et al., 2004]. PDIA3, in complex with CRT/CNX, performs disulfide shuffling, a process that requires the intermediate formation of a mixed disulfide between the glycoprotein and the proximal
consists of the transporter associated with antigen processing (TAP) as centerpiece, which recruits the major histocompatibility complex class I (MHC I) heavy-chain/β2-microglobulin dimer by the adapter protein tapasin (Tsn). The transient Tsn-MHC I interaction is stabilized by PDIA3, and the endoplasmic reticulum (ER) chaperone calreticulin (CRT), which recognizes the monoglucose unit of N-core glycosylated MHC I molecules. In the PLC, PDIA3 interacts with tapasin [Dick et al., 2002]; the structure of this complex has been resolved at 2.6 Å resolution [Dong et al., 2009]; this was the first time in which the whole 3D structure of PDIA3 was obtained. Both a and a' domains of PDIA3 are involved in the interaction with tapasin. The cysteine 57 in the a domain of PDIA3 forms a disulfide bond with cysteine 95 of tapasin, while the a' domain-tapasin interaction is entirely non-covalent. The tapasin-PDIA3 complex is essential in the assembly and the stabilization of the PLC where PDIA3 shows a structural role rather than a catalytic one. In fact, the suppression of PDIA3 affects the stability of PLC and decreases both the expression of MHC I on the cell surface and the peptide loading within the PLC [Garbi et al., 2006]. PDIA3 also modulates the activity of the sarco/endoplasmic reticulum calcium ATPase (SERCA), a Ca2+-ATPase that transfers Ca2+ from the cytosol to the lumen of the ER, by regulating the redox state of the sulfhydryl groups in the intraluminal domain of SERCA [Li et al., 2004].
1.2.3. PDIA3 localization in the cytosol
PDIA3 has been reported in the cytosol thanks to its interaction with other proteins. In this localization, it associates with STAT3 [Sehgal, 2003]. STAT3 is a member of the STAT (Signal Transducer and Activator of Transcription) family. In response to cytokines and growth factors, these proteins are phosphorylated by receptor-associated kinases and then form homo- or hetero-dimers that translocate to the cell nucleus, where they act as transcription activators. STAT3 is activated through phosphorylation of tyrosine 705, in response to various cytokines and growth factors including interferons, epidermal growth factor and interleukin-6 (IL-6). The binding of IL-6 family cytokines to gp130 receptor triggers STAT3 phosphorylation by JAK2. Hyperactivation of STAT3 is frequently observed in a variety of human cancers, including head and neck cancer [Yu et al., 2004; Yu et al, 2009; Song et al., 2000]. Continuous STAT3 activation allows the growth and survival of cancer cells through modulation of cell cycle regulators (e.g., cyclin D1/D2 and c-Myc), upregulation of anti-apoptotic proteins (e.g., Mcl-1, Bcl-xl, and survivin), downregulation of the tumor suppressor p53, and induction of angiogenesis by vascular endothelial growth factor (VEGF); these mechanisms lead to tumor progression and resistance to anti-cancer drugs [Frank, 2013; Yu et al., 2004; Yu et al, 2009]. It has been reported that PDIA3 modulates STAT3 activity [Eufemi et al., 2004; Chichiarelli et al., 2010], although there are controversial results [Coe et al., 2010]. For instance, PDIA3 has been reported to interact with STAT3 and enhance its activity in melanoma and hepatoma cells [Eufemi et al., 2004; Chichiarelli et al., 2010], whereas other research suggested that this PDIA3-STAT3 complex negatively affects STAT3 DNA-binding activity [Coe et al., 2010].
contributes to the assembly of mTORC1, activates the kinase activity of mTOR, and also participates in the mechanism by which mTORC1 detects its upstream signals, such as stimulation by insulin or nutrients. PDIA3 over-expression induces cellular proliferation, while PDIA3 knockdown opposes the proliferation induced by insulin and nutrients. It is reasonable that part of this behavior is related to the mTOR-PDIA3 interaction, considering that mTOR is involved in the regulation of proliferation [Ramírez-Rangel et al., 2011].
1.2.4. PDIA3 localization in the nucleus
PDIA3 was found for the first time in the nuclei of 3T3 cells and rat spermatids [Ohtani et al., 1993] and of chicken hepatocytes, where PDIA3 was found mainly in the internal nuclear matrix fraction [Altieri et al., 1993]. This observation was not easily accepted initially, because it was considered unlikely that a protein provided with an ER retention signal can escape from the endoplasmic reticulum. However, nowadays there is strong experimental evidence, provided by different laboratories with a variety of experimental techniques, that PDIA3 can be found in the nucleus. It has been shown that PDIA3 is present in the nuclei of HeLa cells and that it interacts directly with DNA [Coppari et al., 2002]. PDIA3 interacts preferentially with A/T rich regions, and in general with DNA regions typical of the MARs (nuclear matrix associated regions) [Coppari et al., 2002; Ferraro et al., 1999]. The
DNA fragments immunoprecipitated with an anti-PDIA3 antibody from HeLa and Raji cells were enriched in sequences contained either in introns or in 5’-flanking regions of known genes [Chichiarelli et al., 2007; Chichiarelli et al., 2010]. This can be compatible with a gene expression regulatory function. Furthermore, the consensus sequences for STAT3 were found to be associated both with this transcription factor and with PDIA3 [Chichiarelli et al., 2010]. Because of the relatively low affinity for DNA and its lack of stringent sequence specificity, PDIA3 cannot itself be considered as a transcription factor, but it might be considered an accessory protein for transcription regulation, possibly maintaining the transcription factors in their proper redox state.
Moreover, PDIA3 shows in vitro DNA-binding properties that are strongly dependent on the redox state of the protein. The DNA binds to the a' domain [Grillo et al., 2002] and the binding requires the oxidized form of PDIA3 [Ferraro et al., 1999; Grillo et al, 2007]. Evidences, from M14 melanoma cells and HepG2 hepatoma cells, demonstrated the association of STAT3 and PDIA3 also in the nucleus at the level of DNA interaction [Eufemi et al., 2004; Chichiarelli et al., 2010]. The PDIA3 silencing in M14 cells causes a decrease in the expression of the STAT3-dependent gene CRP [Chichiarelli et al., 2010], suggesting the possibility of a positive involvement of PDIA3 in the signalling and/or DNA binding of STAT3.
In NB4 leukemia cells, PDIA3 and NFkB translocate to the nucleus after treatment with calcitriol and phorbol ester [Wu et al., 2010], hypothesizing, again, a role of PDIA3 in the control of gene expression through regulation of the conformation of associated transcription factors.
1.2.5. PDIA3 localization on cell membrane
The first time in which it was observed that PDIA3 can escape from the ER was when Hirano and colleagues noticed that the protein was being secreted from 3T3 cells [Hirano et al., 1995]. Afterwards several studies showed that PDIA3 could be found on the cell surface or in complexes with cell membrane proteins.
PDIA3 has been found on the surface of the sperm head, where it is required for sperm-egg fusion [Ellerman et al., 2006]. Possibly the PDIA3 role is related to the thiol-disulfide exchange reactions necessary for the gamete fusion process.
One of the functions of PDIA3 on the cell surface is the binding of the hydroxylated, hormonal form of vitamin D3, i.e., 1α,25-dihydroxycholecalciferol (1α,25-(OH)2D3, calcitriol) [Nemere et al., 2004], followed by activation of non-genomic responses and the internalization and nuclear import of PDIA3 itself.
It has been demonstrated that PDIA3 exists in caveolae, where it interacts with phospholipase A2 (PLA2) activating protein (PLAA) and caveolin-1 to initiate a rapid signaling in musculoskeletal cells via PLA2, phospholipase C (PLC), protein kinase C (PKC) and the ERK1/2 family of mitogen activated protein kinases (MAPK) [Boyan et al., 2012].
Moreover, it was recently reported that PDIA3 is associated and co-localizes with β-DG (one of the two subunit of the extracellular receptor dystroglycan,
DG) at the plasma membrane of 293-Ebna cells. It has been argued that PDIA3 may assist DG during its post-translational maturation or that it could modulate DG redox state [Sciandra et al., 2012].
PDIA3 is also present on the platelet surface and it has been showed that its inhibition blocks platelet activation [Holbrook et al., 2012; Wu et al., 2012]. PDIA3 is secreted by platelets and endothelial cells upon vascular injury and accumulates in the thrombus, where it regulates the activation and recruitment of other platelets [Holbrook et al., 2012].
Dihazi and colleagues [Dihazi et al., 2011] showed that PDIA3 was found to be secreted by renal cells in high amounts upon profibrotic cytokine treatment, and to interact with extracellular matrix (ECM) proteins, such as fibronectin and collagen. These data suggest that secreted PDIA3 could participate in ECM synthesis and stabilization, thus potentially leading to a progressive renal fibrosis.
1.3. PDIA3 and diseases
PDIA3 has been associated with several human diseases such as cancer, prion disorders, Alzheimer’s disease, Parkinson’s disease and hepatitis [Hetz et al., 2005; Martin et al., 1993; Muhlenkamp and Gill, 1998; Seliger et al., 2001; Erickson et al., 2005; Tourkova et al., 2005]. PDIA3 expression is increased in transformed cells, and it is thought that its role in oncogenic transformation is directly due to its ability to control intracellular and extracellular redox activities [Hirano et al., 1995]. An increase in PDIA3 expression has also been observed in the early stages of prion disease, suggesting that it may play a neuroprotective role in the cellular response to prion infection [Hetz et al., 2005]. Parkinson’s disease is characterized by the
1.3.1. PDIA3 and Alzheimer’s disease
Alzheimer’s disease (AD) is a progressive, neurodegenerative disorder that is associated clinically with a progressive cognitive impairment [Cummings, 2004]. AD histology is characterized by the accumulation of amyloid β-peptide (Aβ) plaques and neurofibrillary tangles composed of hyperphosphorylated tau protein [Cummings et al., 2004]. The endoplasmic reticulum (ER) stress response is regarded as an important process in the aetiology of AD [see for review Hashimoto and Saido, 2018]. The accumulation of pathogenic misfolded proteins and the disruption of intracellular calcium signalling are considered to be fundamental mechanisms that underlie the induction of ER stress, leading to neuronal cell death. A number of reports have indicated that Aβ oligomers or fibrils trigger ER stress in in vitro experimental systems based on primary cultures of neuronal cells, cell lines and brain slices [Nishitsuji et al., 2009; Alberdi et al., 2013; Seyb et al., 2006]. Further investigations have proposed mechanisms establishing a connection between extracellular Aβ and intracellular ER. The most likely mediator between Aβ and ER stress is calcium, with the binding of Aβ to glutaminergic receptors likely to induce ER stress-dependent cell death by disrupting cytosolic calcium homeostasis [Costa et al., 2012]. In this scenario, a crucial role seems to be play by the mechanisms for promoting the clearance of neurotoxic and/or misfolded proteins, a strategy that may curtail
the onset and slow the progression of AD. Recent studies are exploring the involvement of the PDIA3 in the response to several types of stress in different neurodegenerative diseases, such as AD, Parkinson disease and Prion disease [Erickson et al., 2005; Kim-Han et al., 2007; Sepulveda et al., 2016; Hettinghouse et al., 2018]. Available evidences indicate multiple distinct functional roles of PDIA3 under both physiological and disease states. In particular, under physiological conditions and during cellular stress, PDIA3 seems to play a role in cell protection against oxidative stress through its redox and chaperone activities, and it can prevent the development of diseases related to unfolded/misfolded proteins accumulation, such as Aβ [Ni et al., 2007; Ellerman et al., 2006; Plácido et al. 2014; Selinova et al., 2007; Erickson et al., 2005]. In line with the latter observation, it has been reported that diosgenin, a famous plant-derived steroidal saponin and structurally similar to the calcitriol, an endogen PDIA3 ligand [Nemere et al. 2012], acts as an exogenous activator of PDIA3, improving the object recognition memory deficit and reduce amyloid plaques and neurofibrillary tangles in the cerebral cortex and hippocampus of 5XFAD mice, an engineered mouse model of AD harboring five familial AD mutations [Tohda et al., 2012]. Likewise, diosgenin derivative, caprospinol (diosgenin 3-caproate), reduced amyloid deposits and improved memory dysfunction in Aβ1-42-infused AD model rats [Lecanu et al., 2010]. Furthermore, it has been demonstrated that PDIA3 expression levels significantly increased after Aβ1-42 treatment in HMO6 cells, an immortalized human microglial cell line, and in microglial cells from 5XFAD mouse brains [Yoo et al., 2015]. Collectively these observations highlighted that PDIA3 may play a crucial role in microglia activation during AD and that it may be a molecular target for AD treatment.
recognizing the site of injury, recruiting additional platelets by intercellular signaling, adhering to each other, and interacting with the coagulation cascade to form a haemostatic plug. Inappropriate platelet activation, and subsequent thrombus formation, is important in the clinical complications of arterial atherosclerosis and thrombosis. Platelets are activated by a variety of agents which act to recruit additional platelets to the site of injury, leading to the consolidation of the aggregate.
This activation process is initiated by the engagement of a range of specific cell surface receptors and associated to intracellular signaling pathways:
✓ Exocytosis of granular products: ADP, serotonin, calcium and fibrinogen are important in the recruitment of platelets to the site of injury.
✓ Expression of granular membrane proteins: Adhesive proteins (e.g., GPIb, P-selectin, CD63, and several integrins) have been shown to be present on the membranes of intracellular granules and are expressed on the surface of activated platelets.
✓ Eicosanoid formation: The arachidonic acid cascade is initiated, leading to Thromboxane A2 (TXA2) synthesis. TXA2 is a platelet agonist that plays a pro-aggregatory role.
✓ Surface expression of adhesive receptors: There is a conformational change in the αIIbβ3 integrin on the platelet surface from an inactive to an active configuration, exposing a fibrinogen and von Willebrand
Factor binding domain on the αIIbβ3 integrin that facilitates inter-platelet binding [McNicol and Israels, Critical Review, 2003].
PDIA3 is also present on the platelet surface and it is secreted by endothelial cells upon vascular injury and accumulates in the thrombus, where it regulates the activation and recruitment of other platelets [Holbrook et al., 2012]. In fact, it has been demonstrated through proteomic approach that PDIA3 is upregulated and released after GPVI activation, a glycoprotein receptor for collagen [Holbrook et al., 2012; Zhou et al., 2014]. Anti-PDIA3 antibody inhibits platelet aggregation, ATP secretion, calcium mobilization and activation of glycoprotein IIb/IIIa or fibrinogen receptor (αIIbβ3) in platelets stimulated with collagen-related peptide (CRP-XL), while platelet factor 4 (PF4) and P-selectin expression is minimally altered [Wang et al., 2013; Holbrook et al., 2012]. Genetically engineered mice lacking platelet-derived PDIA3 have prolonged tail bleeding times. PDIA3-null platelets reveal decreased platelet aggregation and decreased activation of αIIbβ3 [Wu et al., 2012]. β3 integrins pair with αIIb on the surface of platelets to create fibrinogen receptor αIIbβ3, the integrin activation is accompanied by several conformational changes that require a new pattern of disulfide bond formation [Zhou et al., 2014]. PDIA3 binding β3 integrin in thrombin-activated platelets is probably involved in platelets aggregation, due to its redox activity; however, the underlying mechanism is not completely understood. [Schulman et al., 2016].
1.4. Polyphenols
Flavonoids are a large class of polyphenolic compounds ubiquitous in plants and mostly present in fruits, vegetables and plant-based beverages
Figure 6. Molecular structure of tested flavonoids.
These physiologically active compounds have multiple well-known health beneficial effects. Many studies have suggested an association between consumption of flavonoids-rich food or beverages and the prevention of many degenerative diseases, including cancer, neurodegeneration and coronary heart disease and stroke [Woo et al., 2013; Hui et al., 2013; Hertog et al., 1993]. The protection offered by flavonoids is believed to be due to their antioxidant activity. The aromatic rings of the flavonoid molecule allow donation and acceptance of electrons from free radical species [Halliwell
2006]. In addition, many polyphenols regenerate the traditional antioxidant vitamins, vitamin C and vitamin E [Mandel et al., 2008] and act as metal chelators [Moridani et al., 2003]. It has been suggested that, in lower amounts, flavonoids as well as polyphenols may exert pharmacological activity within the cells, having the potential to modulate intracellular signaling pathways. Many polyphenols can induce antioxidant enzymes such as gluthathione peroxidase, catalase, superoxide dismutase, and inhibit the expression of enzymes such as xanthine oxidase, which is involved in the generation of free radicals [Alvarez-Suarez et al., 2011; Moskaug et al., 2005]. However, for many of them the molecular and cellular bases of these activities are not known yet.
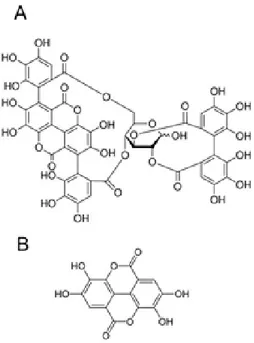
Besides, data from literature indicate that several phytochemicals can be found in pomegranate fruits and can be a valuable aid in counteracting oxidative stress and preventing some major diseases. Pomegranate extracts have important biological properties, including anti-atherosclerotic, antioxidant, anti-inflammatory and antigenotoxics, properties that can help in preventing the development of chronic and debilitating diseases such as cardiovascular illnesses, type 2 diabetes and cancer [Jurenka 2008; Adams et al., 2006]. These activities have been attributed to the high content of phenolic compounds [Turrini et al., 2015; Medjakovic et al., 2013]. The nutraceutical properties of pomegranate are not limited to the edible part of the fruit; in fact, non-edible fractions of fruit and tree (e.g., peel, flower, …) contain even higher amounts of biologically active components. The peel of the pomegranate is rich in ellagitannins, such punicalagin, punicalin, gallagic acid, ellagic acid and glycosides (Fig. 7) [Akhtar et al., 2015; Masci et al., 2016].
Figure 7. Chemical structure of punicalagin (A) and ellagic acid (B).
Punicalagin, a unique pomegranate compound of high molecular weight soluble in water, is the predominant ellagitannin. Punicalagin features important biological activities, including anti-inflammatory, hepatoprotective and anti-genotoxic activities. However, there are currently few studies on punicalagin biological efficacy [Seeram et al., 2006].
As above reported in Chapter 1, PDIA3 protein is a prominent member of the PDI family that has attracted a significant attention by the research community. It is also becoming increasingly evident that PDIA3 could be a pharmacological target in different pathological conditions, though the mechanisms in which it is involved are not completely understood. For this reason, my PhD project puts the spotlight on the PDIA3 involvement in disease processes, focusing on Alzheimer disease and platelet aggregation, and then characterizing its new features and roles in the development of the aforementioned diseases. At present, no selective compounds are known to modulate the PDIA3 biological functions. The discovery of specific PDIA3 interactors could be used in repressing or stimulating PDIA3 in biological model, thus providing useful information on PDIA3 functions.
2.1. Identification of specific natural PDIA3
interactors able to bind and modulate its activity
Polyphenol compounds display a wide range of biological effects, such as antioxidant, anti-inflammatory, antithrombotic, antiviral and antitumor activities [Vauzour et al., 2010]. They can act on different targets affecting regulation of a variety of pathways: cell signaling and cell cycle, free radical
scavenging, inhibition of angiogenesis, initiation of DNA repair mechanisms, apoptotic induction and inhibition of metastasis [Williams et al., 2004; Mandel et al., 2011; George et al., 2016]. However, for many of them the molecular and cellular bases of these activities are not known. PDIA3 is a multifunctional protein disulfide isomerase with a wide range of functions and involved in many biological processes such as cellular response to stress as well as in cancer and neurodegeneration [Hettinghouse et al., 2018]. In this regard, it is interesting to undertake a screening study for assessing the interaction and impact on PDIA3 protein activity of several types of natural compounds. The identification of specific ligands that can modulate and/or inhibit PDIA3 interaction with specific partners may be useful to selectively control cellular processes and signaling pathways involving PDIA3 and might offer new therapeutic tools.
This study, initially started in our lab by analyzing the major catechins present in the extracts of green tea [Trnkova et al., 2013], has been expanded to various classes of other natural compounds to assess their interaction and impact on PDIA3 protein activity. The binding of several polyphenols to PDIA3 were tested by fluorescence quenching assay. Their effects on the protein PDIA3 redox activity were also analyzed as well as their properties on a cellular model.
2.2. Assessment of PDIA3 involvement in platelet
aggregation
In the last two decades, many research groups have focused on the development of new anti-aggregatory drugs in order to reduce the side effects or other draw-backs of older drugs. In fact, ASA (acetylsalicylic acid) is still
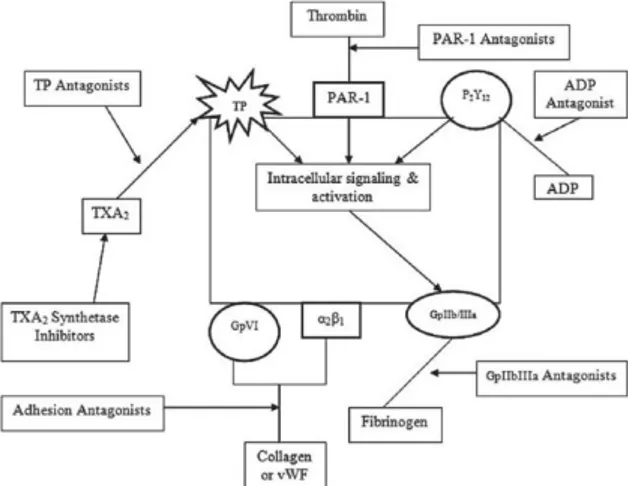
drugs is limited, the identification of new drug targets is of clinical interest. Previous study demonstrated that danshensu has anti-thrombotic properties inhibiting the activation of αIIbβ3 and blocking the PDIA3/αIIbβ3 complex on the platelet surface [Cui et al., 2015]. Published data support the PDIA3 role in platelet aggregation, though the intracellular mechanisms involved remain unclear. Several stimuli can trigger platelet aggregation, activating different intracellular pathways, as reported in Figure 8.
Figure 8. Schematic representation of different intracellular pathways involved in platelet aggregation.
It has been reported that PDIA3 can be released from platelets upon thrombin or collagen stimulation [Holbrook et al., 2010], demonstrating its possible involvement in their pathways. However, there are no evidences about the PDIA3 response via ADP or thromboxane A2 activation.
Hence, in my research, I used arachidonic acid and ADP as platelet activators, at different concentration, to investigate whether PDIA3 could be also involved in platelet aggregation through these ways.
2.3. PDIA3 expression is altered in the limbic brain
regions of triple-transgenic mouse model of
Alzheimer's disease
Evidences from the literature suggest that PDIA3 might have a role in AD pathogenesis [Erickson et al., 2005; Tohda et al., 2012], but its exact contribution is not clear. Therefore, we aimed to evaluate whether brain PDIA3 expression is altered in a triple transgenic model of AD (3×Tg-AD) in comparison with wild type littermates (Non-Tg). 3×Tg-AD mice, which harbor three mutant human genes [Oddo et al., 2003], mimic the critical aspects of AD-neuropathology observed in the human AD patients [Cassano et al., 2012; Romano et al., 2015; Scuderi et al., 2018]. Moreover, to investigate whether the temporal and regional patterns of such possible alterations might overlap with those of Aβ and tau pathology in this AD model, brain PDIA3 expression was analyzed at different ages [Oddo et al., 2003]. As a consequence, by studying the temporal expression of PDIA3 in the wild-type littermates, our study has also allowed us to analyze the impact of aging on PDIA3 levels. Our analyses were conducted on PDIA3 protein levels in 3×Tg-AD and Non-Tg mice at two different stages (mild and severe) of AD-like pathology. In particular, 6- and 18-month-old mice were analyzed by Dot-blot analysis and double-immunohistochemistry, followed by the semi-quantitative analysis of the respective signals. Amygdala,
3.1. Identification of specific natural PDIA3
interactors able to bind and modulate its activity
3.1.1. Chemicals
Punicalagin, ellagic acid, phosphate buffered saline (PBS), tris(2-carboxyethyl) phosphine (TCEP), dimethyl sulfoxide (DMSO), 4-(2-hydroxyethyl)-1-piperazineethanesulfonic acid (HEPES), dithiothreitol (DTT), oxidized glutathione (GSSG), eosin isothiocyanate, glutamine, sodium pyruvate, fetal bovine serum (FBS), penicillin and streptomycin and 19 different flavonoids (quercetin, 3-O-methyl-quercetin, isoquercetin, quercitrin, rutin, morin, rhamnetin, isorhamnetin, fisetin, apigenin, apigenin-7-glucoside, luteolin-apigenin-7-glucoside, kaempferol, eupatorin, eupatorin-5-methyl-ether, genistein, narigenin, cyanidin and 6,2’,4’-trimethoxyflavone were purchased from Sigma-Aldrich. EDTA (ethylenediaminetetraacetic acid) 0.5 M solution pH 8.0 was from IBI Scientific and sodium 3´- [1- (phenylaminocarbonyl)- 3,4- tetrazolium]-bis (4-methoxy- 6-nitro) benzene sulfonic acid hydrate (XTT) from Biotium. SYPRO Orange was from Invitrogen.
3.1.2. Protein expression and purification
Human recombinant PDIA3 was cloned and expressed in E. coli strain BL21 using the expression vector pET21 (Novagen) as previously described [Coppari et al., 2002]. The coding sequence for the second redox-active domain (a’ domain, residues 377-505) was amplified by PCR as previously described and cloned in the expression vector pET29 (Novagen) [Grillo et al., 2007]. Recombinant proteins were expressed in E. coli strain BL21 and purified by ammonium sulphate fractionation, ion exchange and heparin chromatography [Grillo et al., 2007; Grillo et al., 2006]. Protein purification was evaluated by SDS-PAGE and concentration was determined spectrophotometrically (PDIA3 Ɛ280 reduced form = 44,810 M-1cm-1, a’
domain Ɛ280 reduced form =14,400 M-1 cm-1).
3.1.3. Fluorescence Quenching Measurements
The PDIA3-ellagitannins/flavonoids interaction was evaluated by fluorimetric titration. Fluorescence spectra were recorded using a SPEX-FluoroMax spectrofluorimeter (Horiba Scientific) from 300 to 500 nm with excitation at 290 nm using a 10 mm path length quartz fluorescence cuvette and under continuous stirring. The excitation and emission slits were both set to 5 nm and scan speed was 120 nm·min-1. First, PDIA3 was reduced adding 2 mM TCEP to 50 μM PDIA3 stock solution. Then, aliquots of freshly reduced PDIA3 (0.5 μM or 0.1 μM final concentration) was diluted in PBS containing EDTA 0.2 mM and DTT 0.1 mM, and titrated in quartz cuvette by stepwise additions, at 5 min time intervals, of individual flavonoid solution (1 mM in PBS/ethanol 50:50 v/v freshly prepared from a 20 mM stock solution in DMSO) or of ellagitannins solution (punicalagin 0.2 mM in
flavonoids without protein) were recorded under the same experimental conditions and subtracted from the corresponding polyphenol-protein system to correct the fluorescence background. Fluorescence intensities recorded at 338 nm were used for quenching analysis and obtained data, as the average of at least three independent titration experiments.
3.1.4. Determination of Protein Disulfide Reductase
Activity
Disulfide reductase activity of PDIA3 was monitored by sensitive fluorescent assay using dieosin glutathione disulfide (DiE-GSSG) as fluorogenic probe. DiE-GSSG is synthesized by the reaction of eosin isothiocyanate with oxidized glutathione (GSSG) according to the method of Raturi and Mutus [Raturi and Mutus 2007] with some modifications [Trnkova et al., 2013]. DiE-GSSG purification was determined in HPLC and its concentration was calculated spectrophotometrically (Ɛ525=88,000 M-1 cm-1). Disulfide reductase activity was assayed in a reaction buffer containing 2
mM EDTA, 150 nM DiE-GSSG, 5 µM DTT and 1µM or 50 nM PDIA3 in PBS. The effect flavonoid (20 µM) and ellagitannins (0.2, 0.5, 2, 5 and 20 μ) effects were evaluated after 2 minutes incubation before the analysis. GSSG reduction was monitored for 3 minutes at 545 nm with excitation at 520 nm, at 25°C under continuous stirring. Reductase activity was calculated as the initial velocity in fluorescence increase. A better investigation on PDIA3
reductase activity was performed by DiE-GSSG titration (31nM to 1000 nM) in reaction buffer added with 20 nM final concentration of PDIA3 and DTT 5 μM. To assess the effect on the PDIA3 activity, before DiE-GSSG titration, PDIA3 20 nM was incubated with different concentrations of punicalagin (0.2, 0.5, 1, 2 and 5 μM) for 2 minutes. Values were fitted using the enzymatic kinetic equation on Graph Pad Prism 5.0 software (GraphPad Software, Inc.) to calculate Michaelis-Menten constant (Km) and maximum
velocity (Vmax) for PDIA3 and their modifications after punicalagin
treatment. Punicalagin inhibition constant (Ki) was determined using a
Lineweaver-Burk plot or a Dixon plot analysis on Graph Pad Prism 5.0 software.
3.1.5. Isothermal titration calorimetry (ITC)
The thermodynamic analysis of PDIA3-punicalagin interaction was obtained using the MicroCal ITC (Malvern Instruments Ltd.). PDIA3 was extensively dialyzed and punicalagin was dissolved in the same buffer. The sample cell (0.2 ml) was filled with PDIA3 (25 μM) and the syringe with punicalagin (250 μM solution). Ligand solution was then injected into the cell in 19 aliquots of 2 μL for 4 s (the first injection was 0.4 μL for 0.8 s) with delay intervals between injections of 180 s. Syringe stirring speed was set to 800 rpm. PDIA3-punicalagin interaction was analyzed in both non-reducing and non-reducing condition. In the latter, 1 mM TCEP was added to protein and ligand solutions to ensure protein reduction. To correct the heat of dilution, titration of punicalagin into a buffer without PDIA3 was carried out. The thermodynamic data were processed with Origin 7.0 software
(shPDIA3-SH-SY5Y) were obtained as follow. SH-SY5Y cells were cultured in 6-well plates and transfected with PDIA3 shRNA vector clone, obtained from the Mission shRNA library (Sigma), using Lipofectamine 2000 (Life Technologies) according to manufacturer’s instructions. Six hours after transfection, medium was replaced with fresh medium. After 48 hours 1μg/mL puromycin was added to the cells to select stable transfected cell clones. Both neuroblastoma cell lines were grown to 60-70% confluence in Dulbecco’s Modified Eagle’s Medium Mixture F-12 Ham (DMEM F12) (Sigma-Aldrich) with 10% FBS, 1% w/v sodium pyruvate, 2mM glutamine, 100 U/mL penicillin and 100 mg/mL streptomycin at 37°C in 5% CO2 (1 μg/mL puromycin was added to shPDIA3-SH-SY5Y).
3.1.7. Cell Viability
To assess the cytotoxic effects of H2O2 and punicalagin, SH-SY5Y and
shPDIA3-SH-SY5Y cells were seeded in 96-well plates and treated with different concentrations of H2O2 (0.05, 0.1, 0.2, 0.5, 1, 5 and 10 mM) or
punicalagin (1, 2, 5, 10 and 20 μM) for 24 hours. Cell viability was measured using the XTT assay (Biotium) in accordance to the manufacturer’s instructions. Briefly, the culture medium was removed and 125 μL/well of XTT solution was added to 96-well plates. After 3-6 hours incubation, the orange formazan dye, resulting from the conversion of the XTT yellow tetrazolium salt by metabolically active cells, was measured at 450 nm and
690 nm using Appliskan plate reader (Thermo Scientific). To assess H2O2
-punicalagin co-treatment effects on cell viability, SH-SY5Y and shPDIA3-SH-SY5Y cells were seeded in 96-well plates and pre-treated for 4 hours with 20 μM punicalagin followed by H2O2 treatment (0.1, 0.2 and 0.5 mM)
for 24 hours.
3.1.8. Cellular PDIA3 expression evaluated by Western
Blotting
Western blot analysis on cellular extracts was used to evaluate the effect of different H2O2 treatments on PDIA3 expression in SH-SY5Y cells and to
test PDIA3 silencing in shPDIA3-SHSY5Y cells. Cells were seeded in 6-well plates, subjected to different treatments and then lysated in RIPA Buffer. Extracted proteins were quantified by Bradford assay, resolved on SDS-PAGE in 10% TGX™ FastCast™ Acrylamide gels (BioRad), and then transferred to PVDF membranes (BioRad) using Trans-Blot® Turbo™ Transfer System (BioRad). Membranes were blocked with 1% w/v Bovine Serum Albumin (Sigma-Aldrich) in PBS. Membranes were incubated with anti-PDIA3 rabbit serum for 60 min, washed with TBST, and then incubated with peroxidase-conjugated anti-rabbit IgGs (Jackson ImmunoResearch) for an additional 60 min. After washing in TBST, the membranes were incubated with ECL substrates (Immunological Sciences) and the signal was detected by ChemiDoc™ Imaging Systems (BioRad). PDIA3 expression was analyzed using Image Lab™ Software (BioRad). Total proteins were used for normalization.
compare the obtained reductase activity data with the activity of the untreated protein and a p-value of < 0.01 was considered as statistically significant. Statistical comparisons were performed using ONE-WAY or TWO-WAY Analysis of Variance (ANOVA) and post hoc Bonferroni’s test, with different H2O2 concentrations and punicalagin treatments as variables, using
GraphPad Prism 5.0. The means of the data are presented with SEM. Statistical significance threshold was set to p < 0.05.
3.2. Assessment of PDIA3 involvement in platelet
aggregation
3.2.1. Chemicals
Lyophilized Arachidonic Acid (AA), ADP and prostaglandin E1 (PGE1) were purchased from Roche Diagnostics GmbH and solubilized in ultrapure water (vehicle). EDTA (ethylenediaminetetraacetic acid) 0.5 M solution pH 8.0 was purchased from IBI Scientific.
3.2.2. Platelets isolations and activation
Human blood was drawn from consenting, healthy, medication-free individuals in accordance with Czech Republic ethical procedures. Platelets were prepared on the day of experimentation. Blood was sampled in heparinized tube and centrifugated at 1500 rpm (200g) for 8-15 minutes in
centrifuge CS4. The platelet rich plasma (PRP) was transferred into a new plastic tube using a pipette with wide orifice and without disturbing the buffy coat layer, in order to avoid contamination. Saline solution was added at 1:1 ratio (v/v), including PGE1 (1 μM final concentration) to prevent platelet activation. The tube was mixed very gently and then, centrifugated at 1000 rpm (100g) for 15-20 min in centrifuge CS4 at room temperature (with no brake applied) to pellet contaminating red and white blood cells. The supernatant was transferred into new plastic tube using a pipette with wide orifice. Platelets were pelleted by centrifugation at 5400 rpm (800 g) for 15– 20 min at room temperature in centrifuge CS4. Platelet counts, by flow cytometry, were adjusted to the appropriate cell density by resuspension in saline (5*107 cell/ml). Platelet activation was induced by adding: AA (375,
150 and 50 µM final concentration), ADP (10, 5 and 2,5 µM final concentration), ultrapure water as vehicle (control) and PGE1 as negative control (1 mM final concentration). After 15 minutes platelet aggregation at 37°C, the activation was stopped by addition of EDTA-Na+ salt 1,45 mM final concentration. Platelets were centrifugated at 10000 rpm for 10 min. Stimulation of platelets using Arachidonic Acid, ADP was previous confirmed in Multiplate® Analyzer (Roche Diagnostics GmbH) with continuous stirring. Non-aggregatory conditions were detected by treating platelets with 1,45 mM EDTA-Na+ salt or with 1 mM PGE1.
3.2.3. PDIA3 Immunoblotting
Platelets were lysated in Lysis Buffer, vortexing and incubating on ice 15-30 min. After spin, pellets were resuspended, and proteins were precipitated with addition of 10% v/v trichloro acetic acid and centrifugated at 14000 rpm
incubated with anti-PDIA3 rabbit serum for 60 min, washed with TBST, and then incubated with peroxidase-conjugated anti-rabbit IgGs (Jackson ImmunoResearch) for an additional 60 min. After washing in TBST membranes were incubated with ECL substrates (Immunological Sciences) and the signal was detected by ChemiDoc™ Imaging Systems (BioRad). PDIA3 expression was analyzed using Image Lab™ Software (BioRad). Total proteins were used for normalization.
3.2.4. PDIA3 immunoprecipitation from surrounding
medium of aggregated platelets
Platelets (5*107 cells/ml) were stimulated using Arachidonic Acid, ADP
and stimulation was terminated as previously described. Cell-free supernatants containing platelet-released proteins were obtained by centrifugation at 14000 rpm for 20 min at room temperature. Collected supernatants were incubated with 8 µg of Anti-PDIA3 antibody (Ab) for 1-1,2 hours at room temperature (RT) in rotation. Ab/protein complexes were added into 1 mg of Protein G-Dynabeads (Life Technologies), previously cleaned 2 times with Washing Buffer PH 7.4, and then incubated 2 hours at RT in rotation. The tubes were placed on the magnet and the unbound part was recovered. The Dynabeads®-Ab-protein complexes were washed 3 times with Washing Buffer PH 7.4 and transferred in a cleaned tube during last wash, to avoid co-elution of proteins bound to the tube wall. The Ab-protein
complexes were eluted, on the magnet, adding 50 mM Glycine pH 2.8 and incubating for 10 minutes at RT. The Ab-protein complexes were recovered and added with sample buffer 4X and Tris 1M pH 7.4 to equilibrate the PH. Samples were heated for 10 min at 70°C. The recovered Ab-protein complexes were resolved on SDS-PAGE in 10% TGX™ FastCast™ Acrylamide gels (BioRad) and subjected to western blotting against PDIA3 as above reported for total platelet extracted proteins.
3.2.5. Statistical analysis
Statistical comparisons were performed using ONE-WAY Analysis of Variance (ANOVA), with different concentrations treatment as variables, using GraphPad Prism 5.0. The means of the data are presented with SEM. Statistical significance threshold was set to p < 0.05.
3.3. PDIA3 expression is altered in the limbic brain
regions of triple-transgenic mouse model of
Alzheimer's disease
3.3.1. Animals
6- and 18-month-old male 3×Tg-AD mice and their male wild-type littermates (Non-Tg) were used in this study. The 3×Tg-AD mice harboring PS1M146V, APPswe, and taup301L transgenes were genetically engineered by LaFerla and colleagues at the Department of Neurobiology and Behavior, University of California, Irvine. Colonies of 3×Tg-AD and Non-Tg mice were established at the vivarium of the Puglia and Basilicata Experimental
Directive 2010/63/EU. All efforts were made to minimize the number of animals used in the study and their suffering.
3.3.2. Protein isolation and Dot Blotting
After cerebral areas collection, tissues were lysated in Lysis Buffer and extracted proteins were quantified by Bradford assay. Directly, 5 µg of proteins were spotted on nitrocellulose membranes using a dot blot apparatus. Membranes were blocked with 1% w/v Bovine Serum Albumine in phosphate-buffered saline (PBS). Membranes were incubated with anti-PDIA3 rabbit (Millipore) for 60 min, washed with TBST and then incubated with anti-rabbit IgGs peroxidase-conjugated (Jackson ImmunoResearch), for an additional 60 min. After washing in TBST, membranes were developed by chemiluminescence with ECL substrates and the signal was detected by ChemiDoc™ Imaging Systems (BioRad). After stripping in glycine solution 0.1 M pH 3.0 for 15 min and neutralization with PBS, membranes were blocked with 1% w/v I-block in TBS for colorimetric detection. Then, membranes were incubated with anti-β-actin mouse (Sigma) for 60 min, washed in 1% w/v I-block and incubated with anti-rabbit IgGs alkaline phosphatase-conjugated (Jackson ImmunoResearch), for an additional 60 min. After washing in 1% w/v I-block in TBS solution, membranes were stained by colorimetric detection using alkaline phosphatase substrates (Quantace). The PDIA3 and β-actin protein expression was analyzed using
Image Lab™ Software (BioRad). The β-actin was used as house-keeping protein for normalization.
3.3.3. Double-fluorescence immunohistochemistry
Immunohistochemistry was performed using fluorescence-based revealing systems. For double fluorescence-based immunohistochemistry, 20-µm-thick brain coronal sections were obtained using a cryostat (Microm™ HM550, Thermo Fisher Scientific, MI, USA), and were mounted on positively charged microscope slides, which were stored at -20° C until further processed. The brain sections were incubated with 90% formic acid for 7 min followed by PBS washes. Then brain sections were blocked with a PBS solution containing 5% normal goat serum and 0.3% Triton X-100 followed by overnight incubation with purified anti-β-amyloid/APP 1-16 primary antibody (BioLegend®) and with PDIA3 rabbit polyclonal antiserum (Millipore) at 4°C. After removing primary antibodies, the slides were incubated with both secondary antibodies Alexa Fluor 594 goat anti-rabbit IgG and Alexa Fluor 488 goat anti-mouse IgG for 1.5 h at room temperature. After washing off excess secondary antibodies, the slides were incubated with Hoechst (Sigma). After washing excess Hoechst with PBS, the slides were mounted using an anti-fade medium (Fluoromount, Sigma-Aldrich). Furthermore, the specificity of the immunofluorescent staining for Aβ/APP and PDIA3 was confirmed on a separate set of slides by omitting the primary antibodies.
3.3.4. Triple-fluorescence immunohistochemistry
For triple fluorescence-based immunohistochemistry, each 20-µm-thick brain coronal section were mounted on a microscope slide and stored at ‒
0.3%. Thereafter, the slides were incubated for 16 h at 4°C with the primary antibodies: GFAP chicken polyclonal antibody (Abcam), NeuN mouse monoclonal antibody (Abcam) and PDIA3 rabbit polyclonal antiserum (Millipore). After washing off excess antibodies, sections were incubated with secondary antibodies: DyLight 350 goat anti-chicken, Alexa Fluor 488 goat anti-mouse IgG and Alexa Fluor 594 goat anti-rabbit IgG for 1.5 h at room temperature. After washing off excess secondary antibodies, the slides were mounted with the anti-fade medium. Even in this case, the specificity of the immunofluorescent staining for GFAP, NeuN and PDIA3 was confirmed by the omission of primary antibodies in another set of brain sections. Fluorescence-based immunolabeled slides were observed using a Nikon 80i Eclipse microscope equipped with a Qicam 12-bit Fast 1394 digital camera, and NIS-elements BR software (Nikon, Tokyo, Japan).
3.3.5. Statistical analysis
The correlation analysis between Aβ and PDIA3 protein levels was performed on the respective optical densities measured on double immunofluorescent slices and expressed as percentage of those measured in 6-month-old Non-Tg mice, by using the Pearson correlation test. The Aβ/APP and PDIA3 optical density values were analyzed by two-way ANOVA, with genotype (3×Tg-AD vs Non-Tg) and age (6 months of age vs 18 months of age) as between-subject factors. Tukey’s honestly significant
difference test was used for multiple post hoc comparisons, when required. Statistical significance threshold was set at p < 0.05.
4.1. Identification of specific natural PDIA3
interactors able to bind and modulate its activity
4.1.1. Study of the natural compounds-PDIA3 interaction
by fluorescence analysis
We started a screening analysis to find molecules which specifically bind PDIA3. Such substances could be useful to modulate the biological functions of PDIA3. In this study, the interaction of different flavonoids with PDIA3 and their effects on protein reductase activity were evaluated. Two polyphenols (i.e., punicalagin and ellagic acid) and a number of flavonoids (e.g., flavones, flavonols and several derivates), which differ in terms of skeleton structure as well as hydroxyl-, methoxyl- and other substituted groups, were analyzed (Fig. 6, 7).
The interaction was investigated by quenching analysis of PDIA3 intrinsic fluorescence mainly due to the presence of three tryptophan residues. They differ from each other in solvent or quencher accessibility and can unequally contribute to the protein fluorescence. One tryptophan residue (W279) is buried in a hydrophobic pocket in the b´ domain, whereas the others (W56
and W405) are present on the protein surface close to the thioredoxin-like active sites within a and a’ domains, respectively. Quenching analysis was performed on PDIA3, in the reduced form, by adding stepwise increasing concentration of each molecules and recording the protein fluorescence spectra. For some flavonoids the analysis was extended to isolate a’ domain (1 µM), always in the reduced form. Since all molecules can absorb light in the range of used excitation and emission wavelengths, in these experiments the highest final polyphenols concentration was kept stable to 10×10-6 M in order to limit their absorbance. Quenching effect on protein as well as Stern-Volmer quenching constants (KSV) were calculated from the fluorescence
intensities at 338 nm of protein alone (F0) and in the presence of increasing
concentration of each ligand molecule (F) using the Stern-Volmer equation [Lakowicz 2006]:
𝐹0
𝐹 = 1 + 𝐾𝑆𝑉[𝐿]
where L is the ligand concentration. For each ligand molecule, the Stern-Volmer quenching constant was obtained by linear regression of plots of 𝐹0
𝐹
⁄ versus [L].
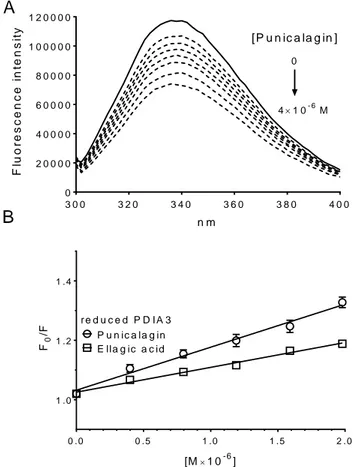
Representative fluorescence spectra of PDIA3 in the presence of increasing concentration of punicalagin are showed in Figure 9.
3 0 0 3 2 0 3 4 0 3 6 0 3 8 0 4 0 0 0 2 0 0 0 0 n m F lu B 0 . 0 0 . 5 1 . 0 1 . 5 2 . 0 1 . 0 1 . 2 1 . 4 P u n ic a la g in E lla g ic a c id r e d u c e d P D I A 3 [M1 0-6] F0 /F
Figure 9. Protein fluorescence quenching analysis of PDIA3 in the presence of punicalagin. Protein fluorescence quenching analysis of PDIA3 in the presence of punicalagin (A) Fluorescence quenching spectra of reduced PDIA3 alone (solid line) and after stepwise addition of punicalagin (A) (dotted line) (pH 7.4, 25°C, and λex = 290 nm,). (B)
Stern-Volmer plot of quenching data of reduced PDIA3 in the presence of increasing concentrations of punicalagin and ellagic acid. Data represent the mean of at least three independent experiments and error bars indicate SEM.
A different degree of quenching was observed in presence of tested molecules. The decrease of fluorescence may indicate that the microenvironments of tryptophan residues in PDIA3 were altered due to the interaction with tested compounds. No evident spectral shift was noticed in
fluorescence spectra of PDIA3 after the additions of all tested molecules, suggesting that these substances do not induce any evident change in protein conformation.
This interaction should involve regions of the protein near the two tryptophan residues, W56 and W405, more exposed to the solvent and close to the redox active sites.
The apparent binding constants (Kb) was calculated using the equation
described by Bi and colleagues [Bi et al., 2005]:
log (𝐹0− 𝐹
𝐹 ) = 𝑛 log 𝐾𝑏− 𝑛 log (
1
[𝐿𝑡] − 𝑛(𝐹0− 𝐹)[𝐿𝑡]/𝐹0
)
where F0 and F are the fluorescence intensities at 338 nm before and after the
addition of the quencher, [L] and [Pt] are the ligand and the total protein
concentrations, respectively. The number of binding sites (n) and the binding constant (Kb) were obtained by plotting log ((F0 – F)/F) versus log(1/([Lt]-n
(F0 – F)[Pt]/F0)) using the reiterative calculation process described by Sun et
al. [42], assuming a similar affinity for each binding site. The dissociation constant was calculated from the binding constant (Kd = 1/Kb).
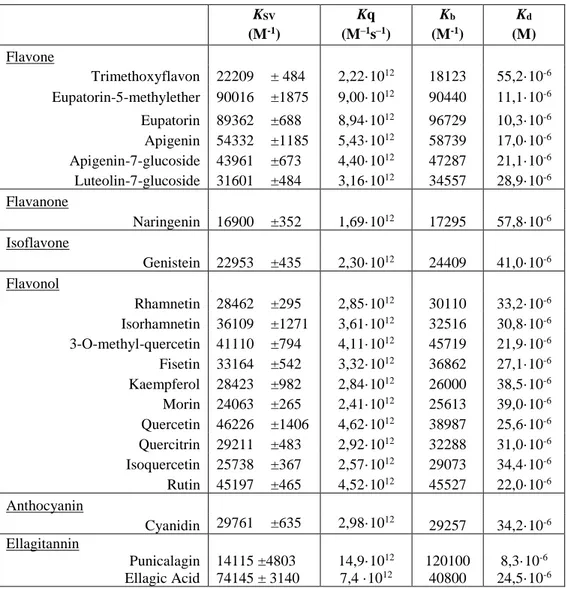
The estimated KSV, Kb and Kd values that characterize the interaction of
Flavanone Naringenin 16900 ±352 1,69·1012 17295 57,8·10-6 Isoflavone Genistein 22953 ±435 2,30·1012 24409 41,0·10-6 Flavonol Rhamnetin 28462 ±295 2,85·1012 30110 33,2·10-6 Isorhamnetin 36109 ±1271 3,61·1012 32516 30,8·10-6 3-O-methyl-quercetin 41110 ±794 4,11·1012 45719 21,9·10-6 Fisetin 33164 ±542 3,32·1012 36862 27,1·10-6 Kaempferol 28423 ±982 2,84·1012 26000 38,5·10-6 Morin 24063 ±265 2,41·1012 25613 39,0·10-6 Quercetin 46226 ±1406 4,62·1012 38987 25,6·10-6 Quercitrin 29211 ±483 2,92·1012 32288 31,0·10-6 Isoquercetin 25738 ±367 2,57·1012 29073 34,4·10-6 Rutin 45197 ±465 4,52·1012 45527 22,0·10-6 Anthocyanin Cyanidin 29761 ±635 2,98·1012 29257 34,2·10-6 Ellagitannin Punicalagin Ellagic Acid 14115 ±4803 74145 ± 3140 14,9·1012 7,4 ·1012 120100 40800 8,3·10-6 24,5·10-6
Table 1. The estimated KSV, Kb and Kd values of the interaction of PDIA3 with tested
compounds. Data were calculated from fluorescence quenching analysis using 0.5 or 0.1*10 -6 M PDIA3 in reduced conditions (pH 7.4, 25°C) and increasing concentration (0 to 10*10-6
M) of different molecules. KSV are reported as mean and standard deviation of at least three
independent experiments. The number of binding sites (n), the binding constant (Kb) and the
dissociation constant (Kd) were estimated using the equation described by Bi et al. [Bi et al.,
2005] and the reiterative calculation process described by Sun et al. [Sun et al., 2010].
Although the protein can bind most of the tested substances, with an estimated dissociation constant within the 10-5 M range, some of them
showed a better affinity. Molecules characterized by the highest binding constants are punicalagin and ellagic acid with a Kd around 1.0x10⁻⁶ M. For
some flavonoids, the binding analysis was extended to the isolated a’ domain. Similar values for the binding constants were estimated, with some flavonoids showing a slightly better affinity for the whole protein respect to the isolated domain (data not shown).
4.1.2. Effect of natural compounds on the PDIA3 redox
activity
To verify whether the interaction between flavonoids and PDIA3 may have an effect on protein functions, the disulfide reductase activity was tested using DiE-GSSG as fluoregenic substrate. For most of the molecules analyzed the effect on the redox activity of the protein was negligible. However, some molecules, in particular punicalagin but also the flavones eupatorin and eupatorin-5-methyl ether, showed an evident inhibitory effect. Others, such as morin, quercetin and cyanidin, had a less marked inhibition, approximately 20 (Fig. 10). Tri me tho xyfl avo n Eu pa t-5 -M eth yle the r Eu pa tori n Ap ige nin Ap ige nin -7-G luc osid e Lute olin -7-G luc osid e Na rin gen in Ge nis tein Rh am neti n Iso rha mn etin 3-O -M eth yl-Q ue rce tin Fis etin Ka em pfe rol Mo rin Qu erc etin Qu erc itrin Iso qu erc etin Ru tin Cy an idin Ella gic ac id Pu nic ala gin Co ntr ol 0 2 0 4 0 6 0 8 0 1 0 0 * * * * * * * % R e s id u a l P r o te in A c ti v it y * * *
Figure 10. Comparison of polyphenols effect (at 20 μM) on PDIA3 reductase activity. Plots are displayed as mean and standard deviations of at least six independent measurements.
investigate this interaction. PDIA3 redox activity was tested in presence of different punicalagin concentrations and results were analyzed as logarithmic dose-response obtaining a half maximal inhibitory concentration (IC50) of about 1×10⁻⁶ M (Fig. 11). - 7 - 6 - 5 0 5 0 1 0 0 lo g [ p u n ic a la g in ] ( M ) % in h ib it io n
Figure 11. Logarithmic dose-response curve for punicalagin. Reductase activity of PDIA3 was recorded in the presence of increasing concentration of punicalagin and DiE-GSSG as substrate. Activity was calculated as the fluorescence increase of DiE-DiE-GSSG after enzymatic reduction at a fixed time. Percentage of inhibition was referred to PDIA3 reductase activity in absence of punicalagin. Data represent the mean of at least three independent measurements and error bars indicate SEM. [PDIA3] = 50×10-9 M,
[DiE-GSSG] = 200×10-9 M, [punicalagin] = 0.2×10⁻⁶ M to 20×10-6 M.
Better characterization of punicalagin profile as PDIA3 inhibitor was performed changing both substrate and punicalagin concentrations. Data were analyzed using Lineweaver-Burk or Dixon plots (Fig. 12): it seems that punicalagin acts mainly as non-competitive inhibitor with a Ki of 0.39×10⁻⁶
Figure 12. Kinetic analysis of punicalagin. Lineweaver-Burk (A) and Dixon (B) plots were obtained analyzing the PDIA3 reductase activity in the presence of increasing concentration of substrate (DiE-GSSG) and punicalagin as inhibitor. PDIA3 activity was measured as the initial velocity recording the fluorescence increase that result from DiE-GSSG reduction. Data represent the mean of at least three independent measurements and error bars indicate SEM. [PDIA3] = 20×10-9 M, [DiE-GSSG] = 62×10-9 M to 1000×10-9
M, [punicalagin] = 0 to 5×10⁻⁶ M.
On the basis of our data punicalagin-PDIA3 interaction should involve regions of the protein near the two tryptophan residues, W56 and W405, more exposed to the solvent and close to the active sites. Punicalagin does not seem to be affecting the binding of DiE-GSSG as substrate behaving mainly as non-competitive inhibitor. More probably punicalagin affects the conformational changes of cysteine residues at the active site that are required for the enzymatic activity.
homology between the two isoforms [Klappa et al., 1998; Pirneskoski et al., 2001]. Then, we decided to compare the punicalagin effects on redox activity of PDIA1 and PDIA3 proteins. First, human recombinant PDIA1 was cloned and expressed in E. coli strain DH5α using the expression vector PET23-b (kindly donated by Professor Ruddock L. from Oulu University, Finland). Recombinant protein was expressed in E. coli strain BL21 and purified by nickel chromatography due to the presence of terminal His-Tag. Protein purification was evaluated by SDS-PAGE and concentration was determined spectrophotometrically (PDIA1 Ɛ280 reduced form = 45,567 M-1cm-1). The
disulfide reductase activity of PDIA1 was monitored in the same experimental conditions, as reported above for PDIA3. Obtained data, reported in Figure 13, demonstrated that the PDIA3 redox activity respect to PDIA1, was already inhibited at low concentrations of punicalagin. Then, these preliminary data confirm that punicalagin is more specific for PDIA3, but other experiments must be performed to provide further evidence that confirm our hypothesis.