Appendix B
Chi-Square distribution
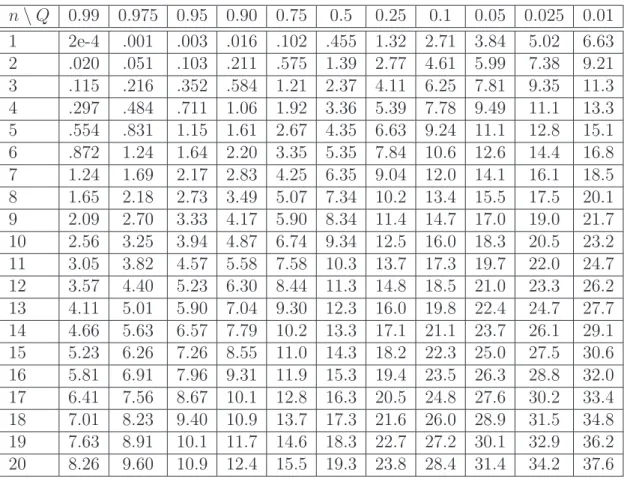
In this appendix the χ2
distribution is introduced, for more details see [6]. TableB presents the points x on the chi-square distribution for a given upper tail probability
Q = P {y > x} (B.1) where
y ∽ χ2
(B.2) and n is the number of degrees of freedom (df). This tabulated function is also known as the complementary distribution. An alternative way of writing (B.1) is
x(1 − Q) , χ2
(1 − Q) (B.3) which indicates that to the left of the point x the probability mass is 1 − Q.
Figure B.1: χ2
distribution.
Appendix B. Chi-Square distribution n \ Q 0.99 0.975 0.95 0.90 0.75 0.5 0.25 0.1 0.05 0.025 0.01 1 2e-4 .001 .003 .016 .102 .455 1.32 2.71 3.84 5.02 6.63 2 .020 .051 .103 .211 .575 1.39 2.77 4.61 5.99 7.38 9.21 3 .115 .216 .352 .584 1.21 2.37 4.11 6.25 7.81 9.35 11.3 4 .297 .484 .711 1.06 1.92 3.36 5.39 7.78 9.49 11.1 13.3 5 .554 .831 1.15 1.61 2.67 4.35 6.63 9.24 11.1 12.8 15.1 6 .872 1.24 1.64 2.20 3.35 5.35 7.84 10.6 12.6 14.4 16.8 7 1.24 1.69 2.17 2.83 4.25 6.35 9.04 12.0 14.1 16.1 18.5 8 1.65 2.18 2.73 3.49 5.07 7.34 10.2 13.4 15.5 17.5 20.1 9 2.09 2.70 3.33 4.17 5.90 8.34 11.4 14.7 17.0 19.0 21.7 10 2.56 3.25 3.94 4.87 6.74 9.34 12.5 16.0 18.3 20.5 23.2 11 3.05 3.82 4.57 5.58 7.58 10.3 13.7 17.3 19.7 22.0 24.7 12 3.57 4.40 5.23 6.30 8.44 11.3 14.8 18.5 21.0 23.3 26.2 13 4.11 5.01 5.90 7.04 9.30 12.3 16.0 19.8 22.4 24.7 27.7 14 4.66 5.63 6.57 7.79 10.2 13.3 17.1 21.1 23.7 26.1 29.1 15 5.23 6.26 7.26 8.55 11.0 14.3 18.2 22.3 25.0 27.5 30.6 16 5.81 6.91 7.96 9.31 11.9 15.3 19.4 23.5 26.3 28.8 32.0 17 6.41 7.56 8.67 10.1 12.8 16.3 20.5 24.8 27.6 30.2 33.4 18 7.01 8.23 9.40 10.9 13.7 17.3 21.6 26.0 28.9 31.5 34.8 19 7.63 8.91 10.1 11.7 14.6 18.3 22.7 27.2 30.1 32.9 36.2 20 8.26 9.60 10.9 12.4 15.5 19.3 23.8 28.4 31.4 34.2 37.6
Table B.1: Table of critical values of χ2
distribution.