UNIVERSITA’ DEGLI STUDI DI PISA
XXIV CICLO DELLA
SCUOLA DI DOTTORATO IN
SCIENZE BIOLOGICHE E MOLECOLARI
CARM1 AS A POTENTIAL TARGET FOR
INDUCING DIFFERENTIATION IN
NEUROBLASTOMA
DOTTORANDA RESPONSABILE
VALENTINA CANELLA DOTTORATO DI RICERCA Prof. Andrea Cavallini Università degli Studi di Pisa
TUTOR RELATORE
Prof. GIUSEPPINA BARSACCHI Prof. ALESSANDRO QUATTRONE Università degli Studi di Pisa Università degli Studi di Trento
TABLE OF CONTENTS
Abstract __________________________________________________________________ 4
Chapter 1 INTRODUCTION: NEUROBLASTOMA _______________________________ 5 Section 1.1 Biology of Neuroblastoma ____________________________________________ 6 Section 1.2 Prognostic considerations ____________________________________________ 9 Section 1.3 Genetic and Biological markers _______________________________________ 11 Section 1.4 Differentiation Therapy ___________________________________________ 14
Chapter 2 PROTEIN ARGININE METHYLATION and CARM1 ACTIVITY _________ 15 Section 2.1 Protein Arginine Methylation ________________________________________ 16 Section 2.2 CARM1: Structure and Function ______________________________________ 19 Section 2.3 Hu Proteins Methylation by CARM1 and Neuronal Differentiation ___________ 20
AIM OF THE PROJECT ____________________________________________________ 22
Chapter 3 MATERIALS AND METHODS _______________________________________ 23 Section 3.1 Materials ________________________________________________________ 24 In vitro Models: Human Neuroblastoma Cell Lines _________________________________ 24
Section 3.2 Methods _________________________________________________________ 26 Subsection 3.2.1. Stable transfection Assay for silencing CARM1 gene _________________ 26 Subsection 3.2.2. Protein Extraction _____________________________________________ 26 Subsection 3.2.3.Western Blot _________________________________________________ 27 Subsection 3.2.4. Operetta Assay _______________________________________________ 27 Subsection 3.2.5. Total RNA Extraction __________________________________________ 30 Subsection 3.2.6. Microarray Analysis ___________________________________________ 30 RNA target preparation/Agilent Microarray analysis _________________________ 30 DEGs Functional Analysis ______________________________________________ 36
Subsection 3.2.8. Immunofluorescence Assay______________________________________ 38 Subsection 3.2.9. Plasmid Construction and Putification _____________________________ 38 Subsection 3.2.10. Transient Transfection Assay of pHIS-HA-HuD plasmid and His-Tag
isolation ___________________________________________________________________ 40 Subsection 3.2.11.Transient Transfection Assay to over express HuD w/t and HuD mutants _ 40
Chapter 4 RESULTS and DISCUSSION _________________________________________ 42 Section 4.1 CARM1 silencing promotes morphological differentiation of MYCN-amplified Neuroblastoma cells ________________________________________________________ 43 Section 4.2 CARM1-silenced Neuroblastoma cells show increasesd neuronal lineage
markers and decreased neural crest cell markers __________________________________ 47 Section 4.3 Transcriptome profile of CARM1-silenced neuroblastoma cells ___ 57
Section 4.4 MYCN-amplified neurblastoma cell lines express high levels of HuB and HuD mRNAs compared to humann fetal neural crest cells __________________________ 66 Section 4.5 Covariance of CARM1 and nELAV proteins in neuroblastoma cell lines _____ 70
Chapter 5 CONCLUSIONS____________________________________________________ 76 BIBLIOGRAPHY ___________________________________________________________ 79 Supplementary Data _________________________________________________________ 89
Abstract
Neuroblastoma is the most common extra cranial solid tumor of childhood, originating from the neural crest progenitors primed for sympathoadrenal differentiation. Phenotypically, as well as clinically, the tumor shows a considerable and variable heterogeneity. Several genetic aberrations have been found to correlate with poor clinical outcome in neuroblastoma, the most important of which is the amplification of the MYCN locus that occurs in roughly 20% of primary tumors and is strongly correlated with advanced stage disease and treatment failure. Another feature related to patient survival is the degree of tumor cell differentiation, which ranges from small, undifferentiated cells in aggressive tumors to well differentiated non-dividing cells in tumors, which are considered benign. These evidences suggest that neuroblastoma could originate from an impaired capacity of the neural crest cells already committed to the sympathoadrenal final phenotype to respond to signals or to lack signals operating during this differentiation program. Therefore, molecular modulators able to force differentiation may be effective in the treatment of this pathology. Arginine methylation has been shown to regulate differentiation of a well-known number of cell lineages. In particular, it has been demonstrated that the coactivator-associated arginine methyltransferase 1 (CARM1) can negatively regulate the process of neuronal differentiation by methylating the RNA-binding protein HuD, a known determinant of the neuronal phenotype.
Our data demonstrate that CARM1 stable silencing produces a significant neurite extension and branching in SK-N-BE(2) neuroblastoma cells. This morphological evidence has been confirmed at the molecular level by a microarray analysis, adding further clues. Although not demonstrated yet, we can speculate that CARM1 effects are due at least partially to changes in HuD methylation level that in turn modulates its mRNA target binding capability and reduces the differentiative potential of neuroblastoma cells. Indeed, we demonstrated that protein levels of CARM1 and HuC and HuD proteins remarkably covary in a panel of 17 neuroblastoma cell lines, suggesting that an increase in CARM1 expression could be effectively an HuD neutralizing event with respect to differentiation of neuroblastoma cells. Furthermore, HuD interaction with CARM1 was verified through a pull-down assay.
If our hypothesis will be verified, we could speculate that CARM1, acting on HuD methylation, can interfere in further differentiation of neuroblastoma cells. Thus, CARM1 could be considered, and then employed, as a potential druggable target in neuroblastoma therapy.
Chapter 1
Introduction:
Neuroblastoma
1.1 Biology of neuroblastoma
Neuroblastoma, a tumor originating from primitive cells of the sympathetic nervous system, is the most common extra cranial solid tumor of childhood, with an annual incidence of about 1.500 cases in Europe and 700 cases in US and Canada per year, representing about 30% of all cancers diagnosed in European and US infants. The median age at the moment of diagnosis is approximately 18 months, with over 1/3 diagnosed at less than 1 year of age (Brodeur, 2003). Neuroblastoma arises from the neural crest cells of the sympathetic nervous system (Fig. 1.1A and Fig. 1.1B), an embryonic cell population originating in the ectoderm at the margins of the neural tube that, after a phase of epithelial-to-mesenchymal transition (EMT), starts its migration to generate the craniofacial cartilage and bone, the smooth muscle cells of the cardiovascular system, and the majority of the peripheral nervous system, such as the peripheral and enteric neurons, the adrenal chromaffin cells and the peripheral glia, plus other non-neural cell types, such as the melanocytes (Sauka-Spengler & Bronner-Fraser, 2008). As a consequence, neuroblastoma can develop anywhere in the sympathetic nervous system.
Around 65% of primary neuroblastoma tumors are found in the abdomen, whereas other common sites of disease are the neck, the chest and the pelvis. Due to the heterogeneity of the tumor and the different sites of localization, the symptoms are vague (fatigue, loss of appetite, fever and joint pain are highly common) and very variable, depending on the site of the primary tumor and the presence or absence of metastasis, usually in the distant lymph nodes, bone marrow, bone, liver, or other organs (Pizzo P. A., Poplack D. G. editors. 5th ed. Philadelphia, PA), resulting difficult to be diagnosed at an early stage. In this context, neuroblastoma is listed in the larger group of neuroblastic tumors, which are heterogeneous in terms of biological, genetic and morphological characteristics. They have three unique alternative phenotypic behaviors: they can spontaneously regress, they can mature or they can aggressively proliferate. The evidence of a naturally occurring programmed cell death fate supports spontaneous regression during normal embryonic life, especially in the development of the central and peripheral nervous system. This process is referred as “involution” (SHIMADA et al., 1999), it was described early in the last century and later defined as the clinical entity of Stage 4S (Special) disease from the International Neuroblastoma Staging System (INSS, G. M. Brodeur et al., 1994). Spontaneous regression has not yet been fully understood, but evidences suggest that specific genetic traits, such an intact short arm of chromosome 1 and the absence of MYCN gene amplification, support this condition. Despite most neuroblastomas appear as undifferentiated tumors, consisting of small, round cells with little or any evidence of neural differentiation (probably because of their derivation from the sympathoadrenal progenitors), some types of neuroblastoma show a partial histological differentiation and are called ganglioneuroblastomas.
of mature neurons surrounded by Schwann cells. Unfortunately, the majority of neuroblastomas at the time of diagnosis present an advanced stage of disease, and they do not undergo regression or maturation (Stages 3 or 4 of the INSS). Moreover, it is well established a correlation between tumor aggressive proliferation and the presence of MYCN gene amplification, as well as deletion of 1p and 11p and gain of 17q (see 1.3; Perez et al., 2000, Spitz et al., 2002, Bown, 1999).
Ne u ral cr est d ev elo p m en t d u rin g th e p ro ce ss o f n eu ru latio n . Af ter in d u ctio n in th e reg io n o f th e n eu ral p late b o rd er , n eu ral tu b e cl o ses an d n eu ral cr est ro m th e reg io n b etwe en th e d o rs al n eu ral tu b e, o v er ly in g th e ec to d er m a n d m ig ratin g to war d s th e p er ip h er y . .Af ter n eu ru latio n , n eu ral cr est ce lls m ig rate an d d if fer en tiate in to m u ltip le ce ll ty p es lik e p er ip h er al n eu ro n s, ad ip o cy tes, s m o o th m u scle ce lls an d Sch wan n ce lls .
1.2 Prognostic considerations
The two most important clinical variables in predicting patient outcome are the age of patient at the moment of diagnosis and the stage of the disease.
The role of age in neuroblastoma risk stratification is fundamental: it has been analyzed as a binary variable, with 18 months used as the age cut point in most risk stratification matrices. Although the reason is not still clear, children younger than 18 months of age have higher chances for a favorable outcome, even in tumors with MYCN amplification. Metastatic neuroblastoma in children older than 18 months at diagnosis is lethal for most patients despite aggressive multimodality therapy (Fig.1.2; Modak & Cheung, 2010).
Fig.1.2. Overall survival for children with MYCN-non-amplified stage 4 neuroblastoma (Modak & Cheung, 2010).
In 1989 the International Neuroblastoma Staging System (INSS) was established and it is currently used to stage neuroblastoma patients (Brodeur et al., 1994). This system ranks patients in six stages depending on the localization of the tumor and its state of progression (Fig.1.3). Stage 1 gathers patients with localized tumor that can be removed completely by surgery. In Stages 2A and 2B patients bear tumors that are confined but cannot be completely removed through surgery.
Children with tumors in the middle of the chest or abdomen or that are spread to both left and right sides of the body are grouped in Stage 3.
In Stage 4 patients, the primary tumor has spread to distant lymph nodes, bone, bone marrow, liver, skin, and/or other organs.
Patients in stage 4S are less than 12 months of age and carry a localized primary tumor that has spread only to the skin, liver, or bone marrow. These tumors (about 5% of cases), as previously said, often undergo spontaneous regression or differentiation (i.e. into a ganglioneuroma) without any treatment (Maris et al., 2007).
Fig.1.3. International Neuroblastoma Staging System (INSS) allows classification of neuroblastoma depending on the localization of the tumor at the moment of diagnosis (i =liver; ii = bone marrow; iii = bone; iv = lymph nodes; v = skin). (Modified hand drawing, by C. P. Reynolds MD PhD, University of Southern California).
1.3
Genetic and biological markers
In the last decade many genetic features of neuroblastoma have been found to correlate with clinical outcome, for example ploidy status, oncogene amplification and allelic loss. These biological markers have been evaluated to determine their value in assigning prognosis, and some of these have been incorporated into the strategies used for risk assignment.
The genetic aberration most consistently associated with poor outcome in neuroblastoma is MYCN amplification, which is defined as ≥ 10 copies per diploid genome. Genetic amplification of MYCN is never manifested at the 2p23-24 resident site of the gene itself, but is found in homogeneously staining regions (HSRs) on other chromosomes, or in extra-chromosomal double-minute chromatin bodies (DMs). This gene is amplified in approximately 25% of de novo cases and is more common in patients with advanced-stage disease. Patients whose tumors have MYCN amplification tend to have rapid tumor progression and a poor prognosis, even in the setting of other favorable factors such as low-stage disease or 4S disease (Perez et al., 2000). The reason why MYCN amplification is associated with a more aggressive phenotype is still uncertain.
Deletions of the short arm of chromosome 1 lead to loss of heterozygosity (LOH) and can be identified in 25–35% of neuroblastomas. The gene or genes within chromosome 1p involved in the pathogenesis of neuroblastoma have not been identified, despite intensive investigation. Whether the loss of heterozygosity due to deletion of alleles from 1p is an independent indicator of prognosis remains controversial. However, clear evidence suggests that allelic loss at 1p36 predicts an increased risk of relapse in patients with localized tumors (Spitz et al.; 2002).
Both MYCN amplification and deletion of chromosome 1p are strongly correlated with a poor outcome and with each other, therefore it is controversial whether they are independent prognostic variables (White et al., 2005). Nevertheless, they seem to characterize a genetically distinct subset of highly aggressive neuroblastomas. Most cases with MYCN amplification also have 1p loss but not all cases with 1p loss have MYCN amplification, indicating that 1p deletion might precede the development of amplification. Indeed, it might be necessary to delete a gene that regulates MYCN expression, or one that mediates programmed cell death in the presence of high MYCN gene expression, for amplification to occur. Alternatively, there might be an underlying genetic abnormality that leads to genomic instability that predisposes to both 1p loss and MYCN amplification (Brodeur, 2003).
Allelic loss of long arm of chromosome 11 (11q) is present in 35–45% of primary tumors (Spitz et al., 2002). This genomic aberration is inversely correlated with 1p deletion and MYCN amplification. Interestingly, 11q loss is associated with decreased event-free survival, but only in
patients lacking MYCN amplification. When the two abnormalities occur together, the prognostic impact of MYCN amplification is dominant, nevertheless loss of 11q might prove to be a useful predictor of outcome in clinically high-risk patients without MYCN amplification (Brodeur, 2003).
The other specific karyotypic abnormality that has been detected so far is trisomy of the long arm of chromosome 17 (17q). Allelotyping, CGH and array-CGH studies have indicated that this abnormality might occur in more than half of all neuroblastomas. Although unbalanced gain of 17q can occur independently, it frequently takes place through balanced translocation with chromosome 1 or 11 (Bown, 1999). The 17q breakpoints vary, but gain of a region 17q22-qter suggests that a dosage effect of one or more genes provides a selective advantage (Schleiermacher et al., 2004). The gene (or genes) responsible for the selective advantage is unknown, but overexpression of survivin — a member of the IAPs (inhibitor of apoptosis proteins) — has been proposed (Islam et al.; 2000). Gain of 17q is associated with more aggressive neuroblastomas, although its prognostic significance relative to other genetic and biological markers awaits a large prospective trial and multivariate analysis.
DNA index is another useful marker that correlates with response to therapy for patients younger than 2 years who have disseminated disease (Bagatell et al., 2005). The DNA content of neuroblastomas falls into two broad categories: near diploid or hyperdiploid (often near triploid). It was demonstrated that infants whose neuroblastoma have hyperdiploidy (DNA index >1) have a good therapeutic response to cyclophosphamide and doxorubicin (Look et al., 1991). In contrast, infants whose tumors have a DNA index of about 1 are less responsive to the latter combination and require more aggressive therapy. Genetic models of neuroblastoma suggest that less aggressive tumors have a fundamental defect in mitosis associated with whole chromosome gains and losses, which could explain why near-triploidy seems to be favorable. Conversely, more malignant neuroblastomas have a fundamental defect in genomic stability, resulting in the so-called segmental aberration genotype, composed of chromosomal rearrangements, unbalanced translocations, and maintenance of a near-diploid DNA content (Maris et al., 2007).
To summarize, the accumulated research on the genetics of neuroblastoma indicates that there are at least two genetic subsets of neuroblastoma that are highly predictive of clinical behavior. The classification takes into account abnormalities of 1p, MYCN copy number and DNA content. The first subset is characterized by mitotic dysfunction, which leads to hyperdiploid or near-triploid modal karyotype. These tumors lack MYCN amplification, 1p loss or 17q gain. The patients are generally less than 1 year of age with localized disease and a very good prognosis.
The second type is characterized by gross chromosomal aberrations and a near-diploid karyotype. Within this type, two subsets can be distinguished. One is characterized by 11q deletion and lack of both MYCN amplification and 1p loss. Patients are usually older, with more advanced stages of disease that is slowly progressive and often fatal. The other subset, more aggressive, has MYCN amplification and 1p loss. These patients are generally between 1 and 5 years of age, with advanced-stage, rapidly progressive disease that is frequently fatal (Brodeur, 2003).
In 2009 the International Neuroblastoma Risk Group (INRG) task force proposed a new pre-treatment classification system that takes into account biological markers such as MYCN amplification, DNA index, and chromosome 11q status in addition to age and stage (Modak & Cheung, 2010).
1.4
Neuroblastoma treatments and differentiation therapy
Different treatments can be applied on children with neuroblastoma, according to the risk-group assigned to the tumor.
Surgery is commonly used to remove the tumor as well as any lymph nodes nearby the tumor. If tumor is localized and has not spread to other parts of the body, surgery represents the only treatment needed.
If tumor has spread, the combination with other treatments, such as chemotherapy, radiation therapy, bone marrow transplantation, immunotherapy and differentiating agents is required (Wagner & Danks, 2009).
The use of neural differentiation-inducing agents appears to be an attractive treatment for neuroblastoma pathology. As described previously, this tumor has embryonic features, presumably as a consequence of misregulated differentiation programs during the development of the sympathoadrenal lineage of nervous system. Therefore, molecular modulators able to induce differentiation can be effective in the treatment of this malignancy.
Several agents have been reported to induce differentiation in neuroblastoma cell line models, including 12-O-TetradecanoylPhorbol-13-Acetate (TPA) and Herbimycin A. However, the best characterized differentiation inducers for neuroblastoma are represented by retinoids (Seeger & Haussler, 1983). Retinoids, which are vitamin A derivatives, have been shown to be fundamental in nervous system development and maintenance (Ross et al., 2000). In vitro, retinoids induce differentiation and growth arrest of malignant neuroblastoma cells probably through binding to retinoid acid receptors (Thiele, 1998). Intracellular retinol is metabolized to all-trans retinoic acids, which then activates a number of nuclear receptors that heterodimerize and regulate gene transcription. In addition, it has been shown that all-trans retinoic acid promotes the neuronal phenotype in neuroblastoma cells, inducing neurite outgrowth and a reduction of cell proliferation (Christie et al., 2008).
Consistent with these findings, the results of independent trials have demonstrated that the administration of retinoic acid significantly improves the overall survival rates after bone-marrow transplantation.
However, approximately 50% of patients develop resistance or are unresponsive to differentiation therapy (Marrow, 1999). For this reason, a particular attention is actually given to the investigation of new molecules that are able to induce differentiation of neuroblastoma cells, in combination with, or alternative to, the use of retinoids.
Chapter 2
Introduction:
Protein Arginine Methylation and
2.1
Protein arginine methylation
The primary sequence of a protein is determined by the coding sequence present in the corresponding gene, but its functional diversity is then extended by several posttranslational modifications, such as phosphorylation, acetylation, glycosylation, methylation and ubiquitylation. These covalent modifications modulate the activity of most eukaryotic proteins, influencing almost all the aspects of normal cell biology and pathogenesis (Berger, 2002). Although phosphorylation has been the most widely studied posttranslational modification, recent studies have indicated an emerging and central role of protein methylation in different cellular processes, including gene transcription, RNA metabolism, signal transduction and neuronal differentiation (Cimato et al., 1997; Aletta et al., 1998; Gary & Clarke, 1998).
Arginine methylation is a common posttranslational modification of mainly nuclear proteins in eukaryotic cells, and the recent discovery of the enzyme family of the protein arginine methyltransferases (PRMTs) have made in this process PRMTs of particular interest.
PRMTs catalyze the addition of one or two methyl groups from the S-adenosylmethionine (AdoMet) to arginine residues, generating three possible products (Fig. 2.1):
- Monomethylarginine
- NG, NG-dimethylarginine, in which both methyl groups are on the same nitrogen (aDMA, asymmetric dimethylarginine).
- NG, N'G-dimethylarginine, in which each nitrogen atom receives one methyl group (sDMA, symmetric dimethylarginine).
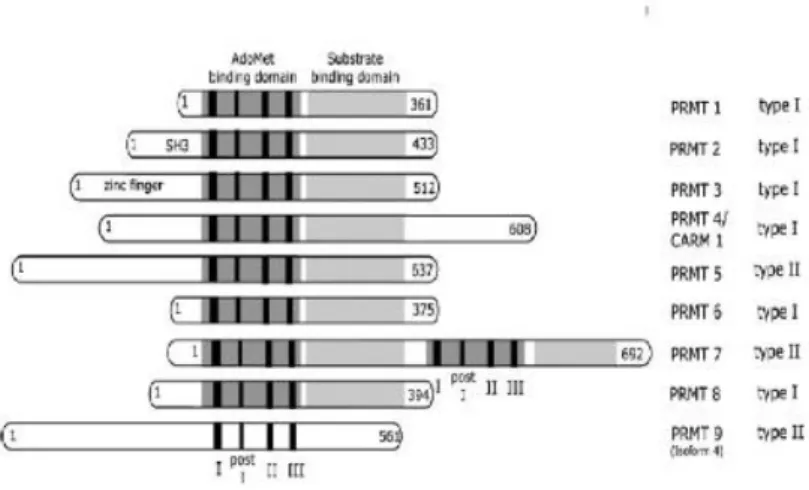
Nine PRMTs have been identified in mammals (Pahlich et al., 2006). According to the methylated form of arginine residues of their substrates, PMRTs are classified in two categories: type I enzymes (PRMT1, PRMT2, PRMT3, PRMT4/CARM1, PRMT6 and PRMT8) catalyze the formation of monomethylarginine and aDMA, while type II enzymes (PRMT5, PRMT7 and PRMT9) catalyze the formation of monomethylarginine and sDMA (Fig. 2.2). Other enzymes have been recently proposed as PMRTs, but their activities still requires a validation. PRMTs are co-activators/co-repressors of several nucleic acid-binding proteins, affecting protein-DNA or protein-RNA interactions.
Histones are the main PRMT targets (Di Lorenzo & Bedford, 2011). Arginine methylation of histones is usually associated with transcriptional activation, providing a direct mechanism of epigenetic regulation by the modulation of the chromatin structure and accessibility to the transcriptional machinery.
major targets for PRMTs. Many proteins have been shown to be a substrate of PRMT1, which is the predominant type I PRMT in mammalian cells, accounting for 85% of cellular PRMT activity and influencing many cellular processes, such as transcription, RNA processing, RNA transport, translation, signal transduction, DNA repair, apoptosis.
Fig. 2.1. Methylation of the arginine side chain by PRMTs. All PRMTs catalyze the formation of monomethyl-arginine (MMA) in an intermediate step. In a second step, type I PRMTs transfer a second methyl group to the same guanidino nitrogen resulting in an asymmetric dimethylarginine (aDMA), whereas type II PRMTs catalyze the formation of symmetric dimethylarginines (sDMA). (Picture taken by S. Pahlich et al. / Biochimica et Biophysica Acta 1764 (2006) 1890–1903).
It has been demonstrated that arginine methylation can act as a maturation signal, because several RBPs (e.g., Sam68) are mislocalized after demethylation (Bedford, 2003; Lukong & Richard, 2004). Moreover, methylation status can alter the ability of RBPs to interact with their specific mRNA targets. The affinity of a particular RBP for its targets may be reduced, as the methyl group would prevent hydrogen bonding by steric hindrance. Alternatively, arginine methylation may promote RNA-protein interactions, as the arginine becomes more “hydrophobic” after methyl groups addition, increasing the stacking with the RNA bases. Despite phosphorylation or acetylation, methylation does not alter the charge of the proteins affected, thus resulting in a less pronounced effect on interactions mediated by arginine residues. It has been proposed that arginine methylation has a milder effect on proteins than other
posttranslational modifications, modulating certain processes rather than acting as an on/off switch (Pahlich et al., 2006).
A number of molecules involved in the transcriptional machinery are also methylated by PRMTs. Two interesting PRMT substrates are the transcriptional elongation factor SPT5 and the activator of transcription STAT1: their methylation status affects respectively the association with RNA polymerase II (Kwak et al., 2003) and the DNA binding activity (Mowen et al., 2001), confirming the important role of methylation in many cellular processes.
Fig. 2.2. Overview of the human PRMT family. The numbers of amino acids indicates the length of each protein. PRMTs are divided into groups, depending on their catalytic activity.
(Picture taken by S. Pahlich et al./Biochimica et Biophysica Acta 1764 (2006) 1890– 1903).
2.2
CARM1: structure and function
Coactivator-associated arginine methyltransferase 1 (CARM1/PRMT4) is the first member of the arginine-specific protein methyltransferases (PMRTs) to be identified as a transcriptional regulator (Chen et al., 1999; McBride & Silver, 2001; Miranda et al., 2004).
As a type I PRMT enzyme, CARM1 catalyzes the transfer of methyl groups from S-adenosyl-L-methionine to the guanidine nitrogens of arginine, producing asymmetric dimethylated arginine as its final product.
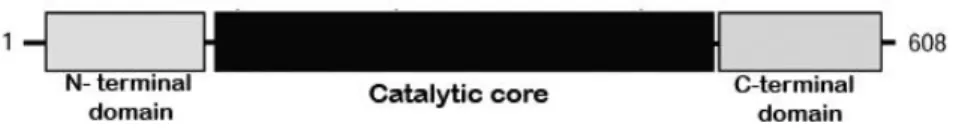
The human CARM1 gene is localized on chromosomal region 19p13.2. Three functional domains have been identified in the CARM1 protein: a central catalytic core and two additional domains at the N-terminal and C-terminal ends (Fig. 2.3).
Fig. 2.3. CARM1 three functional domains.
The catalytic core, a highly conserved domain composed of around 310 amino acids, contains both the S-adenosyl-methionine (AdoMet) and substrate binding domains. The enzyme-dead CARM1 knock-in mice displays defects similar to those seen in their knockout counterparts (Kim et al., 2010)supporting the idea that the enzymatic activity of CARM1 is essential for most CARM1-regulated processes. In contrast, the other two domains of CARM1 are dispensable for substrates methylation, but are required for the CARM1 coactivator function (Teyssier et al., 2002).
As generally said for PRMTs, a well-known substrate for CARM1 are histones (Di Lorenzo & Bedford, 2011): in response to hormone receptor activation, CARM1 methylates histone H3 on arginine residues number 2, 17, and 26.
CARM1 can also methylate many other non-histone proteins. As a transcriptional co-activator, CARM1 is a key player in the formation of large complexes on gene promoters leading to chromatin remodeling and gene activation. Among the first co-activators shown to be methylated by CARM1, there are the histone acetyltransferase p300 and the CREB binding
protein (CBP). Methylation regulates the interaction of both these proteins with the DNA-binding transcription factor CREB and, consequently, CREB ability to enhance transcription in response to cAMP (Chevillard-Briet et al., 2002).
Finally, as said in general for PRMTs, many RNA-binding proteins (RBPs) such as the Polyadenylate-binding protein 1 (PABP1) (Yadav et al., 2003), the TAR DNA-binding protein-43 (TDPprotein-43) (Carascossa, Dudek, Cenni, Briand, & Picard, 2010) and the ELAV protein members HuR and HuD have been shown to be methylated by CARM1 (Fujiwara et al., 2006; Hubers et al., 2011). The methylated state causes a structural conformational protein modification able to change the mRNA-stabilizing ability of such RNA-binding proteins and, thus, the half-life of their target mRNAs.
2.3
ELAV protein methylation by CARM1 and neuronal differentiation
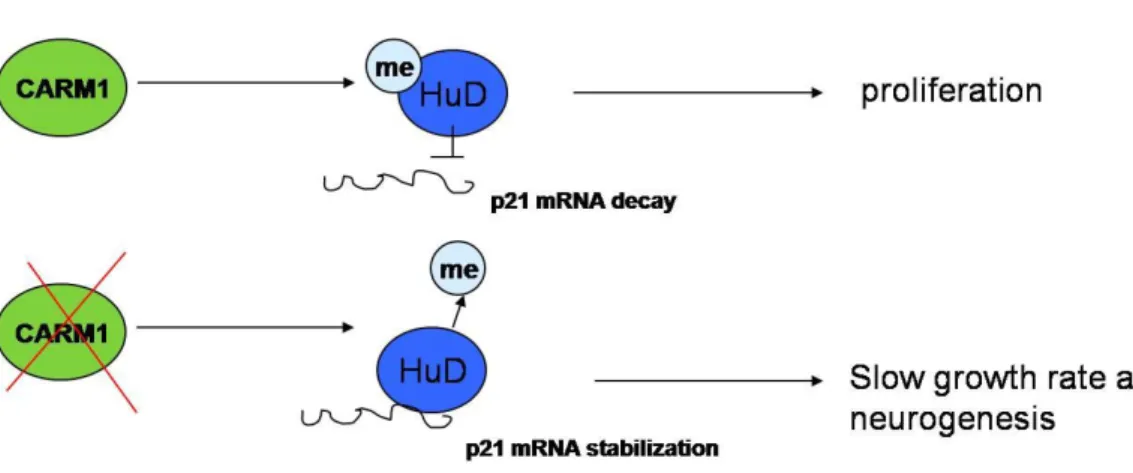
The neuron-specific ELAV proteins (HuB, HuC, HuD) are RBPs that bind preferentially to AU-rich elements (ARE) in the 3’ untranslated regions (3’UTR) of several mRNAs targets, increasing their stability and/or their translational efficiency (Pascale et al., 2008). ELAV proteins have been considered to be involved in the differentiation and/or maintenance of neurons, being most of their target genes involved in the cell cycle (for example p21, p27 and MYCN) and in neurogenesis (for example neurofilament-M, GAP-43 and tau). In agreement with this, it has been reported that overexpression of HuB and HuC in PC12 cells induces neuronal differentiation (Akamatsu et al., 1999), while overexpression of HuD accelerates neurite outgrowth in E19 rat cortical neurons, PC12 cells and retinoic acid-induced embryonic stem cells (Kasashima et al., 1999; Anderson et al., 2000; Mobarak et al., 2000; Anderson et al., 2001). Moreover, several experimental evidences have showed that ELAV proteins are substrate for CARM1. The precise amino acid targeted by CARM1 for methylation has been mapped for HuR and HuD and corresponds to a highly conserved arginine residue within the so-called ‘hinge region’ of ELAV family members (R217 for human HuR and R236 for human HuD), containing the cis elements responsible for ELAV nucleocytoplasmic shuttling (Fujiwara et al., 2006; Good, 1997; H. Li et al., 2002; Okano & Darnell, 1997).
Arginine methylation of ELAV proteins by CARM1 affects their neuroinductive potential (Fujiwara et al., 2006). In particular, it has been shown that CARM1 methylation of HuD at R236 negatively regulates its activity in PC12 cells and in the motor-neuron-derived MN-1 cell line model (Fujiwara et al., 2006; Hubers et al., 2011). As a consequence of this mechanism, the
decreases, thus cells are supposed pushed to be maintained in an uncontrolled proliferation state, which prevents them to undergo neuronal differentiation (Fig. 2.4).
AIM OF THE PROJECT
This thesis was directed to study neuroblastoma pathology and the project has been developed in collaboration with Associazione Italiana Per la Lotta al Neuroblastoma (Gaslini Hospital Genova, Italy).
Neuroblastoma is a tumor showing a variable degree of cell undifferentiation, which is directly related with bad prognosis. This feature is most likely a consequence of a perturbation in the process of differentiation of neural crest stem cells during the development of the symphatoadrenal lineage of the nervous system.
Therefore, molecular modulators that induce differentiation may be effective in the treatment of this malignancy.
In this context, arginine methylation has been shown to play a pivotal role in cell development and differentiation, driving a number of cell lineages to acquire a finally correct phenotype. In particular, CARM1 (the coactivator-associated arginine methyltransferase 1) has been found to negatively regulate differentiation of PC12 pheochromocytoma cells by methylating the HuD RNA-binding protein, a known determinant of the neuronal phenotype. These data suggest that CARM1 inhibition could represent a possible therapeutic approach for neuroblastoma treatment. The work presented in this thesis aimed to investigate the role of CARM1 in the process of neuronal differentiation of the SK-N-BE(2) neuroblastoma cell line model, in order to clarify the effects of its methylation activity on neuroblastoma differentiation, and the possible involvement of the HuD RNA-binding protein in this process.
Chapter 3
Materials and Methods
3.1
Materials
In vitro models: Human Neuroblastoma cell lines
17 parental Neuroblastoma cell lines were collected from different cell banks (ATCC, Virginia, U.S.A.; EACC, Salisbury, UK; Gaslini Hospital, Genova, Italy; DSMZ Human and Animal Cell Lines Database, Braunschweig - Germany).
Human Caucasian Neuroblastoma cell lines SK-N-BE(2) was selected as the principal in vitro cellular model.
SK-N-MC and SK-N-SH human neuroblastoma cell lines were cultured in DMEM (Sigma, Cat. N. D6546), supplemented by 10 % fetal bovine serum (FBS) (Lonza, Cat. N. DE14-801F), L-Glutamine (2mM) (Lonza, Cat. N. BE17-605F) and 1mM sodium pyruvate (Lonza, Cat. N. BE13-115E).
SK-N-AS and SK-N-DZ human neuroblastoma cell lines were cultured in DMEM (Lonza, Cat. N. BE12-614F), supplemented by 10 % fetal bovine serum (FBS) (Lonza, Cat. N. DE14-801F), L-Glutamine (2mM) (Lonza, Cat. N. BE17-605F) and 1% NEAA (Non Essential Amino Acids) (Lonza, Cat. N. BE13-114E).
KELLY, NB-69, SIMA, MHH-NB-11, LAN-1, CHP-134 human neuroblastoma cell lines were cultured in RPMI-1640 (Lonza, Cat. N. BE12-167F) supplemented by 10 % FBS (Lonza, Cat. N. DE14-801F) and 2 mM L-Glutamine (Lonza, Cat. N. BE17-605F).
IMR-32 was cultured in EMEM (Sigma, Cat. N. M2279), 1% NEAA (Non Essential Amino Acids) (Lonza, Cat. N. BE13-114E), 10 % FBS (Lonza, Cat. N. DE14-801F), 2 mM L-Glutamine (Lonza, Cat. N. BE17-605F) and 1mM sodium pyruvate (Lonza, Cat. N. BE13-115E).
CHP-212 and LAN-2 human neuroblastoma cell line were cultured in a mixture 1:1 EMEM (Sigma, Cat. N. M2279) + Ham’s F12 (Sigma, Cat. N. N4888), 10 % FBS (Lonza, Cat. N. DE14-801F) and 2 mM L-Glutamine (Lonza, Cat. N. BE17-605F).
STA-NB-1, -7, -10 human neuroblastoma cell lines were cultured in RPMI-1640 with Ultraglutamin 1 (Lonza, Cat. N. BE12-702F/U1), 10% FBS (Lonza, Cat. N. DE14-801F), 2.5% Hepes Buffer solution 1M (Sigma, Cat. N. H3537) and 1% Sodium Pyruvate (Lonza, Cat. N. BE13-115E).
SK-N-BE(2) was cultured and maintained in 1:1 EMEM (Sigma, Cat. N. M2279), + Ham’s F12 (Sigma, Cat. N. N4888), supplemented by 10 % fetal bovine serum (Lonza, Cat. N. DE14-801F), L-Glutamine (2mM) Glutamine (Lonza, Cat. N. BE17-605F), Sodium Pyruvate (1mM) (Lonza, Cat. N. 115E), 1x Non-Essential Amino Acids (NEAA) (Lonza, Cat. N. BE13-114E), Penicillin and Streptomycin (100 IU/ml).
All the cells lines were kept at 37ºC in the presence of 5% CO2.When cells reached 60-70 % of confluence, they were passaged with 0.05% Trypsin in PBS, expanded and maintained in culture.
3.2
Methods
3.2.1. Stable Transfection Assay for silencing CARM1 gene
For CARM1 knockdown, we used lentiviral transduction particles (MISSION Lentiviral Transduction Particles, Sigma-Aldrich). Briefly, 50.000 SK-N-BE(2) cells were seeded in a 6-wells plate in complete medium prior to transduction, in order to reach a 60-80% confluence. After 24 hours, Polybrene was added to the cells to a final concentration of 8µg/ml. Lentiviral stock was slowly thawed on ice and the appropriate amount of viral particles was added at two different Multiplicity Of Infection (MOI): 2 and 10 MOI. Plate was gently rocked to mix and incubated at 37ºC, 5% CO2. At day 3, viral particle-containing medium was removed and a fresh medium containing 0.5µg/ml of puromycin was replaced; the plate was incubated at 37ºC, 5% CO2. Fresh medium containing puromycin (0.5µg/ml) was replaced every 3-4 days to identify resistant colonies. Once reached 70% confluence, puromycin-resistant cells were expanded. Each pool of clones coming from different wells was assayed for CARM1 knockdown.
3.2.2. Protein extraction
For protein extraction, cells were suspended in RIPA buffer for mammalian cell lysis (50 mM Tris-HCl, pH 7.4, 150 mM NaCl 5M, IgePal CA-630 1%, EDTA 0.5M, Deoxicholate Sodium 10%, SDS 10%) added with phosphatases 2850, P-5726, P-0044) and proteases inhibitors (P-8340), provided by Sigma.
Briefly, cells were collected from 10 cm diameter plates. Cells were first washed, scraped and collected on ice-cold phosphate-buffered saline (1X PBS). Cells were then centrifuged for 10 min at 1.200 RPM and 4°C. Depending on the pellet size, cells were dissolved in 50-100 µl of RIPA buffer cleared by three rounds of freeze/thaw and then centrifuged for 40 min at 13.200 RPM and 4°C. Supernatant was collected. Protein quantification was determined by Bradford assay according to the manufacturer’s protocol (Sigma B-6916). Absorbance was measured using an Infinite M200 plate reader (TECAN). Total protein extracts were collected and stored at -80°C until use.
3.2.3. Western Blot
After quantification, an equal amount of proteins per sample was added with Protein Gel Sample Loading Buffer (50 mM Tris-HCl pH 6.8, 2% SDS, 10% Glycerol, 1% Beta-Mercaptoethanol, 12.5 mM EDTA, 0.02 % Bromophenol Blue) and heated at 99°C for 5 minutes. Proteins were then separated by 12% SDS-Page and transferred to PVDF membrane with a semi-dry blotting system (Trans-Blot® Transfer Medium, Bio-Rad Laboratories, Hercules, CA, USA). After saturation of the membrane with 5% BSA (Albumin from Bovine Serum, Sigma A3912) in TBS-Tween Buffer (Tris 20 mM, Tween 20, 0.2% NaCl 500, pH 7.5) for 1 hour at room temperature (RT), membrane was probed with different dilutions of antibodies (5% BSA in 0.1% TBS-Tween) at RT for 1 hour or overnight at 4°C, depending on the antibody used. The following antibodies were tested: Hu PAN mouse monoclonal (1:250, ab14370, Abcam); CARM1 (1:2.000, IMG-90597-2, IMGENEX); beta-tubulin (1:1.000,sc-53140, Santa Cruz) or GAPDH (1:5.000, sc-32233 Santa Cruz) antibodies were used as endogenous control. The membrane was then washed three times with TBS-Tween before the incubation with secondary antibodies conjugated to horseradish peroxidase (Santa Cruz Biotechnology) at dilution 1:1.000 to 1:5.000 in 5% BSA in TBS-Tween 0.1% for 1 hour at RT. The immunoreactions were visualized after addition of ECL-Plus Western blot detection system solutions (ECL Plus Western blotting Detection Reagents, GE-Healthcare Biosciences, Italy). Gels were scanned and lane densitometry analysis was performed using the Image J software. Molecular weight was estimated using Precision Plus Protein Standards Kaleidoscope (Bio-Rad).
3.2.4. Operetta Analysis
The Operetta™ (Perkin Elmer) is an automatic fluorescence microscope for High Content Screening applications. A High Content instrument is a platform comprising automated imaging instrumentation, image analysis software and high content informatics. This instrument allows to produce not only a morphological and well defined analysis of the cells, but also supports High Content Screening activities as it enables to quantify specific cellular phenotypes using different parameters.
The analysis was performed in order to evaluate morphological changes in SK-N-BE(2) cell line with reduced CARM1 expression respect to the wild type control. 50.000 silenced and control SK-N-BE(2) cells were seeded in 24 well plates (Costar) and incubated at 37°C and 5% CO2. After 24 hours of incubation, cells were fixed with 4% Formaldehyde (Sigma) for 15 minutes at room temperature, then permeabilized with Triton X-100 (0.05% in PBS) for 10 minutes. Cells
were washed three times in PBS for 5 minutes, blocked in PBS-BSA 3% for 30 minutes and immunostained with beta III tubulin (1:700, ab18207, Abcam) in PBS-BSA 1% for one hour at 37°C. After three washes in PBS for 10 minutes each, cells were incubated with a secondary conjugated goat anti-rabbit (1:500) (Alexa Fluor 488, A11070 Life Technologies) in PBS-BSA 1% for one hour at room temperature in dark conditions. Then, cells were washed three times in PBS for 10 minutes each (in dark conditions). For DNA labeling, cells were incubated with a solution of 4µg/ml Hoechst 33342 (1:2.000 dilution, Life Technologies).
Images have been acquired using an objective 20X LWD, using the following excitation (ex) and emission (em) filters: for Alexa 488: ex 480-490, em 500-550; for Hoechst 33342: ex 360-400, em 410-480.
For each condition, 4 replicate wells have been tested and 8 fields per well have been acquired, in order to get a significative number of objects for the subsequent analysis.
Analysis was performed as follows:
Nuclei Segmentation. The first step of an image analysis sequence is the identification of the objects of interest, in our case the nuclei (blue channel). Nuclei segmentation involves braking down the image into discrete objects (nuclei). The software (Harmony, PE) is able to assign a numeric parameter to every “object” (nucleus). Each selected object is shown as an overlay (image based information) and an entry in an object list (numerical data based information). This analysis is used to identify the cells and to define their number in every image acquired. Each image corresponds to one field of one well. Afterwards, the extension of the cytoplasm for each cell is detected basing on the green channel (beta III tubulin staining). Morphological properties of cells (cell dimensions and area) are then measured in order to allow the determination of sub populations of cells based on their properties.
Subsequently, starting from the individual cell bodies, the extension of the cytoplasm for each cell is detected basing on the green channel (beta III tubulin staining) using the Find Neurites building block. Once the neurites have been identified, they can be processed and quantified depending on several morphological parameters, such as neurite length, number of roots, number of nodes, number of extremities, number of segments in the tree neurite, total length of all neurites in the tree. Neurite segments that are not connected to one of the cell’s neurite trees (“orphan neurites”) are listed in the “Neurite Segments” and they are not taken into account in any of the default parameters. In Fig. 3.1, a workflow of neurite detection is showed.
3.2.5. Total RNA extraction
Total RNA was extracted from SK-N-BE(2) cells using RNeasy Mini Kit (Qiagen) following manufacturer’s instructions. Briefly, biological samples were washed twice with PBS, scraped, collected and lysed with Buffer RLT, a highly denaturing guanidine-thiocyanate-containing buffer, which is able to inactivate RNases to ensure purification of intact RNA. An equal volume of 70% ethanol was then added to provide appropriate binding conditions and the samples were moved to the RNeasy spin columns (supplied by the kit) and centrifuged for 15 seconds at ≥ 10.000 RPM. Spin columns contain a silica-based membrane that binds sample RNA and allows (with the speed of microspin technology) washing away contaminants. The bound RNA was washed with RW1 buffer and centrifuged at 10.000 RPM for 15 seconds, followed by two additional washes and centrifugation steps with RPE buffer. Finally, purified RNA was eluted off the column with RNase-free water.
High-quality RNA was quantified to the NanoDrop Spectrophotometer ND-1000. Absorbance ratio at 260/280 nm and 260/230 nm was used to assess the purity of the samples. Agarose gel electrophoresis and staining with ethidium bromide indicated the high integrity of RNA samples.
3.2.6. Microarray Analysis
RNA Target Preparation/Agilent Microarray Analysis.
Total RNA was extracted from SK-N-BE(2) cells silenced for CARM1 expression and the relative scramble control, as previously reported. The experiment was performed in biological triplicates plus one technical replicate as an internal control. RNA quality was assessed using the Agilent RNA 6000 Nano Kit (Agilent Technologies, Palo Alto, CA). One µg of total RNA was processed for the microarray hybridization with the Agilent Quick Amp Labeling Kit, according to the manufacturer's recommended protocols. Agilent's Quick Amp Labeling Kit uses cyanine 3-labeled targets to measure gene expression in experimental and control samples. The method uses T7 RNA polymerase, which simultaneously amplifies target material and incorporates cyanine 3-labeled CTP. Figure 2 represents a scheme of amplified cRNA procedure. Briefly, after cDNA synthesis, with Agilent One-Color Spike-Mix and Cyanine 3-labeling incorporation amplified cRNA samples have been purified and quantified. Each sample underwent a quality control evaluation, including cRNA yield and specific activity, as follows:
Yield (µg of cRNA) = (Concentration of cRNA) x 30 µl (elution volume) 1000
Specific activity (pmol Cy3 per µg cRNA) = Concentration of Cy3 x 1000 Concentration of cRNA
Yield >1.65 µg and specific activity > 9 pmol Cy3 per µg cRNA are required for proceeding to the hybridization step.
The resultant cyanine 3-labeled, linearly amplified cRNAs were fragmented and then hybridized on Agilent-014850 Whole Human Genome Microarray 4x44K G4112F, following the manifacturer’s protocol. Hybridized microarray slides were washed and scanned with the Agilent DNA Microarray Scanner G2505C at 5µm resolution with the manufacturer’s software (Agilent ScanControl 8.1.3) (Fig. 3.2).
The scanned TIFF images were analyzed numerically using the Agilent Feature Extraction Software version 10.7.7.1, according to the Agilent standard protocol GE1_107_Sep09. The output of Feature Extraction was analyzed with the R software environment for statistical computing (http://r-project.org) and the Bioconductor library of biostatistical packages (http://bioconductor.org).
Fig.3.2. Scheme of amplified cRNA procedure. Generation of cRNA for a one-color microarray experiment (picture modified by One-Color Microarray-Based Gene Expression Analysis Protocol – Agilent).
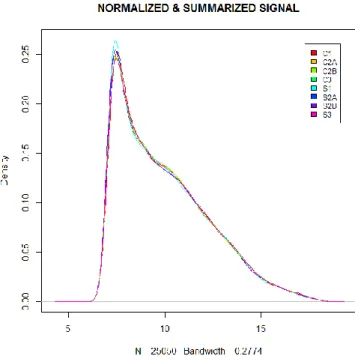
Data pre-processing (background subtraction, signal normalization and data filtering) were performed with the Agi4x44PreProcess Bioconductor package (Fig. 3.3, 3.4, 3.5). Foreground signals (the gMeanSignal column from feature extraction) were corrected for background (the gBGMedianSignal column from feature extraction) with the “Normexp” method. Normalization between arrays was performed with the “quantile” method. Probes that didn’t reach quality criteria (signal within the dynamic range of the scanner, signal well above the local background, signal not saturated, signal with low pixel noise) in all the hybridizations were filtered out. In this way, from the 45.015 initial probes we obtained 26.833 probes, surpassing the quality tests. Summarization of replicated not control probes resulted in 25.050 final probes (Fig. 3.6).
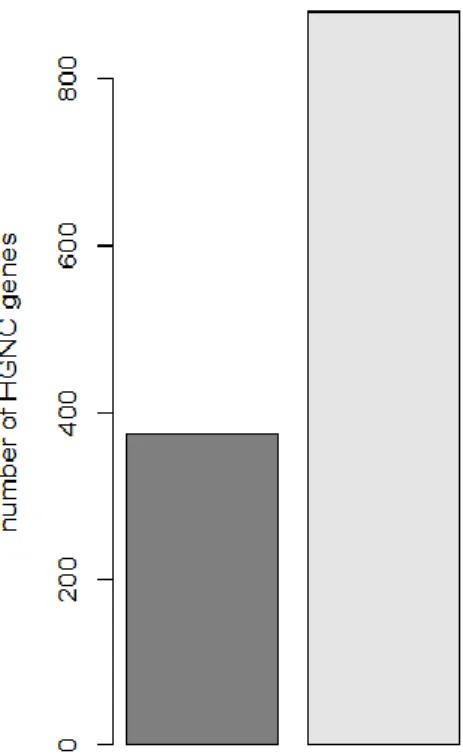
Differential expression between the control and the silenced samples was tested with the moderated t-test statistic implemented in the Limma package of Bioconductor. 1.738 probes with a Benjamini-Hochberg corrected p-value < 0.05 were selected as significantly differentially expressed. 541 probes, corresponding to 375 unique HGNC (HUGO Gene Nomenclature Committee) genes, have a positive log2 fold change (indicating up-regulation upon CARM1 silencing), whereas 1.197 probes, corresponding to 880 unique HGNC genes, have a negative log2 fold change (indicating down-regulation upon CARM1 silencing).
Fig. 3.3. Box whisker plot of raw microarray signals from Feature extraction (expression signals are log2 transformed).
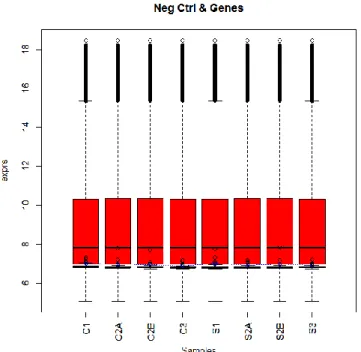
Fig. 3.4. Box whisker plot of normalized and background corrected microarray signals (expression signals are log2 transformed). Probes associated to genes and negative controls are displayed.
Fig. 3.5. Box whisker plot of microarray signals after data quality filtering (expression signals are log2 transformed).
Fig. 3.6. Distributions of microarray signals after data quality filtering and summarization (expression signals are log2 transformed).
DEGs Functional Analysis
Functional analysis of the differentially expressed genes (DEGs) from high throughput data was performed using two alternative approaches:
1) Enrichment analysis and enrichment clustering with DAVID (Database for Annotation, Visualization and Integrated Discovery)
2) Gene Set Enrichment Analysis (GSEA):
GSEA was performed on microarray data according to the procedure reported and software provided by Subramanian et al. (Subramanian, Tamayo, Mootha, Mukherjee, & Ebert, 2005) and the standalone Java implementation of the GSEA method from the Broad Institute website was used. All gene sets with more than 500 hits or less than 15 hits were automatically excluded, according to the default settings. The difference between signal-to-noise ratios was used as the association score. The number of phenotype permutations involved in the nominal p-value calculation was 1000. Gene sets were obtained from MSigDB (Molecular Signatures DataBase), containing almost 6769 gene sets, divided into five major collections:
c1: positional gene sets corresponding to each human chromosome and each cytogenetic band that has at least one gene.
c2: curated gene sets collected from various sources such as online pathway databases, publications in PubMed, and knowledge of domain experts.
c3: motif gene sets based on conserved cis-regulatory motifs from a comparative analysis of human, mouse, rat and dog genomes
c4: computational gene sets defined by expression neighborhoods centered on 380 cancer-associated genes
c5: GO gene sets consisting of genes annotated by the same GO terms.
For each analysis, we report the number of gene sets with a FDR (False Discovery Rate) <25%. Along with these gene sets with FDR <25%, we report the number of gene sets whose nominal p-values are <1%.
Microarray gene expression dataset analysis was previously also performed for 18 neuroblastoma cell lines, of which 13 bearing MYCN amplification, and three primary cell lines (R1066, R1107, R113) isolated as spontaneously migrating neural crest cells from human fetal neural tubes, called human Neural Crest Cells (hNCC), in order to evaluate elav genes expression. Briefly, the gene expression dataset was analyzed by means of Agilent GeneSpring GX 10 software. The first step of the analysis consisted in normalizing the input data: this was done by means of the 75th percentile shift method, which computes the 75th percentile of all data spots of a single array and then subtracts this value from these spots. No baseline to median transformation was applied. Differentially expressed genes (DEGs) were then identified by means of the t-test method, again via GeneSpring, with a 0.05 threshold on p-value.
3.2.7. Reverse transcription and quantitative PCR (qPCR)
To remove trace amounts of genomic DNA, 1 µg of total RNA was treated with 1 unit of DNase I, RNase-free (Fermentas) according to the manufacturer’s instructions. Samples were then retro transcribed in a total volume of 20 µl by using RevertAid First Strand cDNA Synthesis Kit (Fermentas) and random primers, following the manufacturer's manual.
The synthesized cDNAs were tenfold diluted, and 2 µl were used for qRT-PCR performed in a CFX96 real-time PCR detection system (Bio-Rad Laboratories) using KAPA PROBE FAST qPCR Master Mix (Resnova) in combination with selected TaqMan Gene Expression assays (Applied Biosystems). The following genes have been monitored: NEUROD2 (neurogenic differentiation factor 2), MAP1A (Microtubule-associated protein 1A), CDKN1A (cyclin-dependent kinase inhibitor 1A), KIT (tyrosine-protein kinase Kit), BMP4 (Bone morphogenetic protein 4), INHBA (Inhibin, beta A) and PHOX2B (Paired-like homeobox 2b).
qPCR was performed at 95°C for 3 minutes, followed by 40 cycles of 95°C for 3 sec and 60°C for 20 sec . Relative expression levels were normalized to the reference genes TBP (TATA-binding protein) and HPRT1 (hypoxanthine guanine phosphoribosyl transferase).
3.2.8. Immunofluorescence Assay
For HuD and CARM1 immunofluorescence assay, SK-N-BE(2) cells were plated in 24-well plates and grown up for one day; then, wells were rinsed with PBS and fixed for 15 minutes with paraformaldehyde 4% at 37ºC. After three washes with PBS (5 minutes each), permeabilization was carried out with 0.1% Triton X-100 in PBS for 10 minutes. Cells were then rinsed three times with PBS, blocked with 5% BSA and 0.05% Triton X-100 in PBS and incubated with different primary antibodies in blocking solution (dilution 1:200) overnight at 4ºC: HuD (dilution 1:200, sc-48421, Santa Cruz) and CARM1 (dilution 1:200, IMG-90597-2, IMGENEX). After overnight incubation the cells were rinsed trice with Triton 0.1% in PBS and incubated for 1 hour at room temperature with Green Alexa Fluor 488 anti-rabbit (A11070 Life Technologies) and conjugate anti-mouse secondary Alexa 594 antibodies (A11020 Life Technologies). Nuclei were counterstained with DAPI (LifeTechnologies). Images were acquired with a 63X objective on a Zeiss Observer Z.1 microscope using the Axio Vision imaging software package (Zeiss).
3.2.9. Plasmid construction and purification
1 µg of total RNA extracted from SK-N-BE(2) cells was retrotranscribed and the cDNA was used for the cloning. Briefly, the human HuD cDNA was amplified with Pfu DNA polymerase (Stratagene) with the following primers containing Sgf I and Mlu I restriction sites, respectively: Forward 5’GCAGGCGATCGCCGAGCCTCAGGTGTCAAATGG 3’ (Sgf I)
Reverse 5’ GACGACGCGTTCAGGACTTGTGGGCTTTGTTGG 3’ (Mlu I)
The following touchdown PCR profile was used:
1 cycle of 95°C for 3 min;
2 cycles of 95°C for 10 sec, 62°C for 20 sec, 72°C for 4 min; 2 cycles of 95°C for 10 sec, 60°C for 20 sec, 72°C for 4 min; 2 cycles of 95°C for 10 sec, 58°C for 20 sec, 72°C for 4 min; 15 cycles of 95°C for 10 sec, 56°C for 20 sec, 72°C for 4 min; 1 cycle of 72°C for 10 minutes.
After confirming the identity of the construct by sequencing, a large-scale purification of pHIS-HA-HuD plasmid was conducted by ion-exchange chromatography with an Endofree plasmid Giga kit (QIAGEN, Valencia, CA), according to the manufacturer's instructions. Plasmid DNA was analyzed by agarose gel electrophoresis and quantified by spectrophotometry. The 260:280 UV absorption ratios ranged from 1.8 to 2.0. Plasmids were stored in endotoxin-free water at −20°C until used.
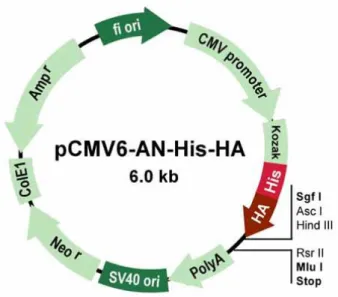
Fig. 3.7. Schematic representation of pCMV6-AN-His-HA plasmid, containing a CMV6 promoter/enhancer for high-level expression in many mammalian cell lines, a multiple cloning (MCS) between SgfI and Mlu I restriction sites and a neomycin resistance gene for selection of stable cell lines using Geneticin.
3.2.10. Transient transfection of
pHIS-HA-HuD plasmid and His-Tag isolation
SK-N-BE(2) cells were seeded in 10 cm diameter plates and allowed to reach 70-80% of confluence. Transfections started 24 hours after seeding by using 18µl of TurboFectin 8.0 (Origene) reagent and 6µg of the plasmid. Briefly, TurboFectin-containing media complex was prepared and plasmid DNA was added, mixed by gentle pipetting and incubated at room temperature for 30 minutes. The mixture was added drop wise to the cells and incubated for 48 hours. Cells were lysed and quantified according to the method described previously. The lysate was then subjected to His-Tag isolation and pull-down by using Dynabeads® His-Tag (Invitrogen), optimized to bind histidine-tagged proteins. Briefly, 1 mg of protein lysate was resuspended in a total volume of 700µl of wash/binding buffer (PBS with 0.02% Tween-20) and incubated with 50µl of Dynabeads® His-Tag on a roller for 45 minutes at 4ºC. The beads were collected by using a magnet, washed four times with wash/binding buffer and incubated with 100µl of elution buffer (PBS with 0.02% Tween-20 and Imidazol 300 mM) for 10 minutes at room temperature. Then, the beads were collected and the supernatant was resolved by 10% SDS-PAGE and probed with anti- His-probe antibody (sc-803, Santa Cruz Biotechnology) and CARM1 antibody (IMG-90597-2, IMGENEX). Both antibodies were used at 1:1000 dilutions.
3.2.11. Transient Transfection Assay to over express HuD w/t and HuD mutants
1µg of total RNA extracted from SK-N-BE(2) cells was retro-transcribed and the cDNA was used for the cloning. Briefly, a HA-tagged HuD sequence was amplified with Pfu DNA
polymerase (Stratagene) by using the primer set:
5’-GCACGGGATCCACTATGGAGTACCCATACGACGTACCAGATTACGCTGGAGCCTCA
GGTGTCAAATGG-3’ (forward) and 5’-GCAC
GCTCGAGTCAGGACTTGTGGGCTTTGTTGG-3’ (reverse).
The PCR product was digested with BamHI and XhoI restriction enzymes and cloned into the pcDNA 3.0 plasmid (Invitrogen Corporation, Carlsbad, CA), rendering the expression vector pHA-HuD w/t.
The pHA-HuD vector was then used as template to generate, by PCR, two mutants of HuD, replacing the arginine at position 236 with a lysine (R236K) or a tryptophan (R236W), respectively. The primers containing the desired mutations (underlined) are listed as follows:
R248K: (F) 5′-CCACCAGGCTCAGAAGTTCAGGCTGGACA-3′ and (R) 5′-TGTCCAGCCTGAACTTCTGAGCCTGGTGG-3′;
R248W: (F) 5′-CCACCAGGCTCAGTGGTTCAGGCTGGA-3′ and (R) 5′-TCCAGCCTGAACCACTGAGCCTGGTGG-3′.
The DNA was then incubated with 20 U Dpn1 restriction enzyme for 1 hour at 37 °C before transformation into XL-1Blue cells. All plasmids were confirmed by sequencing.
DNA transfection was performed as previously described. Cells were collected for protein extraction and quantification (see Western Blot protocol). Western Blot analysis was performed.
Chapter 4
Results and Discussion
4.1
CARM1 silencing promotes morphological differentiation of MYCN-
amplified neuroblastoma cellsNeuronal cells are characterized by a high degree of differentiation, which is also continuously maintained by the influence of some RNA-binding proteins (RBPs) that drive these cells to a final, completely differentiated phenotype. For what we know, the role of RBPs is exerted during the whole flow of gene expression which ranges, after binding to the post-synthesis pre-mRNAs, from polyadenylation to alternative splicing and nuclear export, to cytoplasmic localization, stability and translation of the bound mRNAs, by modulating their stability and their translational efficiency. In this contest, specific types of post-translational modifications of RNA binding proteins, such as methylation and demethylation, can be events able to influence RBP association to the target mRNAs, thus possibly modulating their activity on gene expression (Bedford, 2003; Lukong & Richard, 2004; Pahlich et al., 2006; Bedford & Clarke, 2009).
One of the most studied groups of RBPs involved in neuronal differentiation is the family of ELAV proteins: the human homologue HuR (a.k.a. ELAVL1) is ubiquitously expressed in all the cells, while HuB, HuC and HuD (a.k.a. ELAVL2, ELAVL3 and ELAVL4, respectively) are expressed only in neurons. However, the role played by these RBPs in the differentiation and maintenance of the neuronal phenotype, just well established in the past (see paragraph 2.3), suggests that they are not active in neuroblastoma cells. In this perspective, we know that HuR and HuD proteins are substrates for CARM1, which affects their neuroinductive potential (Fujiwara et al., 2006) through the methylation of the R217 for human HuR and the R236 for human HuD, as already discussed. Both arginines have been found to correspond to a highly conserved residue within the so-called ‘hinge region’ of ELAV family members, containing the cis elements responsible for ELAV nucleocytoplasmic shuttling capability. Taken together, these evidences are compatible with a possible negative influence of CARM1 in ELAV RBP activity and, as a consequence, a loss of differentiation phenotype in neuroblastoma cells. Thus, the purpose of this thesis was to demonstrate the role of CARM1 in counteracting the mechanisms underlying differentiation in a neuroblastoma cell line model, SK-N-BE(2) and, if possible, trying to demonstrate the direct influence of CARM1 methylation upon ELAV proteins.
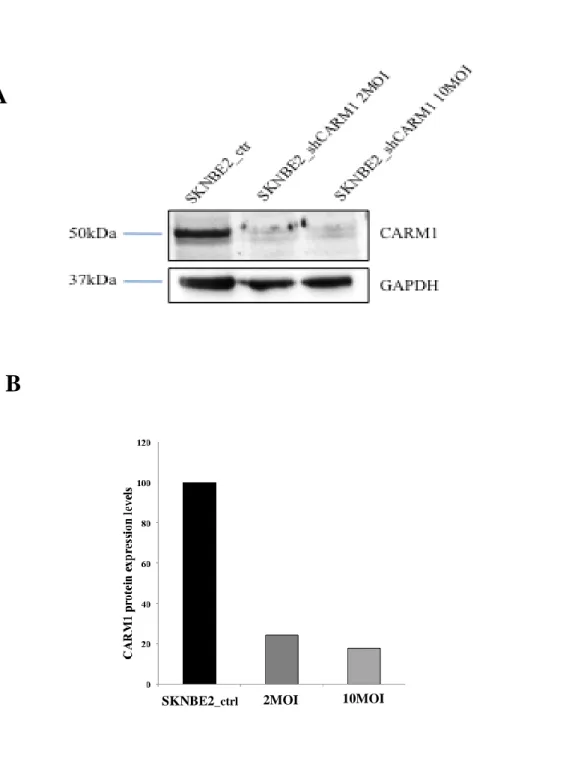
In order to do that, CARM1 activity has been disrupted by RNA silencing with the use of a lentiviral vector. SK-N-BE(2) cells have been infected with a lentiviral vector bearing an shRNA against CARM1 with two different virus concentrations: 2 and 10 MOI (multiplicity of infection). A suitable control was the same cell line infected with a lentiviral vector bearing a scramble sequence. We performed a quantitative RT-PCR analysis in order to evaluate CARM1 knock down at transcript levels. As clearly shown in Fig. 4.1A, these constructs led to a 80% of
decrease in CARM1 expression levels, compared to the control cells. Reduction in CARM1 protein level (figure 4.1 A and B) was also confirmed by western blot analysis in both multiplicities of infection. In SK-N-BE(2) cells silenced for CARM1, CARM1 protein levels were almost completely knocked down.
Fig. 4.1. Stable silencing of CARM1 expression in SK-N-BE(2) cell line. (A)Total proteins were extracted from scramble SK-N-BE(2) and shCARM1 SK-N-BE(2) cells infected with two different viral titres (2 MOI and 10MOI) and blotted with an antibody against CARM1. Samples were normalized to the endogenous control GAPDH. (B) Percentage of CARM1 protein expression level after CARM1 silencing, for both the multiplicities of infection.
B
A
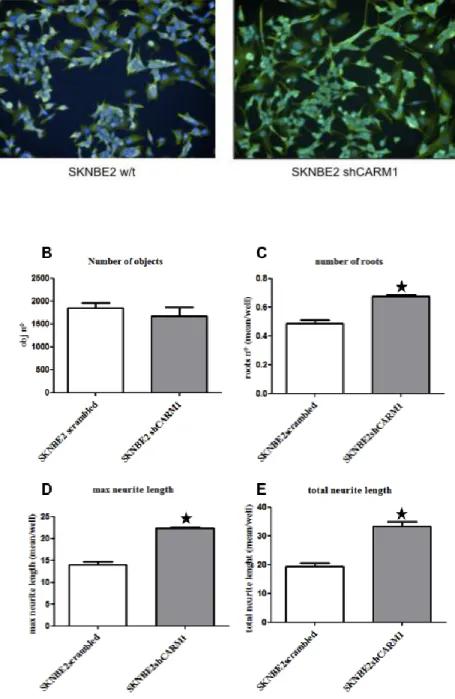
To check if CARM1 activity can modulate SK-N-BE(2) differentiation, morphological changes in shCARM1 SKNBE(2) cells were evaluated by means of an high throughput approach, an automatic fluorescence microscope system for high content screening: the Operetta™ (Perkin Elmer) system (see Materials and Methods for details). In brief, Operetta is a new fluorescence microscopy able to measure and analyze specific parameters on a cell, in a multi-well plate format. This allows considering a high number of objects to be investigated in every analysis performed. In order to evaluate neurite outgrowth in SK-N-BE(2) cells silenced for CARM1 with respect to the scramble-infected control, we performed an immunofluorescence assay using beta III tubulin antibody, a commonly used marker for neuronal differentiation. Then, we compared several parameters related to neurite outgrowth. The Operetta software is able to analyze and measure the fluorescently labeled neurites with respect to their total length, maximum length, number of roots, number of extremities and number of nodes. A special algorithm uses Hoechst staining to detect the nuclei and create cell body boundaries around them. The second fluorescent channel (green, detecting beta III tubulin) is used by the software to define the neurite network. This software can be set in order to remove broken neurites or neurites that do not “belong” to a cell’s neurite tree (they are called “orphan neurites” and listed in the Neurite Segments). After the detection of the neurites, generated fluorescent images allow to “read” and understand the outcome of the analyzed parameters. Three morphological parameters related to the process of differentiation have been evaluated for each cell considered: the maximum neurite length (a parameter referred to the longest neurite present in every cell), the total length of neurites (a parameter referred to the sum of the length of each neurite per cell), and the number of roots for each cell (a parameter increased in neuroblasts undergoing differentiation). The measure was done in more than one thousand randomly chosen cells. As clearly shown in the histograms of Fig. 4.2, the SK-N-BE(2) cell line population with a silenced CARM1 expression shows a moderate increase in all the parameters analyzed. Indeed, being equal the number of cells (objects) considered (scramble=1601±122; shCARM1=1395±163), the maximum length of neurites, the total length of neurites and the number of roots per cell are significantly higher in CARM1 silenced compared to the scramble control cells (respectively mean per well scramble=13,95±0,72 px while shCARM1=22,27±0,29 px; scramble=19,31±1,14 px while shCARM1=33,4±1,99 px; scramble=0,49±0,03 px while shCARM1=0,67±0,01 px), possibly sustaining our hypothesis of a CARM1 involvement in maintaining an undifferentiated phenotype in neuroblastoma cells.
Indeed, even if it is possible to appreciate an increase in neuronal-like phenotype for SK-N-BE(2) cells with reduced CARM1 expression (figure 4.2 A, right), a sub-population of cells,
showing a “flattened”, non neural-like morphology, is still present, probably because of a partial inefficiency of CARM1 silencing following lentiviral vector infection.
Fig. 4.2. High-content analysis of scramble BE(2) compared to shCARM1 BE(2). (A) Immunofluorescent image showing morphologic differences between SK-N-BE(2) scramble and SK-N-SK-N-BE(2) with reduced CARM1 expression. (B) Number of analyzed objects. (C-E) Neurite outgrowth readouts considered. Data represent the means