DOTTORATO DI RICERCA IN
FARMACOLOGIA E ONCOLOGIA MOLECOLARE
CICLO XXVII
COORDINATORE Prof. Antonio Cuneo
Novel ligands and assays for nociceptin/orphanin FQ and
classical opioid receptors
Settore Scientifico Disciplinare BIO/14
Dottorando Tutore
Dott. Malfacini Davide Prof. Calo’ Girolamo
The aim of the present study was twofold: pharmacologically characterize novel ligands and set-up and validate novel in vitro assays for nociceptin/orphanin FQ (N/OFQ) peptide (NOP) and classical opioid receptors. NOP and opioid receptors are 7TM receptors coupled with inhibitory G proteins; receptor activation leads to the inhibition of cAMP formation and calcium currents, and opening of potassium channels. Via these cellular inhibitory mechanisms, the N/OFQ – NOP receptor and classical opioid systems regulate a variety of biological functions both in the central nervous system and in the periphery.
The calcium mobilization assay has been and still is broadly used as primary screening for novel molecules in academic and industrial in vitro pharmacology laboratories. The use of chimeric G proteins allows to extend the calcium mobilization assay to virtually all types of G protein coupled receptors. This approach was previously used in our laboratories for characterizing NOP receptor ligands. In the frame of the present study, the calcium mobilization assay has been extended and validated for classical opioid receptors using a panel of standard opioid receptor agonists and antagonist. This test was used for investigating the pharmacological profile of novel opioid ligands including a series of morphine and oxymorphone analogues and novel cyclic endomorphin-2 derivatives. Calcium mobilization studies together with classical in vitro assays such as receptor binding, [35S]GTPγS binding and bioassays with isolated organs were applied to novel NOP receptor ligands including i) 3 different series of spiroxatrine derivatives; ii) the antagonist NiK-21273; iii) [X5]N/OFQ(1-13)-NH2 derivatives; iv) three tetrabranched derivatives
of N/OFQ generated with an innovative chemical approach named peptide welding technology. Recent data demonstrated that biased agonists, i.e. receptor ligands able to select which signaling pathways become activated upon binding to the receptor, may display advantages over unbiased ligands. In particular, in the field of opioids, G-protein (vs arrestin) biased agonists for the mu receptor displayed an increased therapeutic index associated to reduced tolerance liability. No data are yet available about biased agonism in the NOP receptor field. Therefore a novel bioluminescence resonance energy transfer (BRET) based assay was set-up for the NOP receptor. This method that allows to study both NOP/G-protein and NOP/β-arrestin interactions has been validated using a large panel of NOP ligands encompassing full and partial agonist as well as antagonist activity. The comparison of data achieved investigating NOP/G-protein and
NOP/β-In summary the studies performed in the frame of my PhD project extend our knowledge on the pharmacological profile of NOP and classical opioid receptors, provided to the scientific community novel compounds, pharmacologically characterized in detail, to be used as research tools and possibly as drug prototypes, and made available novel pharmacological assays useful for selecting fully innovative drugs such NOP receptor biased agonists.
1. Introduction 1
1.1. G protein-coupled receptors 1
1.2. N/OFQ - NOP receptor system 4
1.3. Classical opioid receptor systems 9
1.4. NOP and OP ligands 12
1.5. In vitro pharmacological assays for Gi protein coupled receptors 13
1.5.1 Chimeric G proteins and calcium mobilization assay 16 1.5.2. Bioluminescence Resonance Energy Transfer and pharmacological assays 18
1.6. Aim of the Study 21
2. Materials and Methods 22
2.1. Receptor binding and stimulation of [35S]GTPγS binding 22
2.2. Calcium mobilization assay 23
2.3. BRET assay 23
2.4. Electrically Stimulated mouse Vas Deferens 26
2.5. Data analysis 27
3. Results and Discussion 30
3.1. Novel assays 30
3.1.1. Pharmacological studies on classical opioid receptors coupled with calcium
signaling via chimeric G proteins 30
3.1.2. Pharmacological profile of nociceptin/orphanin FQ receptors interacting with
3.2.1.
oxymorphone 63
3.2.2. Exploring pharmacological activities of morphinans substituted in position 6 as
potent MOP agonists 69
3.2.3. Pharmacological characterization of endomorphin-2-based cyclicpentapeptides with
methylated phenylalanine residues 78
3.3. Ligands for NOP receptor 85
3.3.1. The nociceptin/orphanin FQ receptor antagonist NiK-21273 85 3.3.2. Spiroxatrine derivatives, pharmacological activity for the NOP receptor 91 3.3.3. Structure activity studies of N/OFQ(1-13)-NH2 derivatives modified in position 5 109
3.3.4. Pharmacological characterization of N/OFQ tetrabranched derivatives 119
4. General conclusions 139
5. References 143
1
1. Introduction
1.1 G-protein coupled receptors
G protein-coupled receptors (GPCRs) are the largest and most diverse group of membrane receptors in eukaryotes. GPCRs recognize a wide number of different extracellular stimuli, including photons, ions, small molecules, peptides and proteins, and transmit the resulting extracellular signals to elicit intracellular responses. With their common architecture of seven transmembrane (7TM) helices (Figure 1), GPCRs represent the largest protein family in the human proteome (> 800 human GPCRs). These receptors can be classified into major classes (i.e. secretin, adhesion, glutamate, frizzled/taste2, rhodopsin, and other 7TM receptors families) and further divided into subfamilies based on sequence similarities (e.g. opioid receptors belong to the SOG cluster of γ-group/rhodopsin family of GPCRs, (Fredriksson et al., 2003)). Signal transmission occurs through the interaction between receptors and different intracellular proteins (e.g., heterotrimeric G-proteins, kinases, and arrestins (Rajagopal et al., 2010)), which then activate downstream effectors and trigger cascades of cellular and physiological responses. GPCRs signaling have been related to numerous diseases, and these receptors are targeted by 30-40% of all drugs currently available (Wise et al., 2002). Consequently, understanding the pharmacology of these receptors is of two-fold interest, for the basic science community interested to uncover the processes regulated by these receptors and their details at a molecular level, and for the applied science community devoted to discover more efficacious and better tolerated drugs.
2
Figure 1. General architecture and modularity of GPCRs. N-terminal extracellular domains (top side),
C-terminal intracellular domains (bottom side). Image taken from (Katritch et al., 2012)
Structural data, ranging from NMR to X-ray 3D structures of active and inactive GPCRs, and site by site mutation analysis of GPCRs sequence/function, are now abundantly available; however the mechanisms by which drugs that bind GPCRs are able to evoke their effect through these receptors have not yet fully understood. It is possible to generalize the modes of GPCR activation processes in two models. In the classical model for GPCR activity, agonist binding to the GPCR causes the receptor to adopt a conformation that results in the activation of associated heterotrimeric G proteins. This activation involves the exchange of bound guanosine diphosphate (GDP) for guanosine-5'-triphosphate (GTP) by the Gα subunit of the G protein, leading to dissociation of the heterotrimeric protein complex into Gα and Gβγ subunits. This dissociation then promotes the production of and consequent signalling by second messenger systems, such as those involving cyclic AMP, diacylglycerol and calcium. Signalling by the activated conformation of the GPCR is terminated by phosphorylation of the cytoplasmic loops and tail of the GPCR, which is catalyzed predominantly by GPCR kinases (GRKs). This results in the binding of arrestins (i.e. β-arrestin 1 and 2) and consequent desensitization followed by
3
internalization into clathrin-coated pits (Lefkowitz & Shenoy, 2005). Thus, in the classical model, heterotrimeric G proteins mediate signal transduction and β-arrestins mediate receptor desensitization and internalization. Despite this simplification is widely accepted, it is now known that β-arrestins act not only as regulators of GPCR desensitization, but also as adaptor proteins that carry the GPCR signaling through multiple mediators such as mitogen-activated protein kinases, proto-oncogene tyrosine-protein kinase SRC, nuclear factor-κB and phosphoinositide 3-kinase. Moreover, biochemical data suggest that the signaling mediated by β-arrestins has distinct functional and physiological consequences from that mediated by G proteins (Lefkowitz & Shenoy, 2005; Rajagopal et al., 2010) (Figure 2).
Figure 2. Signal transduction by seven transmembrane receptors. (A) Classical paradigm. The active form of the receptor (R*) stimulates heterotrimeric G proteins and is rapidly phosphorylated by G protein–coupled receptor kinases (GRKs), which leads to β-arrestin recruitment. The receptor is thereby desensitized, and the signaling is stalled. (B) New paradigm. β-arrestins not only mediate desensitization of G protein–signaling but also act as signal transducers themselves. Image taken from (Lefkowitz & Shenoy, 2005).
The biological role of arrestins within the classical opioid receptor field was demonstrated in vivo using mice lacking the β-arrestin 2 gene that displayed a remarkable potentiation and prolongation of the analgesic effect of morphine (Bohn et al., 1999) and reduced tolerance liability (Bohn et al., 2002) compared to their wild type littermates. It is also known that some
4
GPCR ligands may act as biased agonists i.e. ligands able to bind a single receptor and differentially activate some of its pathways over others, for example G-protein over arrestin or vice versa. Based on these findings it has been proposed that opioid receptor biased agonists able to promote receptor/G-protein better than receptor/arrestin interaction may display in vivo higher efficacy and/or better tolerability (Violin et al., 2014).
1.2. N/OFQ - NOP system
Nociceptin/Orphanin FQ (N/OFQ) is a neuropeptide of 17 amino-acids (FGGFTGARKSARKLANQ) that binds with high affinity the N/OFQ peptide (NOP) receptor (Meunier et al., 1995; Reinscheid et al., 1996). N/OFQ is cleaved from a peptide precursor preproN/OFQ (ppN/OFQ). This precursor is composed by 176 amino acids in humans, 181 in rats, and 187 in mice, sharing an high degree of conservation. Moreover, the ppN/OFQ gene both in term of structural similarity and of organizational characteristics resembles those of the opioid peptide precursors, in particular preproenkephalin and preprodynorphin, suggesting a common ancestor for these peptide precursors (Mollereau et al., 1996). It is worth mentioning that N/OFQ is the first ligand that was discovered by reversed pharmacology. Before molecular biology techniques became common, firstly, ligands had been discovered and, then, their receptors found by classical pharmacology approaches. Nowadays, most GPCRs are identified on the basis of their DNA sequences and thus are initially unmatched to known natural ligands and classified as orphan GPCRs. For discovering the endogenous ligand of NOP receptor, the orphan receptor was cloned by homology cloning and transfected in mammalian cells; tissue extracts were prepared from the brain, purified, and fractionated following a number of rounds of fractionation. The extracts were then subsequently tested for their ability to modify cAMP levels in cells expressing the NOP receptor, N/OFQ was then isolated and characterized (Meunier et al., 1995; Reinscheid et al., 1996).
NOP is a G-protein coupled receptor (GPCR) whose activation leads to the inhibition of both cAMP levels and calcium channels, and to the stimulation of potassium currents; these cellular effects are due to the activation of pertussis toxin (PTX)-sensitive G-proteins (Gi/o) (Lambert,
5
only with G-proteins but also with other proteins, such as GRKs and arrestins (Soergel et al., 2014).
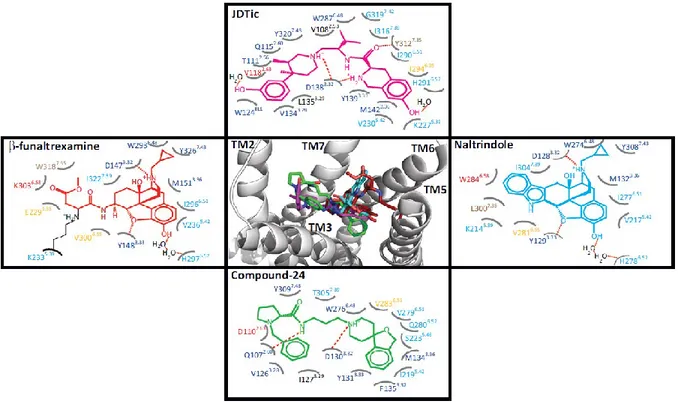
NOP receptor shares high degree of structural similarities with opioid receptors. Furthermore, N/OFQ sequence is similar to that of dynorphin A, an endogenous opioid peptide. Despite such similarities, N/OFQ does not bind opioid receptors and NOP does not interact with opioid neuropeptides. Thus, the NOP receptor was defined as opioid-related rather than opioid (Alexander et al., 2013). Recently, the crystal structure of the human NOP receptor was solved in complex with the antagonist compound-24 (C-24) (Thompson et al., 2012) revealing some substantial differences in the binding pockets of NOP and classical opioid receptors (Filizola & Devi, 2013; Thompson et al., 2012) (Figure 3).
Figure 3. Overlay of the crystallized opioid ligands in a representative opioid receptor crystal structure along
with schema of their interaction modes in each crystal structure. The central panel shows an overlay of β-funaltrexamine (red), naltrindole (cyan), JDTic (magenta), and compound 24 (green) in the MOP receptor crystal structure, which is partially shown in a grey cartoon representation. Interaction schema for β-funaltrexamine, naltrindole, JDTic, and compound 24 in the mu opioid (MOP), delta opioid (DOP), kappa opioid (KOP), and NOP receptor crystal structures are shown in the left, right, upper, and lower panels, respectively. Identical residues in all four receptors are shown in blue. Identical resides in MOP, DOP, and KOP but unique to NOP are shown in cyan. Divergent residues in all four opioid receptors are shown in red. Divergent residues in MOP, DOP, and KOP but not NOP are shown in brown. Unique residues to either MOP, DOP, or KOP are shown in orange. Image taken from (Filizola & Devi, 2013).
6
The N/OFQ-NOP system has been deeply investigated by academic and industrial researchers leading to the discovery of a variety of selective NOP receptor ligands (Calo & Guerrini, 2013; Mustazza & Bastanzio, 2011). Using such compounds the role of this system in physiology and pathology has been, at least partially, elucidated. N/OFQ and the NOP receptor are involved in the regulation of different biological functions at both central and peripheral levels including pain, mood and anxiety, food intake, learning and memory, locomotion, cough and micturition reflexes, cardiovascular homeostasis, intestinal motility and immune responses (Lambert, 2008) (Figure 4).
Figure 4. Pleiotropic effects of nociceptin/orphanin FQ (N/OFQ) on major organ systems. Potential clinical
indications are noted in bold. Image taken from (Lambert, 2008).
The role of N/OFQ in pain regulation has been clear since the earliest studies performed in rodents. The administration of N/OFQ has been shown to cause hyperalgesia, allodynia and analgesia. N/OFQ is able to increase pain sensitivity in mice and rats when administered supraspinally (Meunier et al., 1995; Reinscheid et al., 1995). Such hyperalgesic effects of N/OFQ was only seen after intracerebroventricular (i.c.v.), rather than after intrathecal (i.t.) administration. It has been demonstrated that most prominent role of N/OFQ in supraspinal pain
7
modulation is a “functional opioid antagonism” directed against many different opioid receptor agonists (Mogil & Pasternak, 2001). The anti-opioid role of N/OFQ has been corroborated by results obtained in vary assays/conditions, firstly N/OFQ counteracts the analgesic effects of endogenous opioids (Tian et al., 1997), of morphine (Bertorelli et al., 1999; Calo et al., 1998; Grisel et al., 1996; Zhu et al., 1997), and of a panel of selective opioid receptor agonists (King et
al., 1998). These anti-opioid effects of N/OFQ are subjected to tolerance liability (Lutfy et al.,
1999).
Since NOP and classical opioid receptors largely share similar transduction mechanisms, it is probably that their opposite effects on pain threshold are due to distinct localisations of these endogenous agonists and respective receptors on the neuronal networks involved in pain transmission at the supraspinal level. A cellular model explaining the anti-opioidergic action of supraspinal N/OFQ focalizes on brain stem, in particular of the nucleus raphe magnus (NRM), the major site of supraspinal N/OFQ effects on pain processing. In this brain region, different type of neurons, named ON and OFF cells, can be distinguished. ON cells firing occurs immediately before the nociceptive reaction, while OFF cells are inhibited by the GABA release due to ON cells firing. When OFF cells are activated, these cells induce a spinal antinociceptive effect via descending tracts. MOP opioids inhibit ON cells and thereby cause a subsequent disinhibition of the antinociceptive OFF cells. By contrast, N/OFQ inhibits nearly all cell types in the RVM. Via a direct inhibition of OFF cells, N/OFQ counteracts the disinhibitory effects of MOP agonists on these cells and thereby reverses opioid-induced supraspinal analgesia. The same mechanism may also account for the apparent hyperalgesic effect of N/OFQ, providing a cellular basis for the reversal of stress-induced analgesia by N/OFQ. These studies demonstrate that the net effects of N/OFQ on nociception at supraspinal sites strongly depend on the activation state (resting versus sensitized) of pain controlling neuronal circuits, see for a review (Zeilhofer & Calo, 2003).
N/OFQ was shown to block morphine-induced place preference (Ciccocioppo et al., 2000) an effect that was later extended to other drugs of abuse influencing the dopaminergic mesocorticolimbic pathway, such as alcohol, amphetamine and cocaine (Zaveri, 2011). One
8
mechanism whereby N/OFQ attenuates reward elicited by drugs of abuse is by directly inhibiting NOP expressing dopaminergic mesocorticolimbic neurons (Murphy et al., 1996).
The peptide N/OFQ is involved in learning and memory, being able to inhibit long-term potentiation in rat hippocampal slices (Yu et al., 1997). These observations received strong support from the observation that knockout mice for NOP receptor not only displayed greater learning ability and have better memory than wild type animals, but also showed increased long-term potentiation in the hippocampal CA1 region (Manabe et al., 1998). However systematic studies on the possible cognitive enhancing properties of selective NOP antagonists have not yet been performed.
NOP antagonists are able to elicit antidepressant like effects in the forced swimming test in mice (Redrobe et al., 2002). This finding was later confirmed and extended in other studies with other antagonists. Clinical studies suggest that N/OFQ levels are increased in depressed patients. Mechanisms of action involved in the antidepressant effects of NOP antagonists are still unknown. However, it has been reported that N/OFQ is able to inhibit noradrenaline and serotonin release from the cerebral cortex as well as neuronal firing in the dorsal raphe and locus coeruleus. Assuming that chronic stress/despair conditions stimulate the release of N/OFQ, the peptide may reduce monoaminergic signaling acting both at presynaptic and postsynaptic sites. By preventing such effects of N/OFQ, NOP antagonists may restore normal levels of noradrenaline and serotonin at their respective synaptic clefts. Thus, NOP receptor antagonists, by acting at different levels and with different mechanisms, may achieve a similar endpoint to that of classical antidepressants, i.e., an increase in cortical synaptic concentrations of monoamines (Gavioli & Calo, 2013). Furthermore, N/OFQ also affects the brain response to stress and anxiety; indeed one of the most intensively studied actions of N/OFQ is its ability to counteract stress related behaviors and promote anxiolytic like effects. The mechanisms by which N/OFQ exerts its anxiolytic effects are not fully understood but there is evidence for the involvement of GABA A receptor signaling. However CRFergic and serotonergic pathways might be also implicated.
The endogenous peptide N/OFQ has been demonstrated to inhibit the spontaneous locomotor activity, this effect is evident both in mice and rats, this inhibitory effect of N/OFQ is abolished
9
in the presence of NOP antagonists and NOP knock out mice. Despite these findings, the N/OFQ-NOP receptor system does not tonically control spontaneous locomotion since N/OFQ-NOP antagonists do not modify per se this behavior and knockout animals do not show phenotypes a this level. Worth of mention, intranigral injection of the selective NOP antagonist of peptide nature UFP-101, dose-dependently improved rat performance in the drag and rotarod tests (Marti et al., 2004), in addition the NOP knockout mice outperformed wild type animals in the same assays. These results suggest that endogenous N/OFQ may indeed exert an inhibitory influence over motor activity that becomes relevant during exercise. Other findings obtained in models of Parkinson’s disease suggest that NOP receptor blockade may represent a new strategy for treating hypokinetic disorders and proposed NOP receptor antagonists as drugs for treating Parkinson. Clinical evaluations on cerebrospinal fluids from parkinsonian patients showed 3.5 fold higher levels of N/OFQ compared to that of healthy subjects.
N/OFQ-NOP receptor system is also involved in food intake control, in fact it has been shown that supraspinal N/OFQ (1–10 nmol) administration increases food intake in satiated rats. This effect is mimicked by a variety of NOP synthetic agonists. Moreover the involvement of the NOP receptor in this action has been confirmed in receptor antagonists and knockout studies.
The value of the N/OFQ-NOP receptor system as target for the development of innovative drugs has been demonstrated in several studies, for instance NOP receptor agonists might be used as novel analgesics particularly for neuropathic pain, as anxiolytic agents, as novel agents to treat drug dependence, and for the treatment of cough and urinary incontinence. On the other hand, NOP receptor antagonists can be worthy of development for treating, major depression and Parkinson’s disease and possibly some inflammatory diseases (Lambert, 2008).
1.3. Classical opioid receptor system
The history of classical opioid receptors is longer than that of the NOP receptor. Beckett and Casy in 1954 proposed the existence of receptors for opiate drugs (Beckett & Casy, 1954) based on their studies of structure activity relationships for antinociceptive activity in a series of
10
synthetic opiates. These receptors are called opioid since the discovery of endogenous peptides with effects similar to those of opiate drugs. Portoghese and colleagues (1965) through structure activity relationship studies, proposed that more than one opioid receptor type or that multiple modes of interaction of ligands with opioid receptors were possible. Endogenous opioid systems play a critical role in modulating a large number of sensory, motivational, emotional, and cognitive functions. As inhibitory neuropeptide transmitters, they fine-tune neurotransmission across a wide range of neuronal circuits, setting thresholds or upper limits. Earliest direct demonstrations of opioid receptors binding sites were obtained by receptor binding studies with radiolabelled naloxone and etorphine molecules (Pert & Snyder, 1973; Simon et al., 1973; Terenius, 1973). The first definitive evidence that these receptors did not form a homogeneous population was presented in 1976 (Martin et al., 1976). The proposed receptor forms were named after the prototypic drugs used in these studies, i.e. the mu, for morphine receptor and the kappa, for ketocyclazocine receptor. Pharmacological analysis of opioid peptide effects in guinea-pig ileum and mouse vas deferens led to the discovery of a third opioid receptor named the delta, for deferens receptor (Lord et al., 1977). The three opioid receptors, MOP, DOP, and KOP have been cloned and the recombinant receptors shown to have binding and functional characteristics consistent with their endogenous counterparts (Evans et al., 1992; Kieffer, 1995; Kieffer et al., 1992; Satoh & Minami, 1995).
As far as endogenous opioid peptides are concerned, three families of opioid peptides have been identified: enkephalins, endorphins, and dynorphins. Each family derives from a distinct precursor protein, prepro-opiomelanocortin (POMC), prepro-enkephalin, and prepro-dynorphin, respectively. These precursors are encoded by distinct genes and are subjected to complex cleavages and posttranslational modifications resulting in the synthesis of multiple active peptides. The opioid peptides share a common amino terminal sequence of Tyr-Gly-Gly-Phe (followed by Leu or Met), the opioid message domain. This motif is followed by carboxy terminal extensions yielding peptides ranging from 5 to 31 residues. β-endorphin (which derives from cleavage of POMC) is also processed into nonopioid peptides such as adrenocorticotropic hormone, melanocyte stimulating hormone, and β-lipotropin. Proenkephalin contains multiple copies of met-enkephalin, as well as a single copy of leu-enkephalin. Prodynorphin contains three peptides of differing lengths that all begin with the leu-enkephalin sequence: dynorphin A,
11
dynorphin B, and neoendorphin (Brunton et al., 2011). A comparison of peptide sequences is shown in Table 1.
Other important opioid peptides are endomorphin 1 (EM-1) that was identified in 1997 in the bovine brain (Zadina et al., 1997) and endomorphin-2 (EM-2) found together with EM-1 in the human brain cortex (Hackler et al., 1997). The sequences of these peptides are Tyr-Pro-Trp-Phe-NH2 and Tyr-Pro-Phe-Phe-NH2, for EM-1 and EM-2, respectively (Table 1). EM-1 and EM-2
peptides showed high affinity for the mu opioid receptor with Ki values being 1.1 and 1.3 nM,
respectively (Hackler et al., 1997), and more than 4000 fold selectivity for mu over the other opioid receptors. Radioimmunological and immunocytochemical analysis revealed that endomorphins are distributed throughout the human, bovine, and rodent central nervous system. EM-1 is widely distributed in the brain and upper brainstem being particularly abundant in the nucleus accumbens, the cortex, the amygdala, the thalamus, the hypothalamus, the striatum, and the dorsal root ganglia. In contrast, EM-2 is more prevalent in the spinal cord and lower brainstem, hypothalamus, the nucleus of the solitary tract, less abundant EM-2 distribution is in the nucleus accumbens, the stubstantia nigra, the nucleus raphe magnus, the ventral tegmental area, pontine nuclei and the amigdala. However, endomorphins precursors or processing pathways still remains unidentified. The effects elicited by exogenous administration of EM-1 and EM-2 are similar to that of other mu selective opioid peptides, for the physiological role played by these peptides see the review (Fichna et al., 2007).
Opioid receptors are coupled, via Gi proteins, to the inhibition of adenylyl cyclase activity, the
activation of potassium currents, and the suppression of voltage gated calcium currents; this is typical of both opioid and NOP receptors. These receptors are then coupled to an array of second-messenger systems, e.g. MAP kinases and phospholipase C mediated cascades. Systems as GRKs and β-arrestins are also involved in the opioid receptors regulation and cascade. Prolonged exposure to opioids results in adaptations at multiple levels within these signaling cascades that may relate to effects such as tolerance, sensitization, and withdrawal (Brunton et al., 2011). It has been demonstrated that the β-arrestin 2 gene plays a pivotal role in morphine induced analgesia, knockout mice for β-arrestin 2 resulted in the potentiation and prolongation of the analgesic effect of morphine and reduced liability compared to their wild type littermates (Bohn et al., 2002; Bohn et al., 1999).
12 Table 1. Amino acid sequence of opioid peptides.
Peptide amino acidic sequence
Enkephalins YGGFM YGGFL Dynorphins YGGFLRRIRPKLKWDNQ YGGFLRRQFVVT YGGFLRKYPK Endorphin YGGFMTSEKSQTPLVTLKNAIIKNAYKKGE Endomorphin 1 YPWF Endomorphin 2 YPFF N/OFQ FGGFTGARKSARKLANQ
1.4. NOP and OP ligands
The discovery of selective receptor ligands played a fundamental role for identifying the biological roles played by NOP and OP receptors systems. Opioid receptors are bound by a plethora of different synthetic ligands in terms of pharmacological activity. Radiolabelled compounds have allowed the definition of ligand binding characteristics for the three receptor subtype and the determination of anatomical distribution of the receptors using autoradiographic techniques showing receptor specific anatomical distribution in brain, spinal cord, and the periphery.
Naloxone is a universal opioid antagonist, while CTOP, naltrindole, and nor-binaltorphimine (nor-BNI) are selective antagonists for the MOP, DOP, and KOP receptors, respectively. Synthetic selective agonists are DAMGO, DPDPE, and U-69,593 for MOP, DOP, and KOP, respectively.
As far as selective NOP receptor ligands, N/OFQ(1-13)-NH2 (Guerrini et al., 1997), UFP-112
(Rizzi et al., 2007), [Arg14Lys15]N/OFQ (Okada et al., 2000), Ro 65-6570 (Wichmann et al., 1999), and SCH 221510 (Varty et al., 2008) are selective full agonists, while [Phe1ψ(CH2
-NH)Gly2]N/OFQ(1-13)-NH2 ([F/G]N/OFQ(1-13)-NH2) (Calo et al., 1998), UFP-113 (Arduin et
13
and [Nphe1]N/OFQ(1-13)-NH2 (Calo et al., 2000b), UFP-101 (Calo et al., 2002), J-113397
(Kawamoto et al., 1999), SB-612111 (Zaratin et al., 2004), C-24 (Goto et al., 2006) as selective antagonists for the NOP receptor.
Opioid therapeutics are of common use for the treatment of pain, e.g. morphine, buprenorphine, methadone, fentanyl, tapentadol, etc. Although the widespread use of opiates, opioid analgesics share typical disadvantages such as constipation, respiratory depression, tolerance liability, and drug abuse. Much efforts have been spent for developing more effective and well tolerated drugs, this research is still ongoing and innovative drug candidates are now being discovered in research laboratories, examples of these compounds under clinical evaluation are: i) cebranopadol, a mixed NOP/opioid receptor agonist by Grünenthal, candidate for chronic, severe and neuropathic pain (Linz et al., 2014; Schunk et al., 2014); ii) TRV130 by Trevena Inc, candidate for treating postoperative pain, it is a MOP receptor agonist able to promote G-protein signaling but not to recruit β-arrestins, TRV130 is more effective than morphine with less side effects (Hackler et al., 1997; Soergel et al., 2014).
1.5. In vitro pharmacological assays for inhibitory-G protein-coupled
receptors
An assay is a well-defined analytical method that contains the measurement procedure and how the measurement should be interpreted to obtain the properties of a system or object. Assays are very important tools in the pharmaceutical industry and in the medical diagnostics industry. The characterization of a substance requires the determination of its physiochemical properties by physiochemical assays and the determination of its biological activities by bioassays. The physiochemical properties of a drug substances include its chemical composition, chemical structure, solubility, particle size, crystal property, purity, etc.. through physical and chemical techniques, such as high-performance liquid chromatography (HPLC), mass spectrum, nuclear magnetic resonance (NMR), X-ray crystallography, amino acid sequencing, and so forth. In contrast, the biological activity of a substance by definition is the effect of the substance on a biological test system. Thus, the biological activity of a substance cannot be measured by
14
studying the drug substance alone, it requires a biological test system. The biological test system can be biochemical, such as the activity of an enzyme or the ability to bind to a predefined protein; cell based, such as isolated primary cells or transformed cell lines; tissue or organ based; and animal based (Wu, 2010).
Figure 5. Tissue chambers for isolated tissues assays (left panel), FLIPR instrumentation (right panel). Historically, in vitro studies for assessing the pharmacological profile of new molecules were performed by using in vitro bioassays on isolated tissues, at least until ’70. Such techniques maintain the advantage of studying the receptor in a physiological environment constituted by the tissue/organ. Bioassays on isolated tissues are functional assays and have the ability to estimate both the potency and the efficacy of new ligands. On the other hand bioassay techniques are difficult and time consuming, and can only be employed for studying receptors expressed by the experimental animals. This method is still playing an important role in the characterization of novel opioid ligands, and concurred at the characterization of the major part of available NOP receptor ligands and drugs (Figure 5, left panel).
Conversely, another in vitro approach, which for many years has been the most widely used method to screen new molecules, is the receptor binding. This approach involves the use of cell membranes, both isolated from native tissues and from cells expressing recombinant receptors, and the use of labeled ligands. Ligands are often labeled with a radioactive isotope (usually 3H or
125I) that allows to measure through the specific radioactivity the amount of molecule that bound
the receptors, less commonly are linked to moieties of fluorescence properties. These type of measurements led to the determination of the onset of interaction and dissociation, the affinity, and the receptor levels into the membrane preparation. The disadvantage of this method is that
15
does not allow to evaluate the efficacy of a compound, this type of information can be obtained only using functional assays. An assay used to measure the potency and efficacy of a ligand to an active Gi receptor is the stimulation of the [35S]GTPγS binding in activated G proteins. This technique is widely used, but requires a purification of the components of the membranes, the use of radioisotopes and lack of amplification of the signal. Another technique for the measurement of the signal of G proteins is the measurement of stimulation or, in the case of Gi, inhibition of the forskolin induced accumulation of cAMP, this latter method suffers from vary limitations, e.g. the inhibition rarely exceeds 60% of the stimulation, and also, this assay is high expensive both in term of costs and time.
The modern drug-discovery processes, based on the use of big library of compounds have required the development of High Throughput Screening (HTS) methods. These methods allow the rapid determination of the effects of a large number of new ligands. The development of a panel of calcium-sensitive fluorescent dyes and proteins revolutionized the ability to visualize calcium as important second messenger and its complex signaling characteristics. In fact, the major part of the HTS methods are capable to measure fluorescence and the most used is the measurement of fluorescence in response to mobilization of intracellular calcium. The classic tool dedicated to this activity is the Fluorimetric Imaging Plate Reader (FLIPR, Molecular Devices) (Figure 5, right panel) able to screen new compounds in microplates 96/384 wells seeded with transfected cells. In these methods radioactive substances are not needed and it is possible to test several compounds simultaneously. This approach is costly and it is not suitable to test ligands for those receptors not coupled to calcium signaling.
Others methods for studying Gi coupled GPCRs that are also based on fluorescence
measurements employ dyes sensitive to perturbation of cell membrane potential (e.g. (Knapman & Connor, 2015)), recently other methods based on Förster/Fluorescence Resonance Energy Transfer (FRET), or Bioluminescence Resonance Energy Transfer (BRET) are increasing their support to pharmacological assays because genetic engineering is getting fairly common and using these type of “proximity” assays it is possible to test a wide spectrum of receptor/effector or receptor/receptor interactions (Salahpour et al., 2012). Other methods named “label free” are able to follow GPCR activation by an “holistic” point of view without the needing to use any type of radioactive or dye compound, e.g. measuring changes in impedance of cells and the dynamic mass redistributions following receptor activation (Grundmann & Kostenis, 2015; Ke et al.,
16
2015), nowadays the high costs of instruments and particularly consumables for these type of experiments limit the use of these assay to industrial laboratories.
1.5.1. Chimeric G proteins and calcium mobilization assay
The use of calcium mobilization assays was limited to Gq coupled receptors whose activation
stimulates phospholipase C-β, which catalyzes the cleavage of membrane-bound phosphatidylinositol 4,5-biphosphate into the second messengers inositol (1,4,5) trisphosphate (IP3) and diacylglycerol. IP3 acts on IP3 receptors in the endoplasmic reticulum membrane to
elicit calcium release from the reticulum.
The introduction of chimeric G proteins capable to force receptors to signal toward the mobilization of calcium enabled to applay this assay to virtually all GPCR. Several biochemical studies showed that within the Gα structure there are sequences capable of regulating the selectivity of interaction of G proteins and GPCRs. In particular, the C-terminal region of Gα plays a key role in determining the specificity of Gα/GPCR interaction. Furthermore, the replacement of at least three amino acid residues at the Gαq C-terminal (Gq proteins are coupled
to calcium signaling) with the corresponding residues of Gαi generated a chimeric G protein able
to cause a switch in the coupling of several Gi coupled GPCR to the calcium signaling, e.g. α2
adrenergic receptors, adenosine A1 and D2 dopaminergic receptor, the substitution of five amino
acids was demonstrated being the most efficient (Gαqi5) (Conklin et al., 1993). The seminal
results by Conklin were then extended to an higher number of GPCRs and also used for the process of GPCR deorphanization (Kostenis et al., 2005b). Subsequent studies have clarified that other regions of G proteins are important to determine the specificity of Gα/GPCR interactions. In particular, the G66 residue of the linker region I is involved in this process, it has been shown that by point mutating the glycine residue into an aspartic, the GαqG66D protein is less selective
when tested for the interaction with GPCRs, allowing GPCRs normally coupled to Gαi or Gαs to
stimulate calcium mobilization. The proposed mechanism for this increase in promiscuity of the G protein/GPCR coupling event is the following i) the mutational replacement of glycine by other amino acids reduces the conformational freedom of a linker region and might thus yield a Gα in an inactive state with a slightly opened nucleotide binding cleft, ii) this in turn might lower
17
the activation energy for a GPCR to induce nucleotide exchange on Gα, enabling GPCRs from all coupling classes to facilitate the Gα-activation event (Kostenis et al., 2005b). This mutation cooperatively interacts with the replacement of the 5 residues at the C terminal (Gαqi5 and Gαqs5)
in reducing the receptor/effector specificity. This has been demonstrated for a large number of receptors by performing experiments in which potency and/or maximal effects of reference agonists were always higher in cells expressing the double mutated protein (GαqG66Di5) compared
to cell lines expressing either one of the single mutated proteins or native G proteins (Kostenis et
al., 2005a) (Figure 6).
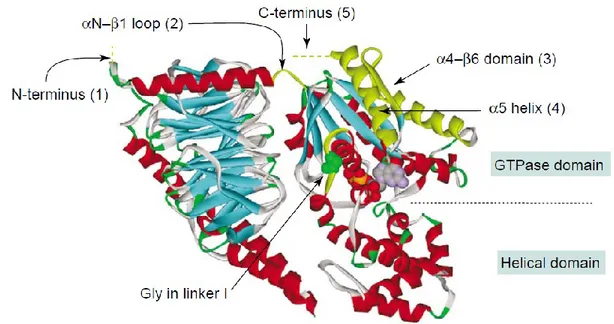
Figure 6. Structure of a heterotrimeric G protein. A highly conserved glycine residue in the linker I region
that connects the GTPase domain with the helical domain is highlighted in green. The guanine nucleotide GDP is buried in a cleft between the helical domain and the GTPase domain of the Gα subunit (Kostenis et
al., 2005b).
In our laboratories the calcium mobilization assay with chimeric G proteins was successfully setup and validated for the NOP receptor using a large panel of ligands of different activity and applying classical pharmacological criteria (Camarda et al., 2009). This study demonstrated that the overall pharmacological profile of the human NOP receptor evaluated with the calcium mobilization assay, is not affected by the application of chimeric G protein technology.
This study also underlined some limitations of the calcium mobilization assay.. Similar to other assays that measure second messengers, the high level of amplification generated a high
18
efficiency of the stimulus/response coupling. Under these experimental conditions ligand efficacy is overestimated and for instance partial agonists may display similar maximal effects as full agonists.. Moreover the rapid and transient nature of the calcium peak (i.e. rapid calcium release and subsequent ions sequestration) may produce two different artifacts: for agonist ligands, a possible underestimation of potencies for slow interacting ligands; for antagonist ligands, the evaluation of the type of antagonism (competitive vs non competitive) can be difficult due to hemi equilibrium condition that is typical of this assay. For a review see (Charlton & Vauquelin, 2010).
1.5.2. Bioluminescence Resonance Energy Transfer pharmacological assays
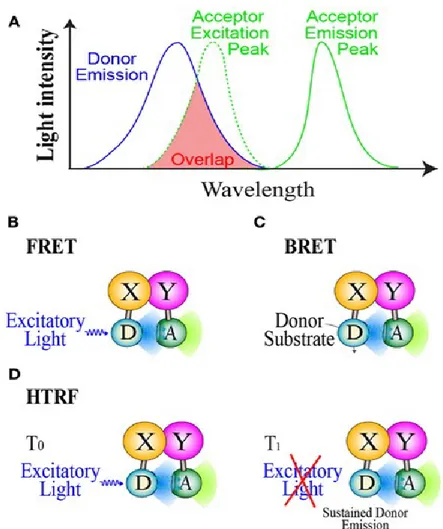
Green Fluorescent Proteins (GFP) and other recombinant modified peptides are useful tools for investigating the network of macromolecular interactions occurring in living cells. These proteins, together with an increasing number of chemical fluorescent probes are designed for arranging a wide spectrum of subcellular, cellular, tissue, and organ occurring phenomena. Protein biochemists have extensively adopted techniques based on Resonance Energy Transfer (RET) between a donor/acceptor couple of chromophores linked to different proteins to investigate molecular interactions. Fluorescence RET (FRET) is one of the most common methods applied both at cell biology and at in vitro GPCR pharmacology. Examples of this use in pharmacology are: protein biosensors for measuring cAMP (Mathiesen et al., 2013), calcium levels (Roelse et al., 2013), and also methods for studying GPCRs oligomerization (Ciruela et al., 2014). Without entering in details the application of Homogenous Time-Resolved FRET (HTRF), that is based on the long lasting fluorescent emission of lanthanide metals, enhances the quality of FRET measurements by diminishing the background noise that is very common when studying fluorescence in cells (Norskov-Lauritsen et al., 2014). TR-FRET was successfully applied to monitoring those mechanisms in which low background levels is a fundamental requirement, such as receptor binding (Emami-Nemini et al., 2013) and receptor/effector interactions (Ayoubet al., 2010). Bioluminescence RET (BRET) is a recently introduced variation that exploits
energy transfer occurring between a luciferase-bound donor, able to produce light by metabolizing a chemical substrate (e.g. luciferine, coelenterazine), and a compatible fluorescent
19
protein acceptor. BRET has two advantages over conventional FRET. First, it does not require incident light, which can damage subcellular structures. Second, it may lead to assays with a better signal-to-noise ratio, because endogenous luminescence is negligible when compared to autofluorescence, at least in mammalian cells (Pfleger & Eidne, 2006) (Figure 8). For these reasons BRET was successfully applied both to monitor second messenger levels with biosensors (e.g. cAMP, IP3, calcium) but also to evaluate the proximity of proteins and peptides (e.g. GPCR
to different types of G proteins and/or arrestins), see for a review (Salahpour et al., 2012).
Figure 8. Light emission spectra of Donor/Acceptor couple (panel A). FRET, BRET, and HTRF mechanisms
are summarized in B, C, and D panels.
In the present study we setup and validate a BRET-based assay useful for investigating ligand induced NOP/G-protein and NOP/β-arrestin 2 interactions. Methodological setup and validation of linked donor and acceptor couple have been previously made for demonstrating that complementation-induced BRET allows detection of the GPCR/β-arrestin interaction with high
20
signal-to-noise ratio, good dynamic range and rapid response (Molinari et al., 2008). This assay was then pharmacologically validated for MOP and DOP opioid receptors (Molinari et al., 2010), and for the β2-adrenergic receptor (Casella et al., 2011).
21
1.6. Aim of the Study
The aims of the present study were to set-up and validate two assays, the calcium mobilization assay for performing pharmacological studies at classical opioid receptors and a BRET-based assay for characterizing novel ligands by studying NOP/G-protein and NOP/β-arrestin 2 interactions . This study was also aimed to evaluate, using different in vitro pharmacological methods, the pharmacological profile of novel ligands at classical opioid and NOP receptors. In particular we investigated compounds generated in the frame of SAR studies of morphine and oxymorphone derivatives, and of endomorphin-2 cyclic pentapeptide derivatives. Similarly SAR studies were performed with both non peptide (spiroxatrine derivatives) and peptide (nociceptin/orphanin FQ(1-13)-NH2 derivatives modified in position 5). Finally innovative
ligands were characterized pharmacologically in details such as the NOP antagonist NiK-21273 and N/OFQ tetrabranched derivatives .
22
2. Material and Methods
2.1. Receptor binding and stimulation of [35S]GTPγS binding
CHO cells stably expressing human classical opioid receptors (MOP, KOP, and DOP receptors) were maintained in Nutrient F12 containing 10% FBS; CHO cells expressing human NOP receptors were maintained in DMEM/Nutrient F12 (50/50) with 5% FBS; all media were further supplemented with penicillin (100 IU/mL), streptomycin (100 μg/mL) and fungizone (2.5 μg/mL). Stock cultures additionally contained geneticin (G418) (200 μg/mL) for CHOMOP,
CHODOP, and CHOKOP, or G418 (200 μg/mL) and hygromycin B (200 μg/mL) for CHONOP cells.
For assessing receptor binding, CHONOP membranes (40 μg) were incubated in 0.5 mL of buffer
consisting of Tris (50 mM), BSA (0.5%), ∼0.8 nM [3H]UFP-101 and increasing concentrations
(1 pM - 10 μM) of ligands. Non-specific binding was determined in the presence of 1 μM N/OFQ. CHOMOP , CHODOP, and CHOKOP membranes were used at a concentration of 50 μg and
incubated in 0.5 mL buffer consisting of Tris (50 mM), BSA (0.5%), ∼0.8 nM [3
H]-diprenorphine and a range of concentrations of ligands. Non-specific binding was determined in the presence of 10 μM naloxone. For both displacement assays, reactions were incubated at room temperature for 1 h and terminated by vacuum filtration through polyethylenimine (0.5%)-soaked Whatman GF/B filters (Fisher Scientific, Loughborough, UK), using a Brandel harvester. Radioactivity was determined following an 8 h extraction of filters in ScintiSafe Gel using liquid scintillation spectroscopy.
For studying the stimulation of [35S]GTPyS binding, 40 μg of membranes taken from CHONOP
cells were incubated in 0.5 mL buffer containing Tris (50 mM), EGTA (0.2 mM), MgCl2 (1 mM), NaCl (100 mM), BSA (0.1%), bacitracin (0.15 mM), GDP (100 mM) and ∼150 pM [35S]GTPyS. NOP ligands were included in varying concentrations, and non-specific binding was determined in the presence of 10 μM GTPγS. Reactions were incubated for 1 h at 30°C with gentle shaking and terminated by vacuum filtration through dry Whatman GF/B filters. Radioactivity was determined following an 8 h extraction of filters in ScintiSafe Gel using liquid scintillation spectroscopy.
23
2.2. Calcium mobilization assay
Cell lines permanently co-expressing the NOP, MOP, or KOP receptors and the C-terminally modified Gαqi5, and cells co-expressing DOP and GαqG66Di5 were all prepared by infecting the
CHONOP, CHOMOP, CHODOP, and CHOKOP lines with a recombinant retrovirus expressing the
chimeric α subunit and the hygromycin resistance gene. Polyclonal cell lines were generated using the pantropic retroviral expression system from BD-Clontech, as described previously (Molinari et al. 2008). Stable lines were selected under hygromycin B (100 μg/ml) and geneticin (600 μg/ml active drug) for 2–3 weeks after the infection. These cell lines were maintained in Dulbecco Minimum Essential Medium (DMEM) and Ham F-12 (1:1), 2 mM L-glutamine, 200 μg/ml geneticin, 100 μg/ml hygromicin B and cultured at 37°C in 5% CO2 humidified air.
Cells were seeded at a density of 50,000 cells/well into 96-well black, clear bottom plates. After 24 h incubation, the cells were loaded with medium supplemented with 2.5 mM probenecid, 3 μM of the calcium sensitive fluorescent dye Fluo-4 AM and 0.01% pluronic acid, for 30 min at 37°C. Afterwards, the loading solution was aspirated and 100 μl/well of assay buffer: Hank’s balanced salt solution (HBSS) supplemented with 20 mM HEPES, 2.5 mM probenecid, and 500 μM Brilliant Black (Aldrich) was added. Concentrated solutions of ligands were made in distilled water (1 mM, peptide ligands) or dimethyl sulfoxide (10 mM, non-peptide ligands) and kept at −20°C. Serial dilutions were made in HBSS/HEPES (20 mM) buffer containing 0.02% BSA. Cell plate and compound plate are placed into the automatized fluorescence reader FlexStation II (Molecular Device, Union City, CA, US), and fluorescence changes were measured at 37°C. Online additions were carried out in a volume of 50 μl/well. Antagonists were incubated 15 min before the addition of the agonist. Maximum change in fluorescence, expressed in percent of baseline fluorescence, was used to determine agonist response.
2.3. BRET assay
Plasmids - Human NOP Rluc-tagged fusion proteins were made by replacing stop codons with a
sequence encoding a 10-mer linker peptide (GPGIPPARAT) and cloned into pRluc-N1 (PerkinElmer, Waltham, MA, USA). NOP-Rluc inserts were then transferred into the retroviral expression vector pQIXN (Clontech, Los Baños, Philippines). Bovine Gβ1 N-terminal-tagged
24
with RGFP (Prolume, Pinetop, USA) was built by linking the RGFP sequence without its stop codon to Ser2 of Gβ1 through a 21-mer linker peptide (EEQKLISEEDLGILDGGSGSG) and
cloned into the retroviral expression vector pQIXH. The N terminus of human β-arrestin 2 after removal of the start codon was tethered to the C terminus of RGFP through a 13-mer linker peptide (EEQKLISEEDLRT) and sub-cloned in pQIXH (Molinari et al., 2010).
Cell and Membrane Preparation - Human Embryonic Kidney (HEK293) cells were grown in
Dulbecco’s modified Eagle’s medium, supplemented with 10% (v/v) fetal calf serum, 100 units/ml penicillin G, and 100 ng/ml streptomycin sulfate, in a humidified atmosphere of 5% CO2
at 37 °C. Cell lines permanently co-expressing the different pairs of fusion proteins, i.e. NOP-RLuc/Gβ1-RGFP and NOP-RLuc/β-arrestin 2-RGFP, were prepared using the pantropic retroviral
expression system by Clontech as described previously (Molinari et al., 2008). For G-protein experiments enriched plasma membrane aliquots from transfected cells were prepared by differential centrifugation; cells were detached with PBS / EDTA solution (1 mM, pH 7.4 NaOH) then, after 5 min 500 g centrifugation, Dounce-homogenized (30 strokes) in cold homogenization buffer (TRIS 5 mM, EGTA 1 mM, DTT 1 mM, pH 7.4 HCl) in presence of sucrose (0.32 M). Three following centrifugations were performed at 1000 g (4°C) and supernatants kept. Two 25,000 g (4°C) subsequent centrifugations (the second in the absence of sucrose) were performed for separating enriched membranes that after discarding the supernatant were kept in ultrapure water at -80°C (Vachon et al., 1987). The protein concentration in membranes was determined using the QPRO - BCA kit (Cyanagen Srl, Bologna, IT) and the spectrophotometer Beckman DU 520 (Brea, CA, USA).
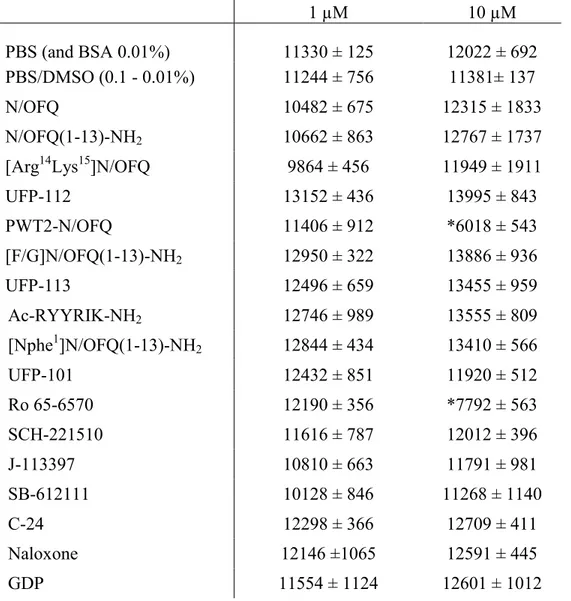
Compound interaction with luciferase activity - For assessing whether compounds affect
luciferase activity all the ligands were assayed at 1 and 10 μM employing cell membranes obtained from HEK293 expressing the human NOP-RLuc and β-arrestin 2-RGFP. 5 μM of coelenterazine were added together with membranes 15 min before readings and compounds 5 min before readings. Data were expressed as mean CPS values in 4 readings (~ 60 s delayed) using the 460(25) filter with the microplate luminometer Victor 2030 (PerkinElmer, Waltham, MA, USA).
Receptor levels - The levels of NOP fusion proteins expressed in transfected cells were
determined by measuring RLuc luminescence activity. Dilutions of cell membranes (0.1 - 4 μg) made in duplicate were counted in the Victor 2030 (PerkinElmer, Waltham, MA, USA) luminometer to detect RLuc emission; 5 μM coelenterazine was automatically injected to each
25
sample, and, after a delay of 2 s, total light emission was counted at 0.5 s intervals for 5 s. Integrated photon counts were plotted as a function of membrane protein concentration and the linear regression of the data has been analyzed.
Receptor-transducer interaction - In whole cells luminescence was recorded in 96-well sterile
poly-D-lysine-coated white opaque microplates, while in membranes it was recorded in 96-well untreated white opaque microplates (PerkinElmer, Waltham, MA, USA). For the determination of NOP/β-arrestin 2 interactions, cells co-expressing NOP-Rluc and β-arrestin 2-RGFP were plated 24 h before the experiment (100,000 cells / well). The cells were prepared for the experiment substituting the medium with Dulbecco’s phosphate buffered saline (DPBS) with 0.5 mM MgCl2 and 0.9 mM CaCl2. For the determination of NOP/G-protein interaction, membranes
(3 μg of protein) prepared from cells co-expressing NOP-Rluc and Gβ1-RGFP were added to
wells in DPBS. Coelenterazine at a final concentration of 5 μM was always injected 10 minutes prior reading the cell plate. The receptor / G-protein interaction was measured in cell membranes to exclude the involvement of other cellular processes (i.e. arrestin recruitment, internalization). Next, different concentrations of ligands in 20 μL of PBS - BSA 0.01 % (Bovine Serum Albumin, Sigma Chemical Co. (Poole, UK)) were added and incubated for an additional 5 min before reading luminescence. Signals were collected using a Victor 2030 luminometer (PerkinElmer, Waltham, MA, USA), emissions were selected using a 460(25) and a 510(10) bandpass filters for Rluc and RGFP, respectively. All the experiments were performed at room temperature. All the experiments were performed at room temperature.
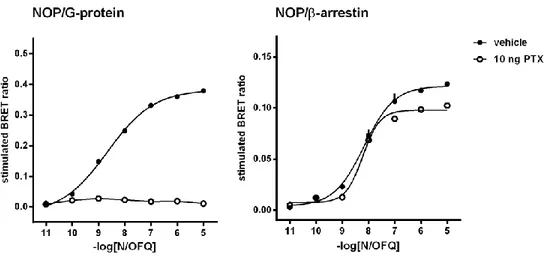
Kinetic evaluations – The effects of 100 nM N/OFQ were evaluated after 5, 10, and 15 min of
incubation in cell membranes (NOP/RLuc and Gβ1/RGFP) and living cells (NOP/RLuc and β-arrestin 2/RGFP).
Assessment of antagonist potency - Compounds that do not display agonist activity were further
evaluated as antagonists. Three types of experiments were performed i) concentration-response curves to N/OFQ in absence and in presence of a fixed concentration of antagonist, ii) concentration-response curves to N/OFQ in absence and in presence of increasing concentrations of SB-612111 (Schild analysis), iii) inhibition-response curves to SB-612111 against a fixed concentration of N/OFQ approximately corresponding to its EC80.
In pilot experiments performed in cell membranes, 15 min pre-incubation with SB-612111 100 nM, C-24 10 nM, and UFP-101 1 µM were challenged against N/OFQ by measuring BRET ratio 5 min after agonist injection. Concentration response curves to N/OFQ were rightward shifted in
26
the presence of all antagonists, the agonist maximal effect in presence of UFP-101 was not significantly different than control while in the presence of SB-612111 or C-24 the agonist maximal effect was strongly depressed. These experiments were then repeated by increasing to 15 min the time between agonist injection and the measure of BRET ratio. Under these experimental conditions all antagonists produced a rightward shift of the concentration response curve to N/OFQ without modifying agonist maximal effect. Therefore this protocol was adopted for all subsequent antagonist experiments.
2.4. Electrically Stimulated mouse Vas Deferens
Experimental procedures - Mouse vas deferens (mVD) tissues were taken from Male CD-1 mice
(Harlan, San Pietro in Natisone, Udine, Italy) which were handled according to guidelines published in the European Communities Council directives (86/609/EEC), National regulation (D.L 116/92). They were housed in 425 x 266 x 155 mm cages (Techniplast, Milan, Italy), fifteen animals/cage, under standard conditions (22ºC, 55 % humidity, 12-h light/dark cycle, light on at 7:00 am) with food and water available ad libitum.
On the day of the experiments the animals were killed by a lethal injection of urethane. From the mouse the prostatic portion of the vas deferens was isolated, and prepared according to (Hughes
et al., 1975). The tissues were suspended in 5 ml organ baths containing heated Krebs solution,
composition in mM: NaCl 118.5, KCl 4.7, KH2PO4 1.2, NaHCO3 25, glucose 10 and CaCl2 2.5.
The solution was oxygenated with 95% O2 and 5% CO2 (pH 7.4) and the temperature set at 33
°C.
Tissues were continuously stimulated through two platinum ring electrodes with supramaximal voltage rectangular pulses of 1 ms duration and 0.05 Hz frequency, with an applied resting tension of 0.3 g. The electrically evoked contractions (twitches) were measured isotonically with a strain gauge transducer (Basile 7006; Ugo Basile s.r.l., Varese, Italy). Following an equilibration period of 60 min, the contractions induced by electrical field stimulation were stable. At this time, cumulative concentration-response curves were performed by sub sequentially addition of increasing concentrations of the ligand to the same buffer, stabilization of each concentration-mediated effect was allowed prior the injection of the following higher
27
concentration. Antagonists were evaluated against the concentration-response curve to the agonist following 15 min of pre-incubation.
Instruments - For bioassays two chamber-glass bathes for isolated organs were utilized. The outer
chamber contains water heated at 33, while the inner chamber contains 5 ml of oxygenated Krebs solution. One end of the tissue is fixed to the bottom side of the inner chamber and the other end is linked to a force transducer by a surgery thread. The role of the transducer is to convert the mechanical signal in electrical signal, then amplified and recorded with a PC-based acquisition system Power Lab 4/25 (model ML845, ADInstruments, USA).
2.5. Data analysis and terminology
All data are expressed as the mean ± standard error of the mean (SEM) of n experiments. For potency values 95% confidence limits were indicated. Data have been statistically analyzed with one way ANOVA followed by the Dunnett’s test for multiple comparisons; p values less than 0.05 were considered to be significant.
Receptor binding data are expressed as % displacement. Stimulation of [35S]GTPγS binding data are expressed as stimulation factor that is the ratio between specific agonist stimulated [35S]GTPγS binding and basal specific binding. In calcium mobilization experiments, maximum change in fluorescence, expressed as percent over the baseline fluorescence, was used to determine agonist response. BRET data are computed as stimulated BRET ratio units, i.e. the ratio between CPS from RGFP and RLuc in the presence of ligands, followed by baseline subtraction, i.e. the BRET value in the absence of ligand. Maximal agonist effects (Emax) were
expressed as fraction of the N/OFQ Emax which was determined in every assay plate and reported
in the graphs as E / Emax. BRET ratio are obtained between CPS measured for the RGFP and
RLuc light emitted using 460(25) and 510(10) filters (PerkinElmer, Waltham, MA, USA), respectively. Electrically stimulated tissues data are expressed as % of the control twitch induced by electrical field stimulation.
Affinity values are showed as pKi calculated using the Cheng-Prusoff equation:
28
Where IC50 is the concentration of antagonist that produces 50% inhibition of the agonist
response, [L] is the concentration of free radioligand, and KD is the dissociation constant of the
radioligand for the receptor.
Agonist potencies are given as pEC50 i.e. the negative logarithm to base 10 of the molar
concentration of an agonist that produces 50% of the maximal effect of that agonist. Maximal effects elicited by the agonists are expressed as intrinsic activity α using N/OFQ as standard full agonist. Concentration-response curves to agonists were fitted to the classical four-parameter logistic nonlinear regression model:
Effect = Baseline + (Emax - Baseline) / (1+10^((LogEC50 – Log[compound]) HillSlope))
Curves fitting were performed using PRISM 5.0 (GraphPad Software In., San Diego, USA). EC50 is the concentration of agonist producing a 50% maximal response and n is the Hill
coefficient of the concentration-response curve to the agonist.
Antagonist potencies were derived in functional experiments in inhibition response experiments as pKB, which was calculated as the negative logarithm to base 10 of the KB from the following
equation:
KB = IC50 / ([2 + ([A] / EC50)n]1/n – 1),
where IC50 is the concentration of antagonist that produces 50% inhibition of the agonist
response, [A] is the concentration of agonist, EC50 is the concentration of agonist producing a
50% maximal response and n is the slope coefficient of the concentration-response curve to the agonist (Kenakin, 2014). When antagonists were assayed at a single concentration against the concentration-response curve to the agonist their pKB was derived with the following equation:
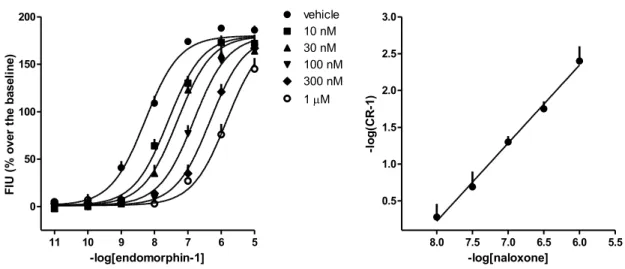
pKB = log(CR - 1) - log[A]
where CR is the ratio between agonist potency (expressed as EC50) in the presence and absence
of antagonist and [A] is the molar concentration of antagonist. The type of antagonism exerted by antagonists was assayed by using the classical Schild analysis. The Schild plot was analyzed by linear regression to derive the pA2 value of the antagonist.
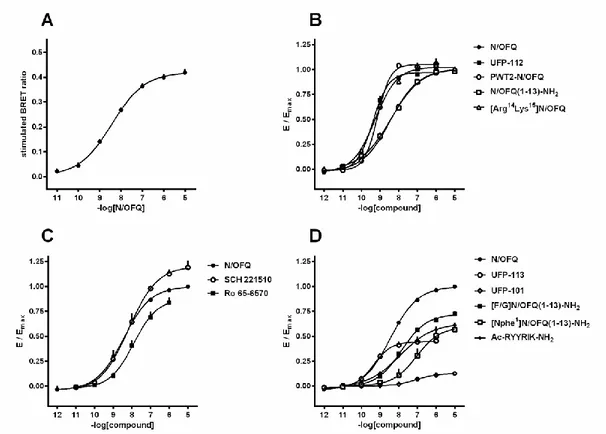
To quantify the differences of agonist efficacies for G protein and arrestin interactions the Bias factors were calculated by choosing the endogenous NOP ligand N/OFQ as standard unbiased ligand. For this analysis, the Emax and EC50 of the agonist were derived using a 3-parameters
logistic model with unitary slope values. In fact, although several agonist curves displayed slope values different from 1, on refitting the curves with the parameter fixed to unity did not produce a
29
statistically significant reduction of the goodness of fit (extra-sum of squares principle (DeLean
et al., 1978)). Under such conditions, the relative ratio (Emax/EC50)lig / (Emax/EC50)N/OFQ is
equivalent to the relative (/K)lig/(/K)N/OFQ ratio as defined by the operational model (Black &
Leff, 1983; Griffin et al., 2007), and represents the ratio of both intrinsic efficacy (i.e., as defined in (Furchgott, 1966)) and binding affinity of the ligands with respect to the reference agonist (Kenakin & Beek, 1982; Onaran et al., 2014). By taking ratios of these values between G protein and arrestin can cancel the common K and yield the ratio of ligand intrinsic efficacy across the two transduction proteins. Thus, the following formula was used for calculating agonist bias factors in log10 units:
Bias factor =
30
3. Results
3.1. Novel assays
3.1.1. Pharmacological studies on classical opioid receptors coupled with calcium signaling via chimeric G proteins.
In order to extent the use of the calcium mobilization assay performed on cells expressing chimeric G proteins from the NOP receptor (Camarda et al., 2009) to classical opioid receptors, a panel of standard opioid ligands has been assessed. The results obtained with these compounds were compared to those described in literature with classical assays for Gi coupled receptors. The
overall aim of these series of experiments was to set up and validate experimental conditions in order to use this assay for the pharmacological characterization of novel opioid receptor ligands.
MOP receptor - Concentration-response curves to dermorphin and endomorphin-1 (EM-1) were performed in CHO cells stably co-expressing the human MOP receptor and the Gαqi5 chimeric G
protein. Dermorphin and EM-1 exhibited similar maximal effects (Emax ≈ 200 % over the basal)
and pEC50 values (8.19 (8.11-8.27) and 8.00 (7.92-8.09), respectively (Figure 9).
5 6 7 8 9 10 11 0 50 100 150 200 250 EM-1 dermorphin -log[agonist] F IU ( % o ve r th e b as el in e)
Figure 9. Concentration-response curve to dermorphin and EM-1 in calcium mobilization experiments
performed on CHOMOP cells stably expressing the Gαqi5 protein. Agonist effects were expressed as % over the baseline. Data are the mean of 4 separate experiments performed in duplicate.