S1
Supporting Information
Thiazolo[5,4-d]thiazole-based organic sensitizers with improved spectral
properties for application in greenhouse-integrated dye-sensitized solar cells
Alessio Dessì,*
,aMassimo Calamante,
a,bAdalgisa Sinicropi,
a,c,dMaria Laura Parisi,
cLuigi Vesce,
ePaolo Mariani,
eBabak Taheri,
eManuela Ciocca,
eAldo Di Carlo,
eLorenzo Zani,
aAlessandro
Mordini,
a,bGianna Reginato*
,aa
Institute of Chemistry of Organometallic Compounds (CNR-ICCOM), Via Madonna del Piano 10,
50019 Sesto Fiorentino (Italy), email:
[email protected]
,
[email protected]
;
bDepartment of Chemistry “U. Schiff”, University of Florence, Via della Lastruccia 13, 50019 Sesto
Fiorentino (Italy);
cDepartment of Biotechnology, Chemistry and Pharmacy, University of Siena, Via
A. Moro 2, 53100 Siena (Italy);
dCSGI, Consorzio per lo Sviluppo dei Sistemi a Grande Interfase, via
della Lastruccia 3, 50019 Sesto Fiorentino, Italy;
eCenter for Hybrid and Organic Solar Energy
(C.H.O.S.E.), Department of Electronic Engineering, University of Rome Tor Vergata, Via del
Politecnico 1, 00133 Rome (Italy).
Table of Contents
1. Experimental section………. S2
2. Computational data for compounds TTZ8-12………....………. S8
3. Spectroscopic and electrochemical characterization of compounds TTZ8-12……….…. S14
4. Optimized DSSC performances with dye TTZ8………. S18
5. Copies of
1H and
13C NMR spectra of compounds 7, 16-20, TTZ8-12….………..….. S19
6. References………. S41
Electronic Supplementary Material (ESI) for Sustainable Energy & Fuels.
This journal is © The Royal Society of Chemistry 2020
S2
1. Experimental section
Materials and methodsUnless otherwise stated, all reagents were purchased from commercial suppliers and used without purification. Compound 1 and bromide 2 were prepared as previously reported.[1] All air-sensitive reactions were performed using Schlenk techniques. Solvents used in cross-coupling reactions were previously degassed by means of the “freeze-pump-thaw” method. CH2Cl2 was distilled over CaH2, THF was distilled over metallic sodium and toluene was dried on a resin exchange Solvent Purification System (MBraun). Petroleum ether, unless specified, is the 40-70°C boiling fraction. Reactions were monitored by TLC using silica gel 60 F254 aluminum sheet (Merck), detection was made using a KMnO4 basic solution or UV lamp. Organic phase derived from aqueous work-up were dried over Na2SO4. Flash column chromatography was performed using glass columns (10-50 mm wide) and Silica Gel 60 (230-400 mesh). 1H-NMR spectra were recorded at 300 or 400 MHz, and 13C-NMR spectra were recorded at 75.5 or 100.6 MHz, respectively, on Bruker Avance or Varian Mercury series instruments. Chemical shifts were referenced to the residual solvent peak (CDCl3, δ 7.26 ppm for 1H-NMR and δ 77.16 ppm for 13C-NMR; CD2Cl2, δ 5.32 ppm for 1H-NMR and δ 53.84 ppm for 13C-NMR; THF-d8 δ 1.72 and 3.58 ppm for 1H-NMR, δ 67.21 and 25.31 ppm for 13C-NMR; C6D6, δ 7.16 ppm for 1H-NMR, δ 128.06 ppm for 13C-NMR; DMSO-d6 δ 2.50 ppm for 1H-NMR, δ 39.52 ppm for 13C-NMR;). Coupling constants (J) were reported in Hz. ESI-MS analyses were recoded with LCQ-Fleet Ion-Trap Mass Spectrometer (Thermo). HR-MS analyses were performed at CISM (Mass Spectrometry Center – University of Florence) using a LTQ Orbitrap FT- MS Spectrometer (Thermo). FT-IR spectra were recorded with a Perkin-Elmer Spectrum BX instrument in the range 4000-400 cm–1 with a 2 cm–1 resolution.
Synthethic Procedures
4-(7-Bromobenzo[c][1,2,5]thiadiazol-4-yl)benzaldehyde (3). Pd2(dba)3.CHCl3 (5.2 mg, 0.050 mmol, 2.5 mol%) and 1,1’-bis(diphenylphosphino)ferrocene (55 mg, 0.100 mmol, 5.0 mol%) were dissolved in THF (6.0 mL). The mixture was stirred at room
temperature for 10 minutes, then 4,7-dibromobenzo[c][1,2,5]thiadiazole (9, 0.880 g, 3.0 mmol, 1.5 eq.), 4-formylphenylboronic acid (8, 0.300 g, 2.0 mmol, 1.0 eq.) and a 2M aqueous solution of K2CO3 (0.552 g, 2.0 mL, 4.0 mmol, 2.0 eq.) were added. The resulting mixture was stirred at 90 °C for 16 hours, then, after cooling to room temperature, the solvent was removed under reduced pressure. The crude was dissolved in CH2Cl2 (100 mL) and washed with water (100 mL) and brine (100 mL), then the organic layer was dried with sodium sulfate. After filtration and removal of the solvent under vacuum, the crude was purified by flash column chromatography (petroleum ether / dichloromethane gradient 1:1 to 1:3). Pure aldehyde 3 (0.358 g, 1.12 mmol, 56% yield) was isolated as a yellow solid. 1H–NMR (400 MHz, CDCl3): δ = 10.11 (s, 1H), 8.01–8.13 (m, 4H), 7.98 (d, J = 7.6 Hz, 1H), 7.66 (d, J = 7.6 Hz, 1H) ppm. The analytical data were in agreement with those reported in the literature.[2]
5-(7-Bromobenzo[c][1,2,5]thiadiazol-4-yl)thiophene-2-carbaldehyde (4). Pd(OAc)2 (5.6 mg, 0.025 mmol, 2.5 mol%), CataCXium® A (18 mg, 0.050 mmol, 5.0 mol%), pivalic acid (31 mg, 0.30 mmol, 30 mol%), K2CO3 (0.207 g, 1.5 mmol, 1.5 eq.), 2-thiophenecarboxaldehyde (10, 0.112 g, 1.0 mmol, 1.0 eq.) and 4,7-dibromobenzo[c][1,2,5]thiadiazole (9, 0.441 g, 1.5 mmol, 1.5 eq.) were mixed with toluene (10 mL). The resulting mixture was heated up to 110 °C and stirred for 16 hours, then cooled down to room temperature. The crude was filtered over Celite® and washed with chloroform. The filtrate was evaporated and purified by flash column chromatography (petroleum ether / dichloromethane gradient 2:1 to 1:2, then dichloromethane), which afforded pure aldehyde 4 (95 mg, 0.29 mmol, 29% yield) as a dark yellow solid. 1H–NMR (300 MHz, DMSO-d6): δ = 10.00 (s, 1H), 8.27 (d, J = 3.7 Hz, 1H), 8.21 (d, J = 7.4 Hz, 1H), 8.11–8.17 (m, 2H) ppm. The analytical data were in agreement with those reported in the literature.[3]
5-(Tributylstannyl)furan-2-carbaldehyde (12). N,O-dimethyl-hydroxylamine hydrochloride (0.634 g, 6.5 mmol, 1.3 eq.) was dissolved in THF (25 mL) then, after cooling to –40 °C, n-buthyllithium 1.6 M in hexane (8.13 mL, 13.0 mmol, 2.6 eq.) was added. The resulting solution was stirred at –40 °C for 30 minutes, then furfural (11, 0.480 g, 5.0 mmol, 0.414 mL, 1.0 eq.) was added to the reaction mixture. After additional 60 minutes at –40 °C, a second portion of n-buthyllithium 1.6 M in hexane (4.69 mL, 7.5 mmol, 1.5 eq.) was added and the solution turned yellow, then, after stirring at –40 °C for 60 minutes, tributyltin chloride (1.95 g, 6.0 mmol, 1.63 mL, 1.2 eq.) was added. The solution was warmed up to room temperature and left under stirring for 16 hours, then a saturated aqueous solution of ammonium chloride (50 mL) was added. The reaction mixture was extracted with ethyl acetate (2 × 100 mL), then the combined organic phases were washed with satd. aq. NaCl (100 mL) and dried over Na2SO4. After filtration and removal of the solvent under reduced pressure, the crude was purified by flash column chromatography (petroleum ether / ethyl acetate gradient from 100/0 to 95/5), which afforded pure stannane 12 (1.14 g, 3.0 mmol, 59% yield) as a yellow oil. 1H–NMR (400 MHz, CDCl3): δ = 9.66 (s, 1H), 7.24 (d, J = 3.5 Hz, 1H), 6.69 (d, J = 3.4 Hz, 1H), 1.55 (q, J = 7.2 Hz, 6H), 1.27–1.38 (m, 6H), 1.12–1.19 (m, 6H), 0.89 (t, J = 7.3 Hz, 9H) ppm. The analytical data were in agreement with those reported in the literature.[4] 5-(7-Bromobenzo[c][1,2,5]thiadiazol-4-yl)furan-2-carbaldehyde (5). 5-(tributylstannyl)furan-2-carbaldehyde (12, 0.193 g, 0.5 mmol, 1.0 eq.) was dissolved in toluene (5.0 mL) together with 4,7-dibromobenzo[c][1,2,5]thiadiazole (9, 0.147 g, 0.5 mmol, 1.0 eq.) and [Pd(PPh3)4] (29 mg, 0.025 mmol, 5.0 mol%). The mixture was stirred at 110 °C for 24 hours, then, after cooling to room temperature and removal of the solvent under reduced pressure, flash column chromatography (petroleum ether / dichloromethane gradient 3:1 to 1:1, then dichloromethane) afforded pure aldehyde 5 (53 mg, 0.17 mmol, 34% yield) as a bright yellow solid. 1H–NMR (300 MHz, CDCl3): δ = 9.74 (s, 1H), 8.15 (d, J = 7.3 Hz, 1H), 7.95 (d, J = 7.6 Hz, 1H), 7.88 (d, J = 2.9 Hz, 1H), 7.43 (d, J = 2.9 Hz, 1H) ppm. The analytical data were in agreement with those reported in the literature.[5]
S3
4-Hexyl-4H-dithieno[3,2-b:2',3'-d]pyrrole (14). Pd2(dba)3.CHCl3 (0.247 g, 0.239 mmol, 2.5 mol%) and (±)-2,2′-bis(diphenylphosphino)-1,1′-binaphthalene (0.596 g, 0.100 mmol, 5.0 mol%) were dissolved in toluene (60 mL). The resulting mixture
was stirred at room temperature for 10 minutes, then 3,3’-dibromo-2,2’-bithiophene (13, 3.08 g, 9.56 mmol, 1.0 eq.), 1-hexylamine (1.06 g, 10.52 mmol, 1.39 mL, 1.1 eq.) and sodium tert-butoxide (2.32 g, 23.9 mmol, 2.5 eq.) were added. The reaction mixture was left under stirring at 110 °C for 16 hours, then cooled to room temperature. The reaction crude was filtered over Celite® and washed with ethyl acetate (200 mL), then the organic phase was washed with water (150 mL) and brine (150 mL). After anhydrification over sodium sulfate, filtration and removal of the solvent under vacuum, the crude was purified by flash column chromatography (petroleum ether, then petroleum ether / ethyl acetate 100:1), which afforded pure compound 14 (2.23 g, 8.47 mmol, 89% yield) as a white solid. 1H–NMR (300 MHz, CDCl3): δ = 7.14 (d, J = 5.1 Hz, 2H), 7.01 (d, J = 5.1 Hz, 2H), 4.21 (t, J = 7.3 Hz, 2H), 1.87 (q, J = 7.2 Hz, 2H), 1.23–1.40 (m, 6H), 0.81–0.94 (m, 3H) ppm. The analytical data were in agreement with those reported in the literature.[6] 4-Hexyl-4H-dithieno[3,2-b:2',3'-d]pyrrole-2-carbaldehyde (15). N,N-dimethylformamide (0.61 g, 8.35 mmol, 0.65 mL, 1.0 eq.) was cooled down to 0 °C, then POCl3 (6.40 g, 41.7 mmol, 3.83 mL, 5.0 eq.) and a solution of compound 14 (2.20 g, 8.35 mmol, 1.0 eq.) in dichloromethane (80 mL) were added dropwise during 20 minutes. The reaction mixture was warmed to room temperature, stirred at 50 °C for 16 hours, then poured into a NaOH 1M aqueous solution (100 mL) at 0 °C. The resulting mixture was stirred at room temperature for 5 hours. The two phases were separated, the organic phase was washed with brine (100 mL), then dried over sodium sulfate. Filtration and removal of the solvent under vacuum afforded pure aldehyde 15 (2.40 g, 8.24 mmol, 99% yield) as a yellow solid. No further purification was needed. 1H–NMR (300 MHz, CDCl3): δ = 9.87 (s, 1H), 7.65 (s, 1H), 7.38 (d, J = 5.1 Hz, 1H), 7.02 (d, J = 5.1 Hz, 1H), 4.22 (t, J = 7.3 Hz, 2H), 1.88 (q, J = 7.3 Hz, 2H), 1.22–1.41 (m, 6H), 0.81–0.94 (m, 3H) ppm. The analytical data were in agreement with those reported in the literature.[6]
6-Bromo-4-hexyl-4H-dithieno[3,2-b:2',3'-d]pyrrole-2-carbaldehyde (6). Compound 15 (0.146 g, 0.5 mmol, 1.0 eq.) was dissolved in chloroform (5.0 mL), then, after cooling to 0 °C, N-bromosuccinimide (0.089 g, 0.5 mmol, 1.0 eq.) was added in small portions. The reaction mixture was stirred at room temperature for 16 hours. After dilution with dichloromethane (50 mL), the organic phase was washed with a saturated NaHCO3 aqueous solution (50 mL) and brine (50 mL), then dried over sodium sulfate. Filtration and removal of the solvent under vacuum afforded pure bromide 6 (0.182 g, 0.49 mmol, 98% yield) as a yellow solid. No further purification was needed. 1H–NMR (300 MHz, CDCl3): δ = 9.83 (s, 1H), 7.58 (s, 1H), 7.03 (s, 1H), 4.13 (t, J = 7.0 Hz, 2H), 1.82 (q, J = 6.6 Hz, 2H), 1.17– 1.38 (m, 6H), 0.79–0.91 (m, 3H) ppm. The analytical data were in agreement with those reported in the literature.[6]
6-(7-Bromobenzo[c][1,2,5]thiadiazol-4-yl)-4-hexyl-4H-dithieno[3,2-b:2',3'-d]pyrrole-2-carbaldehyde (7). Compound 6 (0.217 g, 0.745 mmol, 1.0 eq.), Pd(OAc)2 (3.3 mg, 0.015 mmol, 2.0 mol%), CataCXium® A (11 mg, 0.03 mmol, 4.0 mol%), pivalic acid (23 mg, 0.223 mmol, 30 mol%), Cs2CO3 (0.364 g, 1.12 mmol, 1.5 eq.) and 4,7-dibromobenzo[c][1,2,5]thiadiazole (0.328 g, 1.12 mmol, 1.5 eq.) were dissolved in toluene (3.5 mL). The reaction mixture was stirred at 110 °C for 16 hours, cooled down to room temperature and filtered over Celite®. The filter cake was washed with dichloromethane (50 mL), the filtrate was evaporated under vacuum, then flash column chromatography (petroleum ether / dichloromethane gradient 1:1 to 1:3, then dichloromethane) afforded pure compound 7 (0.148 g, 0.293 mmol, 39% yield) as an orange solid. 1H–NMR (300 MHz, CDCl3): δ = 9.91 (s, 1H), 8.29 (s, 1H), 7.88 (d, J = 8.1 Hz, 1H), 7.75 (d, J = 7.3 Hz, 1H), 7.66 (s, 1H), 4.32 (t, J = 6.2 Hz, 2H), 1.87–2.03 (m, 2H), 1.24–1.46 (m, 6H), 0.81–0.95 (m, 3H) ppm; 13C–NMR (75 MHz, CDCl3): δ = 183.1, 154.1, 151.7, 149.7, 145.1, 141.4, 141.1, 132.5, 127.7, 125.8, 119.3, 115.6, 114.7, 113.0, 112.7, 47.7, 31.5, 30.5, 26.8, 22.6, 14.2 ppm; IR (KBr): 𝜈̃ = 3066, 2925, 2853, 2803, 1649, 1533, 1491, 1389, 1355, 1219, 1185, 1140, 811 cm–1; ESI–MS: m/z = 568.20 [M + CH3CN + Na]+.
General procedure for the preparation of compounds 16-20.
Compound 1 (1.0 eq.), palladium acetate (5.0 mol%), CataCXium® A (10 mol%), acetic acid (30 mol%), potassium carbonate (1.5 eq.) and bromide 2 (1.5 eq.) were stirred in toluene at 95 °C for 24 hours, then again palladium acetate (5.0 mol%), CataCXium® A (10 mol%), pivalic acid (30 mol%), potassium carbonate (1.5 eq.) and the appropriate bromide 3-7 (1.5 eq.) were added to the reaction mixture, which was heated up to 110 °C. After additional 24 hours, the reaction mixture wascooled down to room temperature, diluted with toluene (25 mL) and filtered over Celite®. After evaporation of the solvent, the reaction crude was purified by flash column chromatography.
4-(7-(8-(5-(8-(4-(Bis(4-(hexylthio)phenyl)amino)phenyl)-3,3-dipentyl-3,4-dihydro-2H-thieno[3,4-b][1,4]dioxepin-6-yl)thiazolo
[5,4-d]thiazol-2-yl)-3,3-dipentyl-3,4-dihydro-2H-thieno[3,4-b] [1,4]dioxepin-6-yl)benzo[c][1,2,5]thiadiazol-4-yl)benzaldehyde (16).
According to the general procedure, thiazolothiazole 1 (100 mg, 0.137 mmol), Pd(OAc)2 (1.5 mg, 6.8×10⁻³ mmol), CataCXium® A (4.9 mg, 0.014 mmol), acetic acid (2.5 mg, 0.041 mmol, 2.3 μL), K2CO3 (28 mg, 0.205 mmol) and bromide 2 (114 mg, 0.205 mmol) were dissolved in toluene (4 mL) and reacted at 95 °C. After 24 hours, Pd(OAc)2 (1.5 mg, 6.8×10⁻³ mmol), CataCXium® A (4.9 mg, 0.014 mmol), pivalic acid (4.2 mg, 0.041 mmol), K2CO3 (28 mg, 0.205 mmol) and bromide 3 (65 mg, 0.205 mmol) were added and reacted at 110 °C. Flash column chromatography (petroleum ether / toluene 1:1, then toluene) afforded pure product 16 (62 mg, 0.043 mmol, 31% yield) as a dark-purple amorphous solid: 1H–NMR (400 MHz, CD
2Cl2): δ = 9.99 (s, 1H), 8.44 (d, J = 7.6 Hz, 1H), 8.11 (d, J = 8.2 Hz, 2H), 7.88 (d, J = 7.6 Hz, 2H), 7.67 (d, J = 7.6 Hz, 1H), 7.55 (d, J = 8.2 Hz, 2H), 7.25 (d, J = 8.2 Hz, 4H), 6.95–7.08 (m, 6H), 4.21 (s, 2H), 4.18 (s, 2H), 4.04 (s, 2H), 3.88 (s, 2H), 2.90 (t, J = 6.9 Hz, 4H), 1.28–1.69 (m, 48H), 0.86–1.01 (m, 18H) ppm; 13C–NMR (100 MHz, CD 2Cl2): δ = 191.9, 159.3, 158.7, 153.5, 153.0, 151.0, 150.8, 149.6, 148.7, 148.3, 147.2, 145.6, 145.5, 143.2, 136.0, 131.6, 130.9, 130.3, 129.94, 129.90, 129.4, 127.8, 127.1, 126.9, 126.0, 125.4, 124.0, 123.1, 119.6, 119.0, 114.1, 78.4, 78.3, 78.2, 78.0, 44.23, 44.18, 34.7, 33.2,
S4
33.1, 32.5, 32.4, 31.8, 29.7, 28.9, 23.06, 23.02, 22.98, 22.94, 14.33, 14.30, 14.23 ppm; IR (KBr): 𝜈̃ = 3025, 2925, 2853, 2725, 1695, 1577, 1483, 1263, 1050, 823 cm–1; ESI–MS: m/z = 1443.89 [M]+.
5-(7-(8-(5-(8-(4-(Bis(4-(hexylthio)phenyl)amino)phenyl)-3,3-dipentyl-3,4-dihydro-2H-thieno[3,4-b][1,4]dioxepin-6-yl)thiazolo
[5,4-d]thiazol-2-yl)-3,3-dipentyl-3,4-dihydro-2H-thieno[3,4-b][1,4] dioxepin-6-yl)benzo[c][1,2,5]thiadiazol-4-yl)thiophene-2-carbaldehyde (17). According to the general procedure, thiazolothiazole 1 (150 mg, 0.205 mmol), Pd(OAc)2 (2.3 mg, 0.010 mmol), CataCXium® A (7.4 mg, 0.021 mmol), acetic acid (3.7 mg, 0.062 mmol, 3.5 μL), K2CO3 (43 mg, 0.308 mmol) and bromide 2 (171 mg, 0.308 mmol) were dissolved in toluene (6 mL) and reacted at 95 °C. After 24 hours, Pd(OAc)2 (2.3 mg, 0.010 mmol), CataCXium® A (7.4 mg, 0.021 mmol), pivalic acid (6.3 mg, 0.062 mmol), K2CO3 (43 mg, 0.308 mmol) and bromide 4 (100 mg, 0.308 mmol) were added and reacted at 110 °C. Flash column chromatography (petroleum ether / toluene gradient 1:1 to 1:3, then toluene) gave pure product 17 (105 mg, 0.072 mmol, 35% yield) as a black amorphous solid: 1H–NMR (400 MHz, C6D6): δ = 9.59 (s, 1H), 8.37 (d, J = 7.6 Hz, 1H), 7.98 (d, J = 3.8 Hz, 1H), 7.83 (d, J = 8.2 Hz, 2H), 7.51 (d, J = 7.6 Hz, 1H), 7.27 (d, J = 8.2 Hz, 4H), 7.10 (d, J = 3.8 Hz, 1H), 7.08 (d, J = 8.2 Hz, 2H), 7.01 (d, J = 8.2 Hz, 4H), 3.94 (s, 2H), 3.88 (s, 2H), 3.79 (s, 2H), 3.70 (s, 2H), 2.72 (t, J = 7.3 Hz, 4H), 1.50–1.73 (m, 4H), 1.08–1.42 (m, 44H), 0.90–1.02 (m, 12H), 0.86 (t, J = 7.3 Hz, 6H) ppm; 13C–NMR (100 MHz, CD2Cl2): δ = 183.1, 159.4, 158.7, 152.6, 152.3, 151.2, 151.0, 149.7, 149.2, 148.8, 148.3, 147.3, 145.8, 145.6, 143.6, 137.1, 131.8, 131.1, 128.1, 127.9, 127.1, 126.7, 126.6, 126.5, 125.6, 124.3, 123.7, 123.3, 120.3, 119.2, 114.2, 78.6, 78.4, 78.3, 78.1, 44.4, 34.9, 33.4, 33.3, 32.7, 32.6, 32.0, 29.8, 29.1, 23.24, 23.20, 23.15, 14.50, 14.48, 14.39 ppm; IR (KBr): 𝜈̃ = 3025, 2925, 2852, 1700, 1654, 1490, 1261, 1088, 811 cm–1; ESI–MS: m/z = 1451.09 [M+H]+. 5-(7-(8-(5-(8-(4-(Bis(4-(hexylthio)phenyl)amino)phenyl)-3,3-dipentyl-3,4-dihydro-2H-thieno[3,4-b][1,4]dioxepin-6-yl)thiazolo [5,4-d]thiazol-2-yl)-3,3-dipentyl-3,4-dihydro-2H-thieno[3,4-b] [1,4]dioxepin-6-yl)benzo[c][1,2,5]thiadiazol-4-yl)furan-2-carbaldehyde (18). According to the general procedure, thiazolothiazole 1 (100 mg, 0.137 mmol), Pd(OAc)2 (1.5 mg, 6.8×10⁻³ mmol), CataCXium® A (4.9 mg, 0.014 mmol), acetic acid (2.5 mg, 0.041 mmol, 2.3 μL), K2CO3 (28 mg, 0.205 mmol) and bromide 2 (114 mg, 0.205 mmol) were dissolved in toluene (4 mL) and reacted at 95 °C. After 24 hours, Pd(OAc)2 (1.5 mg, 6.8×10⁻³ mmol), CataCXium® A (4.9 mg, 0.014 mmol), pivalic acid (4.2 mg, 0.041 mmol), K2CO3 (28 mg, 0.205 mmol) and bromide 5 (63 mg, 0.205 mmol) were added and reacted at 110 °C. Flash column chromatography (petroleum ether / toluene 1:1, then toluene) afforded pure product 18 (60 mg, 0.042 mmol, 31% yield) as a black amorphous solid: 1H–NMR (400 MHz, CD2Cl2): δ = 9.27 (s, 1H), 8.29 (d, J = 7.6 Hz, 1H), 7.80 (d, J = 8.2 Hz, 1H), 7.56–7.63 (m, 1H), 7.43 (d, J = 7.6 Hz, 2H), 7.21 (d, J = 7.6 Hz, 4H), 7.08–7.13 (m, 1H), 6.99 (d, J = 7.6 Hz, 4H), 6.89 (d, J = 7.6 Hz, 2H), 4.18 (s, 4H), 4.05 (s, 2H), 3.92 (s, 2H), 2.87 (t, J = 6.9 Hz, 4H), 1.54–1.68 (m, 8H), 1.25– 1.52 (m, 40H), 0.92–1.02 (m, 12H), 0.84–0.91 (m, 6H) ppm; 13C–NMR (100 MHz, CD2Cl2): δ =177.0, 159.1, 158.5, 155.2, 152.4, 152.1, 151.4, 151.0, 150.8, 149.5, 149.1, 148.1, 147.1, 145.7, 145.4, 131.7, 131.1, 127.8, 127.0, 126.5, 126.4, 125.6, 124.0, 123.2, 120.3, 119.2, 119.1, 114.2, 114.1, 78.6, 78.3, 78.2, 78.0, 44.4, 34.9, 33.4, 33.3, 32.7, 32.6, 32.0, 29.8, 29.1, 23.3, 23.2, 23.1, 14.53, 14.50, 14.4 ppm; IR (KBr): 𝜈̃ = 3025, 2925, 2854, 1671, 1577, 1484, 1265, 1048 cm–1; ESI–MS: m/z = 1434.57 [M+H]+. 6-(8-(5-(8-(4-(Bis(4-(hexylthio)phenyl)amino)phenyl)-3,3-dipentyl-3,4-dihydro-2H-thieno[3,4-b][1,4]dioxepin-6-yl) thiazolo[5,4-
d]thiazol-2-yl)-3,3-dipentyl-3,4-dihydro-2H-thieno[3,4-b][1,4]dioxepin-6-yl)-4-hexyl-4H-dithieno[3,2-b:2',3'-d]pyrrole-2-carbaldehyde (19). According to the general procedure, thiazolothiazole 1 (150 mg, 0.205 mmol), Pd(OAc)2 (2.3 mg, 0.010 mmol), CataCXium® A (7.4 mg, 0.021 mmol), acetic acid (3.7 mg, 0.062 mmol, 3.5 μL), K2CO3 (43 mg, 0.308 mmol) and bromide 2 (171 mg, 0.308 mmol) were dissolved in toluene (6 mL) and reacted at 95 °C. After 24 hours, Pd(OAc)2 (2.3 mg, 0.010 mmol), CataCXium® A (7.4 mg, 0.021 mmol), pivalic acid (6.3 mg, 0.062 mmol), K2CO3 (43 mg, 0.308 mmol) and bromide 6 (114 mg, 0.308 mmol) were added and reacted at 110 °C. Flash column chromatography (petroleum ether / toluene gradient 2:1 to 1:3, then toluene) gave pure product 19 (65 mg, 0.043 mmol, 21% yield) as a purple gummy solid: 1H–NMR (400 MHz, CD2Cl2): δ = 9.69 (s, 1H), 7.55 (d, J = 8.8 Hz, 2H), 7.47 (s, 1H), 7.24 (d, J = 8.8 Hz, 4H), 6.99–7.03 (m, 5H), 6.97 (d, J = 8.8 Hz, 2H), 4.08–4.19 (m, 8H), 3.99 (s, 2H), 2.89 (t, J = 7.3 Hz, 4H), 1.81–1.91 (m, 2H), 1.65 (q, J = 7.4 Hz, 4H), 1.25–1.52 (m, 50H), 0.86–0.98 (m, 21H) ppm; 13C–NMR (100 MHz, CD2Cl2): δ = 182.7, 159.4, 158.3, 150.9, 150.7, 149.6, 148.9, 148.6, 147.1, 145.9, 145.6, 145.4, 144.9, 140.6, 137.4, 131.6, 131.0, 129.4, 128.5, 127.9, 126.9, 125.6, 125.4, 124.2, 123.2, 122.9, 119.7, 119.6, 115.5, 115.2, 114.2, 106.7, 78.7, 78.5, 78.3, 78.1, 47.8, 44.4, 44.3, 34.7, 33.1, 32.3, 31.81, 31.78, 30.6, 29.7, 28.9, 27.1, 23.02, 23.01, 22.97, 14.3, 14.2 ppm; IR (KBr): 𝜈̃ = 3070, 2926, 2855, 1649, 1489, 1370, 1180, 1058 cm–1; ESI–MS: m/z = 1494.13 [M]+. 6-(7-(8-(5-(8-(4-(Bis(4-(hexylthio)phenyl)amino)phenyl)-3,3-dipentyl-3,4-dihydro-2H-thieno[3,4-b][1,4]dioxepin-6-yl) thiazolo[5,4-d]thiazol-2-yl)-3,3-dipentyl-3,4-dihydro-2H-thieno [3,4-b][1,4]dioxepin-6-yl)benzo[c][1,2,5]thiadiazol-4-yl)-4-hexyl-4H-dithieno[3,2-b:2',3'-d]pyrrole-2-carbaldehyde (20). According to the general procedure, thiazolothiazole 1 (120 mg, 0.164 mmol), Pd(OAc)2 (1.8 mg, 8.2×10⁻³ mmol), CataCXium® A (5.9 mg, 0.016 mmol), acetic acid (3.0 mg, 0.049 mmol, 2.8 μL), K2CO3 (34 mg, 0.246 mmol) and bromide 2 (171 mg, 0.308 mmol) were dissolved in toluene (5 mL) and reacted at 95 °C. After 24 hours, Pd(OAc)2 (1.8 mg, 8.2×10⁻³ mmol), CataCXium® A (5.9 mg, 0.016 mmol), pivalic acid (5.0 mg, 0.049 mmol), K2CO3 (34 mg, 0.246 mmol) and bromide 7 (124 mg, 0.246 mmol) were added and reacted at 110 °C. Flash column chromatography (toluene / ethyl acetate gradient 100:1 to 5:1) gave pure product 20 (67 mg, 0.041 mmol, 25% yield) as a black gummy solid: 1H–NMR (400 MHz, C6D6): δ = 9.61 (s, 1H), 8.32 (d, J = 7.7 Hz, 1H), 8.25 (s, 1H), 7.83 (d, J = 8.4 Hz, 2H), 7.50 (d, J = 7.7 Hz, 1H), 7.28 (d, J = 8.4 Hz, 4H), 7.08 (d, J = 8.4 Hz, 2H), 7.03 (d, J =
8.4 Hz, 4H), 6.85 (s, 1H), 3.92–4.05 (m, 6H), 3.77–3.90 (m, 4H), 2.74 (t, J = 7.3 Hz, 4H), 1.55–1.66 (m, 6H), 1.12–1.51 (m, 50H), 1.06 (t,
J = 7.2 Hz, 6H), 0.99 (t, J = 7.2 Hz, 6H), 0.84–0.94 (m, 9H) ppm; 13C–NMR (100 MHz, CD2Cl2): δ = 182.3, 158.7, 158.0, 152.2, 151.5, 150.6, 150.4, 149.5, 149.2, 148.0, 147.6, 146.9, 145.6, 145.3, 144.8, 142.0, 140.7, 131.5, 130.9, 127.7, 126.9, 126.2, 125.4, 125.2, 124.9, 123.9, 123.8, 123.0, 122.2, 119.7, 119.3, 119.1, 114.9, 114.4, 111.3, 78.3, 78.2, 78.0, 77.9, 47.8, 44.3, 34.7, 33.3, 33.2, 32.7,
S5
32.3, 31.9, 31.8, 30.6, 29.7, 28.9, 27.2, 23.2, 23.09, 23.06, 23.00, 14.43, 14.37, 14.25 ppm; IR (KBr): 𝜈̃ = 3031, 2925, 2853, 1735, 1653, 1490, 1374, 1314, 1180, 1058, 820 cm–1; ESI–MS: m/z = 1629.05 [M+H]+.
General procedure for the preparation of compounds TTZ8-12.
The appropriate aldehyde 16-20 (1.0 eq.) was dissolved in toluene and glacial acetic acid (2:1 v/v), then cyanoacetic acid (10 eq.) and ammonium acetate (4.0 eq.) were added. The resulting mixture was stirred at 100 °C for 3-4 hours, then cooled down to room temperature. After dilution with additional toluene, the organic phase was washed twice with HCl(aq.) 0.3 M and the solvent evaporated. The resulting solid was purified by washing with several portions of n-pentane, ethyl acetate and methanol, and dried under vacuum.
(E)-3-(4-(7-(8-(5-(8-(4-(Bis(4-(hexylthio)phenyl)amino)phenyl)-3,3-dipentyl-3,4-dihydro-2H-thieno[3,4-b][1,4]dioxepin-6-yl)thiazolo [5,4-d]thiazol-2-yl)-3,3-dipentyl-3,4-dihydro-2H-thieno[3,4-b][1,4] dioxepin-6-yl)benzo[c][1,2,5]thiadiazol-4-yl)phenyl)-2-cyanoacrylic acid (TTZ8). According to the general procedure, aldehyde 16 (53 mg, 0.037 mmol) was dissolved in toluene (2.0 mL) and acetic acid (1.0 mL) and reacted with cyanoacetic acid (31 mg, 0.367 mmol) and NH4OAc (11 mg, 0.147 mmol) for 4 hours. Work-up and purification afforded dye TTZ8 (51 mg, 0.034 mmol, 92% yield) as an amorphous black solid. 1H–NMR (400 MHz, THF-d8): δ = 8.58 (d, J = 7.3 Hz, 1H), 8.26–8.33 (m, 3H), 8.17–8.23 (m, 2H), 7.96 (d, J = 6.9 Hz, 1H), 7.66 (d, J = 8.4 Hz, 2H), 7.27 (d, J = 8.4 Hz, 4H), 6.99–7.09 (m, 6H), 4.30 (s, 2H), 4.24 (s, 2H), 4.22 (s, 2H), 4.04 (s, 2H), 2.91 (t, J = 7.3 Hz, 4H), 1.58–1.69 (m, 8H), 1.50–1.57 (m, 4H), 1.28–1.49 (m, 36H), 0.85–1.02 (m, 18H) ppm; 13C–NMR (100 MHz, THF-d8): δ = 160.0, 159.5, 154.4, 154.0, 151.8, 151.5, 150.5, 149.5, 149.4, 148.1, 146.4, 146.3, 142.4, 132.8, 132.6, 132.0, 131.7, 131.3, 130.7, 129.9, 128.6, 128.3, 127.9, 126.9, 126.0, 125.1, 123.9, 120.5, 120.4, 116.7, 116.6, 115.1, 78.9, 78.7, 44.86, 44.85, 35.0, 33.92, 33.88, 33.2, 33.1, 32.5, 30.4, 29.6, 26.0, 23.7, 23.6, 14.64, 14.62, 14.57 ppm; IR (KBr): 𝜈̃ = 3419, 3024, 2925, 2853, 2222, 1690, 1584, 1489, 1261, 1087, 803 cm–1; HRMS (ESI) for C84H98N6O6S7 [M]+: calcd. 1510.5587, found: 1510.5585 m/z.
(E)-3-(5-(7-(8-(5-(8-(4-(Bis(4-(hexylthio)phenyl)amino)phenyl)-3,3-dipentyl-3,4-dihydro-2H-thieno[3,4-b][1,4]dioxepin-6-yl)thiazolo [5,4-d]thiazol-2-yl)-3,3-dipentyl-3,4-dihydro-2H-thieno[3,4-b][1,4] dioxepin-6-yl)benzo[c][1,2,5]thiadiazol-4-yl)thiophen-2-yl)-2-cyanoacrylic acid (TTZ9). According to the general procedure, aldehyde 17 (97 mg, 0.067 mmol) was dissolved in toluene (3.0 mL) and acetic acid (1.5 mL) and reacted with cyanoacetic acid (57 mg, 0.668 mmol) and NH4OAc (21 mg, 0.267 mmol) for 3 hours. Work-up and purification afforded dye TTZ9 (86 mg, 0.057 mmol, 85% yield) as an amorphous black solid. 1H–NMR (400 MHz, THF-d8): δ = 8.49 (d, J = 7.6 Hz, 1H), 8.21–8.29 (m, 2H), 7.98 (d, J = 8.0 Hz, 1H), 7.83 (d, J = 4.0 Hz, 1H), 7.61 (d, J = 8.7 Hz, 2H), 7.27 (d, J = 8.7 Hz, 4H), 7.04 (d, J = 8.7 Hz, 4H), 6.99 (d, J = 8.7 Hz, 2H), 4.29 (s, 2H), 4.27 (s, 2H), 4.23 (s, 2H), 4.05 (s, 2H), 2.91 (t, J = 7.4 Hz, 4H), 1.60–1.70 (m, 8H), 1.26–1.58 (m, 40H), 0.93–1.02 (m, 12H), 0.91 (t, J = 6.9 Hz, 6H) ppm; 13C–NMR (100 MHz, THF-d8): δ = 164.1, 159.9, 159.2, 153.4, 152.9, 151.8, 151.5, 150.4, 149.8, 149.3, 149.1, 147.9, 146.4, 146.3, 139.3, 137.6, 132.6, 131.7, 129.2, 128.5, 127.9, 127.7, 127.2, 126.1, 125.1, 124.4, 123.8, 121.0, 120.2, 116.9, 115.1, 100.3, 78.8, 78.7, 78.6, 44.9, 44.8, 35.1, 34.0, 33.9, 33.3, 33.2, 32.5, 30.4, 29.6, 23.7, 23.6, 14.69, 14.65, 14.57 ppm; IR (KBr): 𝜈̃ = 3421, 3025, 2927, 2856, 2216, 1685, 1654, 1571, 1483, 1420, 1261, 1052 cm–1; HRMS (ESI) for C 82H96N6O6S8 [M]+: calcd. 1516.5152, found: 1516.5153 m/z. (E)-3-(5-(7-(8-(5-(8-(4-(Bis(4-(hexylthio)phenyl)amino)phenyl)-3,3-dipentyl-3,4-dihydro-2H-thieno[3,4-b][1,4]dioxepin-6-yl)thiazolo[5,4-d]thiazol-2-yl)-3,3-dipentyl-3,4-dihydro-2H-thieno [3,4-b][1,4]dioxepin-6-yl)benzo[c][1,2,5]thiadiazol-4-yl)furan-2-yl)-2-cyanoacrylic acid (TTZ10). According to the general procedure, aldehyde 18 (45 mg, 0.031 mmol) was dissolved in toluene (2.0 mL) and acetic acid (1.0 mL) and reacted with cyanoacetic acid (27 mg, 0.314 mmol) and NH4OAc (10 mg, 0.125 mmol) for 3 hours. Work-up and purification afforded dye TTZ10 (43 mg, 0.029 mmol, 94% yield) as an amorphous black solid. 1H–NMR (400 MHz, THF-d8): δ = 8.59 (d, J = 8.0 Hz, 1H), 8.19 (d, J = 8.0 Hz, 1H), 7.94 (d, J = 3.6 Hz, 1H), 7.87 (s, 1H), 7.62 (d, J = 8.7 Hz, 2H), 7.41 (d, J = 3.3 Hz, 1H), 7.27 (d, J = 8.4 Hz, 4H), 7.05 (d, J = 8.7 Hz, 4H), 7.00 (d, J = 8.7 Hz, 2H), 4.35 (s, 4H), 4.28 (s, 2H), 4.10 (s, 2H), 2.91 (t, J = 7.4 Hz, 4H), 1.61–1.70 (m, 8H), 1.28–1.60 (m, 40H), 0.87–1.01 (m, 18H) ppm; 13C–NMR (100 MHz, THF-d 8): δ = 164.2, 159.9, 159.3, 156.4, 153.4, 152.3, 151.8, 151.5, 150.5, 150.1, 149.6, 149.3, 147.9, 146.44, 146.39, 138.1, 132.6, 131.7, 128.4, 128.0, 127.7, 127.6, 127.4, 126.0, 125.0, 123.9, 121.0, 120.20, 120.16, 117.0, 116.3, 115.1, 99.8, 79.0, 78.9, 78.6, 44.91, 44.86, 35.1, 34.0, 33.9, 33.3, 33.2, 32.5, 30.8, 30.4, 29.6, 23.7, 23.6, 14.7, 14.6, 14.5 ppm; IR (KBr): 𝜈̃ = 3421, 3033, 2926, 2855, 2218, 1701, 1577, 1481, 1261, 1090, 803 cm– 1; HRMS (ESI) for C 82H96N6O7S7 [M]+: calcd. 1500.5380, found: 1500.5379 m/z. (E)-3-(6-(8-(5-(8-(4-(Bis(4-(hexylthio)phenyl)amino)phenyl)-3,3-dipentyl-3,4-dihydro-2H-thieno[3,4-b][1,4]dioxepin-6-yl)thiazolo [5,4-d]thiazol-2-yl)-3,3-dipentyl-3,4-dihydro-2H-thieno[3,4-b][1,4] dioxepin-6-yl)-4-hexyl-4H-dithieno[3,2-b:2',3'-d]pyrrol-2-yl)-2-cyanoacrylic acid (TTZ11). According to the general procedure, aldehyde 19 (36 mg, 0.024 mmol) was dissolved in toluene (2.0 mL) and acetic acid (1.0 mL) and reacted with cyanoacetic acid (20 mg, 0.240 mmol) and NH4OAc (5.5 mg, 0.072 mmol) for 4 hours. Work-up and purification afforded dye TTZ11 (36 mg, 0.023 mmol, 96% yield) as an amorphous black solid. 1H–NMR (300 MHz, THF-d
8): δ = 8.29 (s, 1H), 7.87 (s, 1H), 7.65 (d, J = 8.1 Hz, 2H), 7.37 (s, 1H), 7.26 (d, J = 8.8 Hz, 4H), 7.00–7.06 (m, 6H), 4.33 (t, J = 6.6 Hz, 2H), 4.25 (s, 2H), 4.23 (s, 2H), 4.19 (s, 2H), 4.06 (s, 2H), 2.90 (t, J = 7.3 Hz, 4H), 1.87–1.98 (m, 2H), 1.26–1.68 (m, 54H), 0.86–1.00 (m, 21H) ppm; 13C–NMR (75 MHz, THF-d 8): δ = 164.5, 159.6, 158.6, 151.2, 151.1, 150.2, 149.9, 149.3, 147.7, 147.5, 146.5, 146.0, 138.5, 134.6, 132.3, 131.3, 131.1, 128.2, 127.5, 125.9, 125.7, 124.9, 124.8, 123.6, 120.5, 120.4, 117.3, 116.5, 115.6, 114.7, 107.2, 95.6, 78.8, 78.6, 78.5, 78.3, 47.7, 44.7, 44.5, 34.7, 33.5, 32.7, 32.6, 32.22, 32.19, 30.8, 30.0, 29.2, 27.3, 23.3, 14.3, 14.2 ppm; IR (KBr): 𝜈̃ = 3421, 3025, 2926, 2855, 2209, 1670, 1572, 1490, 1264, 1175, 1053 cm–1; HRMS (ESI) for C 86H107N5O6S8 [M]+: calcd. 1561.5982, found: 1561.5983 m/z.
dioxepin-6-yl)benzo[c][1,2,5]thiadiazol-4-yl)-4-S6
hexyl-4H-dithieno[3,2-b:2',3'-d]pyrrol-2-yl)-2-cyanoacrylic acid (TTZ12). According to the general procedure, aldehyde 20 (60 mg, 0.037 mmol) was dissolved in toluene (2.0 mL) and acetic acid (1.0 mL) and reacted with cyanoacetic acid (31 mg, 0.368 mmol) and NH4OAc (8.5 mg, 0.110 mmol) for 3 hours. Work-up and purification afforded dye TTZ12 (54 mg, 0.032 mmol, 86% yield) as an amorphous black solid. 1H–NMR (400 MHz, THF-d8): δ = 8.38–8.48 (m, 1H), 8.30 (s, 1H), 8.17 (s, 1H), 7.79 (d, J = 7.3 Hz, 1H), 7.70 (s, 1H), 7.61 (d, J = 7.6 Hz, 2H), 7.22–7.35 (m, 4H), 6.90–7.14 (m, 6H), 4.19–4.42 (m, 8H), 4.08 (s, 2H), 2.91 (t, J = 7.3 Hz, 4H), 1.91–2.02 (m, 2H), 1.29–1.69 (m, 54H), 0.87–1.03 (m, 21H) ppm; 13C–NMR (100 MHz, THF-d8): δ = 164.6, 159.6, 159.1, 158.5, 153.4, 152.6, 151.5, 151.0, 150.2, 149.1, 148.9, 147.8, 146.3, 143.6, 135.4, 135.3, 132.4, 131.6, 128.4, 127.9, 127.6, 126.8, 126.3, 125.9, 124.9, 124.8, 123.7, 122.3, 121.2, 120.4, 120.1, 117.9, 117.6, 116.0, 115.1, 112.8, 108.8, 95.9, 78.8, 78.7, 78.64, 78.60, 48.1, 44.8, 44.7, 34.9, 33.9, 33.8, 33.1, 33.0, 32.6, 32.5, 32.4, 31.2, 30.4, 30.3, 29.5, 27.7, 23.64, 23.55, 14.59, 14.55, 14.46 ppm; IR (KBr): 𝜈̃ = 3448, 3033, 2925, 2854, 2211, 1654, 1570, 1490, 1261, 1177, 1059, 817 cm–1; HRMS (ESI) for C92H109N7O6S9 [M]+: calcd. 1695.5920, found: 1695.5918 m/z.
Computational Details
DFT and TD-DFT calculations on compounds TTZ8-12 have been performed using the Gaussian09, Revision C.01 suite of programs.[7] Geometry optimization was carried out in vacuo using the B3LYP functional[8,9] and the standard 6-31G* basis set for all atoms. The absorption maximum (λamax), vertical excitation energy (Eexc), and oscillator strength (f) in solution were calculated on the optimized structures via time-dependent DFT (TD-DFT) at the CAM-B3LYP[10]/6-311G(d,p) levels of theory. Solvent effects have been included by using the polarizable continuum model (PCM).[11] The UV-Vis spectra have been simulated considering a Gaussian distribution and an arbitrary line width of 0.03 eV using GaussSum 3.0.[12]
Spectroscopic and Electrochemical Measurements
UV-Vis spectra in different solvents were recorded on diluted solutions of the analyte (approximately 10–5 M) with a Shimadzu UV-2600 spectrometer. UV-vis absorption or transmittance spectra of the compounds adsorbed on TiO2 were recorded in transmission mode after sensitization of thin, transparent semiconductor films (thickness approximately 5 μm). Calculation of the weighted transparency (WT%) parameter was carried out according to the following equation:
𝑊𝑇(%) = ∫ 𝑇(𝜆)𝐼(𝜆)𝑎(𝜆)𝑑𝜆 ∫ 𝐼(𝜆)𝑎(𝜆)𝑑𝜆 × 100
where T(λ) is the transmission of the semitransparent dye-sensitized semiconductor film, I(λ) is the AM 1.5 solar spectral irradiance, and a(λ) represents the action spectrum obtained from the combination of the normalized absorption spectra of chlorophyll a, chlorophyll b and beta-carotene, showed in Figure S5.
Cyclic voltammetry experiments were conducted in chloroform solutions with a PARSTAT 2273 electrochemical workstation (Princeton Applied Research) employing a three-electrode cell having a 3 mm glassy carbon working electrode, a platinum counter electrode and an aqueous Ag/AgCl (sat. KCl) reference electrode, and using ferrocene as a standard. The supporting electrolyte was electrochemical-grade 0.1 M [N(Bu)4]PF6; the dye concentration was approximately 10–3 M. Under these experimental conditions, the one-electron oxidation of ferrocene occurs at E0’ = 0.55 V.
Determination of dye adsorption density on TiO2
The density of adsorbed dyes on TiO2 was determined using the following procedure: 1 mL of a solution of the dye in THF (concentration 1.0 ×10⁻⁴ M) was inserted in a small sealed chamber containing a TiO2 electrode identical to those employed for solar cell characterization (0.25 cm2). After 16 h staining, a 0.1 mL aliquot of the solution was removed from the chamber and diluted 10 times. The absorbance of the resulting colored solution was measured by UV-Vis spectroscopy and the amount of dye present was calculated based on a previously obtained calibration line (concentration range 5.0 ×10⁻⁶ M - 2.0 ×10⁻⁵ M). Finally, the amount of dye adsorbed on the TiO2 film could be estimated by difference between the initial and the final amount found in solution.
Dye-Sensitized Solar Cells Fabrication and Characterization.
Transparent photoanodes for small-scale DSSCs were prepared by screen-printing a commercial transparent TiO2 paste (Great Cell Solar 18NR-T) on a 7 Ω sq–1 conductive glass substrate (Pilkington), and by treating the resulting films at 525 °C for 30 minutes. After sintering, the thickness of the semiconductor layer was measured by means of a profiler (Dektak 150, Veeco) and determined to be 5.5 μm. In all cases, the electrode active area was 0.25 cm2. Counter electrodes were obtained by screen printing a commercial platinum-containing paste (Chimet) on a conductive glass plates and by heating at 480 °C for 15 mins. TiO2 photo-electrodes were sensitized by overnight immersion at rt into the appropriate dye solution (0.1 mM in THF). After sensitization, the anodes were rinsed with EtOH and deionized water, and then dried. A TiO2-sensitized photoanode and a Pt counter electrode were assembled into a sealed sandwich-type cell using a 50 mm hot-melt Bynel® gasket (Solaronix). The commercial HPE electrolyte solution (Great Cell Solar) was injected into the device without any drilled hole by vacuum backfilling technique.[13]
S7
In the case of the opaque cells built with dye TTZ8, a similar fabrication procedure was applied, except for the preparation of the photoanode, which was performed as follows: a commercial titania paste (18NR-T, Greatcell Solar) was screen-printed on the cleaned glass substrates (0.25 cm2 active area) and the resulting electrodes were heated for 6 min at 125 °C. The screen-printing and heating procedure was repeated one more time with the same paste and then a third time with a scattering paste (WER2-O, Greatcell Solar), to obtain films with a final thickness of approx. 13 μm (measured with KLA Tencor-P10 surface profilometer). Finally, the electrodes were sintered for 5 min at 325 °C, then 5 min at 375 °C, 15 min at 450 °C, and finally 15 min at 500 °C. Titania photoelectrodes were then once again sensitizedby overnight immersion at room temperature (RT) into an ethanolic dye solution. Optical characterizations of the dye coloured Titania electrodes were performed by using an UV–Vis spectrophotometer (Shimadzu UV-2550).
Devices were tested under a solar simulator (ABET Sun 2000) at AM1.5 G and 100mWcm−2 illumination conditions, calibrated with a EKO MS-602 pyranometer. Current-voltage characteristics were measured by using a digital source meter (Keithley 2420).
The incident photon-to-current conversion efficiency (IPCE) was measured by using a commercial apparatus made by CICCI Research.
Electrochemical impedance spectroscopy (EIS) measurements were carried out in the dark using a AUTOLAB 302N potentiostat (Metrohm) equipped with a Nova electrochemical interface system, working at – 0.60 V (forward bias). The spectra were recorded over a frequency range of 10–1 to 105 Hz with an amplitude of 10 mV. Data fitting was carried out using the EC-Lab software (V9.46).
S8
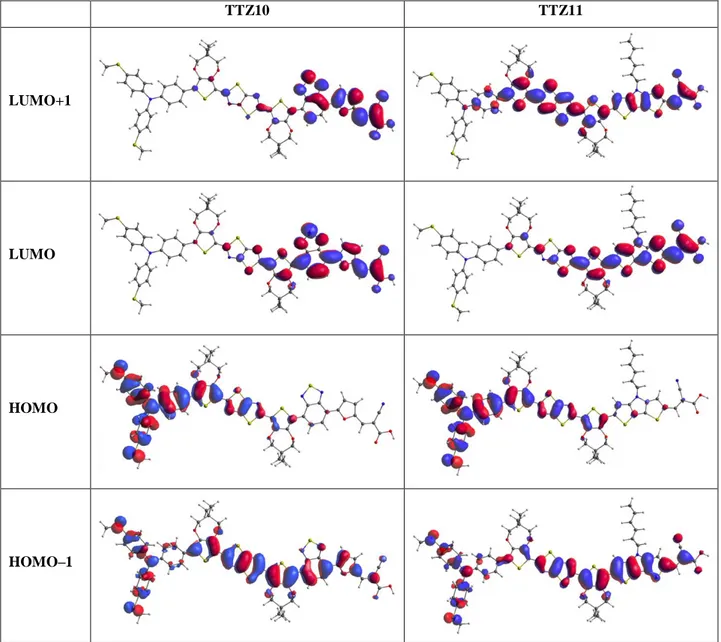
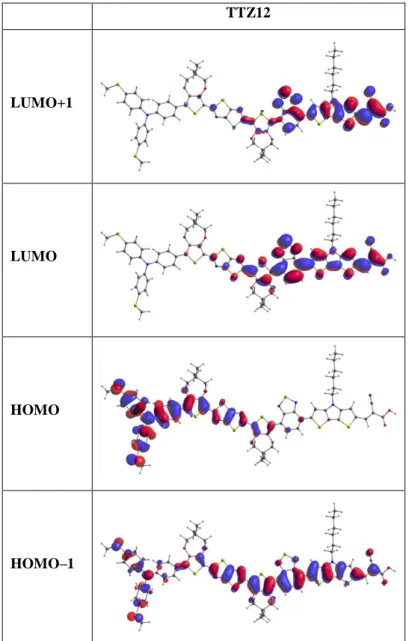
2. Computational data for compounds TTZ8-12
S9
TTZ8 TTZ9 LUMO+1 LUMO HOMO HOMO–1S10
TTZ10 TTZ11 LUMO+1 LUMO HOMO HOMO–1S11
TTZ12 LUMO+1 LUMO HOMO HOMO–1S12
Table S1. CAMB3LYP/6-31G* absorption maxima (λ
amax
), oscillator strengths (f), vertical excitation
energies (E
exc) and main electronic transitions for dyes TTZ8-11 in CH
2Cl
2and TTZ5 (taken as a reference) and
TTZ12 in THF to be comparable with the experimental observations.
Compound
Excited State
λ
amax
(nm)
E
exc(eV)
f
aTransitions
(%)
TTZ5
1
507.78
2.442
2.655
H–1 → L 48
H → L 30
2
407.24
3.044
0.158
H → L+1 39
H–1 → L 13
4
342.67
3.618
0.341
H–2 → L 19
H → L+2 20
TTZ8
1
506.85
2.446
2.561
H–1 → L 43
H → L 25
2
415.44
2.984
0.326
H → L+1 36
H–2 → L 16
4
350.37
3.539
0.636
H–1 → L 18
H → L+2 16
TTZ9
1
555.50
2.232
2.514
H–1 → L 51
H → L 25
2
432.67
2.866
0.376
H → L+1 27
H–2 → L 21
3
382.56
3.241
0.631
H → L 41
H → L+2 19
TTZ10
1
550.50
2.252
2.520
H–1 → L 52
H → L 25
2
431.17
2.876
0.353
H → L+2 28
H–2 → L 22
3
379.71
3.265
0.727
H → L 31
H → L+2 21
TTZ11
1
532.87
2.327
3.161
H–1 → L 46
H → L 35
2
431.09
2.876
0.307
H → L+1 43
H–2 → L 19
4
366.26
3.385
0.297
H–1 → L+1 40
H → L+2 26
S13
TTZ12
in THF
1
574.36
2.159
2.985
H–1 → L 54
H → L 29
2
448.82
2.763
0.176
H–2 → L 27
H → L+2 20
3
410.91
3.017
1.081
H–1 → L+1 30
H → L+2 28
S14
3. Spectroscopic and electrochemical characterization of compounds TTZ8-12
S15
Figure S4. a) Cyclic voltammetry (CV) plots of compounds TTZ8-12 in CHCl3 solution. b) Cyclic voltammetry (CV) plots of compounds TTZ8 and TTZ11 at different scan rates in CHCl3 solution. Potentials are reported against Ag/AgCl/satd. KCl reference electrode.
S16
Figure S5. Differential pulse voltammetry (DPV) plots of compounds TTZ8-12 in CHCl3 solution. Potentials are reported against ferrocene used as an internal standard. Under these conditions, one electron oxidation of ferrocene to ferrocinium took place at 0.55 V vs. Ag/AgCl/satd. KCl reference electrode.
S17
Figure S6. Comparison between the transmission spectra of dyes TTZ8 and TTZ11 adsorbed on a thin transparent TiO2 films and the UV-Vis absorption spectra of the most common plant photoreceptors (chlorophyll a, chlorophyll b, beta carotene).
S18
4. Optimized DSSC performances with dye TTZ8
Figure S7. Current-potential curve of a DSSC built by sensitizing with dye TTZ8 a photoanode featuring an opaque nanocrystalline TiO2 layer and a scattering layer (total thickness approx. 13 μm, see Experimental Section for details).
S19
S41
6. References
[1] A. Dessì, M. Calamante, A. Mordini, M. Peruzzini, A. Sinicropi, R. Basosi, F. F. De Biani, M. Taddei, D. Colonna, A. Di Carlo, G. Reginato and L. Zani, Chem. Commun., 2014, 50, 13952–13955.
[2] K. D. Seo, I. T. Choi and H. K. Kim, Chem. – A Eur. J., 2015, 21, 14804–14811.
[3] C. Dall’Agnese, D. Hernández Maldonado, D. Le Borgne and K. I. Moineau-Chane Ching, European J. Org. Chem., 2017, 6872– 6877.
[4] F. Denat, H. Gaspard-Iloughmane and J. Dubac, Synthesis (Stuttg)., 1992, 10, 954–956. [5] Suman, A. Bagui, R. Datt, V. Gupta and S. P. Singh, Chem. Commun., 2017, 53, 12790–12793. [6] P.-Y. Ho, Y. Wang, S.-C. Yiu, W.-H. Yu, C.-L. Ho and S. Huang, Org. Lett., 2017, 19, 1048–1051.
[7] M. J. Frisch, G. W. Trucks, H. B. Schlegel, G. E. Scuseria, M. A. Robb, J. R. Cheeseman, G. Scalmani, V. Barone, B. Mennucci, G. A. Petersson, H. Nakatsuji, M. Caricato, X. Li, H. P. Hratchian, A. F. Izmaylov, J. Bloino, G. Zheng, J. L. Sonnenberg, M. Hada, M. Ehara, K. Toyota, R. Fukuda, J. Hasegawa, M. Ishida, T. Nakajima, Y. Honda, O. Kitao, H. Nakai, T. Vreven, J. Montgomery, J. A., J. E. Peralta, F. Ogliaro, M. Bearpark, J. J. Heyd, E. Brothers, K. N. Kudin, V. N. Staroverov, T. Keith, R. Kobayashi, J. Normand, K. Raghavachari, A. Rendell, J. C. Burant, S. S. Iyengar, J. Tomasi, M. Cossi, N. Rega, J. M. Millam, M. Klene, J. E. Knox, J. B. Cross, V. Bakken, C. Adamo, J. Jaramillo, R. Gomperts, R. E. Stratmann, O. Yazyev, A. J. Austin, R. Cammi, C. Pomelli, J. W. Ochterski, R. L. Martin, K. Morokuma, V. G. Zakrzewski, G. A. Voth, P. Salvador, J. J. Dannenberg, S. Dapprich, A. D. Daniels, O. Farkas, J. B. Foresman, J. V. Ortiz, J. Cioslowski and D. J. Fox, Gaussian 09, Revision C.01, 2010. [8] C. Lee, W. Yang and R. G. Parr, Phys. Rev. B, 1988, 37, 785–789.
[9] A. D. Becke, J. Chem. Phys., 1993, 98, 5648–5652.
[10] T. Yanai, D. P. Tew and N. C. Handy, Chem. Phys. Lett., 2004, 393, 51–57. [11] J. Tomasi, B. Mennucci and R. Cammi, Chem. Rev., 2005, 105, 2999–3094.
[12] N. M. O’boyle, A. L. Tenderholt and K. M. Langner, J. Comput. Chem., 2008, 29, 839–845.
[13] L. Vesce, A. Guidobaldi, P. Mariani, A. Di Carlo, M. L. Parisi, S. Maranghi and R. Basosi, World Scientific Reference of Hybrid