CHAPTER 3
Ni(II) complexation by salicylhydroxamic acid in SDS.
Hydroxamic acids are often involved in metal ions transport through cell membranes (Neilands, 1976), due to their ability to form strong metal complexes and their partial hydrophobicity that allows them to pass through lipophilic mediums. In order to build up artificial systems able to mime hydrophobic membranes, micelle/water systems prove to be considerably useful. Actually, surfactants micelles form a hydrophobic pseudophase in water solution, which can have an effect on reactions overall rate and equilibrium constants. It was already demonstrated that hydrolysis processes of amphiphilic hydroxamate ions are influenced by the presence of surfactants in water (Ghosh, 1997; Ghosh and Tiwary, 2003; Ferrit et al., 2007). On the other hand, their complexation reactions in micellar solutions have never been investigated. The studyof metal binding in micelle media is interesting from the mechanistic standpoint (Monteleone et al., 2004) and in order to explore the conditions for the application of complex formation reactions in metal extraction and recovery processs (Gosh, 2004). There are some significant advantages in using a micellar solution over an organic solvent as hydrophobic bulk able to extract chemical species: micelles are distributed uniformly through the medium as nano-sized aggregates and no stirring of the medium is necessary, since the system is a single homogeneous macrophase. Secondly, in the presence of a negatively charged surface, such as is provided by the OSO3− head groups of sodium dodecylsulfate (SDS), the metal ion
will be strongly electrostatically attracted to the micelle surface. In addition, micelles are able to solubilize ligands with hydrophobic residues that can react with metal ions present on the surface where the reaction will be facilitated as the result of a local concentration effect on both reactants. Moreover, a metal complex with a hydrophobic ligand, once diffused toward a micelle, will be retained on it by hydrophobic forces.
This chapter reports on kinetics and equilibria of the binding of Ni(II) to salicylhydroxamic acid (SHA) in aqueous solution containing micelles of sodium dodecyl sulphate (SDS). Such a study is aimed to enlighten the complexation mechanism and the thermodynamic and kinetic parameters of this reaction and to evaluate the possibility of using SHA as an extraction agent.
3.1 Surfactants
A surfactant is a substance that reduces the surface tension of the medium in which it is dissolved. By lowering the interfacial tension between two media or interfaces the surfactant plays a key role in the removal and suspension of dirt. A surfactant molecule has a hydrophilic head and a long hydrophobic tail and for this reason it is often regarded as an amphiphilic molecule (Figure 3.1). Many of the physicochemical properties of these molecules in solution stem from this ambivalency. However, small changes in the architecture of the surfactants, which alter the balance between hydrophobic and hydrophilic properties, can result in dramatic changes in their behaviour in solution.
Figure 3.1 Structure of a generic surfactant
Surfactants can be categorized, according to the charge present in the hydrophilic portion of the molecule after dissociation in aqueous solution, in four main types: anionic, cationic, non-ionic, amphoteric/zwitterionic.
The main properties of surfactants concern adsorption and self-assembly processes. Surfactant molecules usually locate themselves at the interface between an oil and an aqueous phase or an aqueous and an air phase. This molecular property leads to the macroscopic properties of wetting, foaming, detergency and emulsion formation. Moreover, surfactant molecules tend to organise themselves into extended structures in water, giving rise to micelles, large aggregates, which, depending on the specific surfactant and solution conditions, can adopt a variety of shapes.
3.2 Micelles
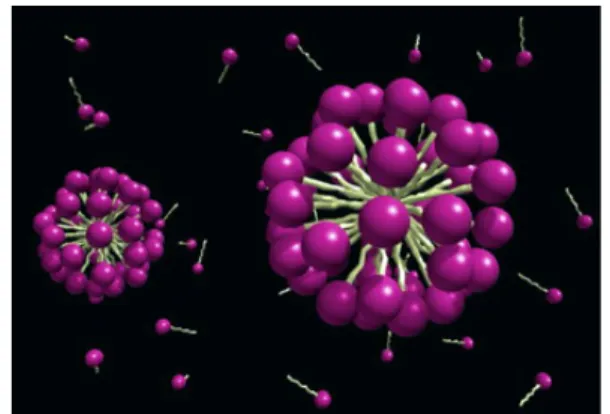
A spherical micelle is the simplest surfactant aggregate formed in aqueous solution. Micelles are small aggregates with a size of few nanometers. They are formed in such a way that their hydrophilic head groups are exposed to the water medium and their hydrophobic tails form a water free core. The headgroups of the micelle are extensively hydrated. For ionic micelles, a large fraction of the counterions are located in the vicinity
of the headgroups. These counterions normally retain their first hydration shell. The part of the surfactant that contains the headgroups and a variable fraction of the counterions is called the Stern region. This region has an important role in solubilisation.
Micelle solutions can solubilise insoluble organic material by incorporating it either at the surface or in the inner core. This properties gives micellar solutions an important role in chemistry in terms of solubilising material, catalysing reactions and extractant (Engberts, 1992; Jones, 1999; Stalikas, 2002). Micelles are often depicted as static structures of orientated surfactant molecules, however they are very dynamic aggregates. Actually, they breakdown and reform rather rapidly (Lang et al., 1975; Aniansson et al., 1976; Tondre and Zana, 1978). Due to this dynamic character, the size and shape of micelles are subject to appreciable structural fluctuations. The number of surfactant monomers in a micelle is defined “aggregation number”, n. Average micelles aggregation numbers are typically in the range of 40 - 100.
Figure 3.2 Structure of a spherical micelle.
3.2.1 Critical micelle concentration
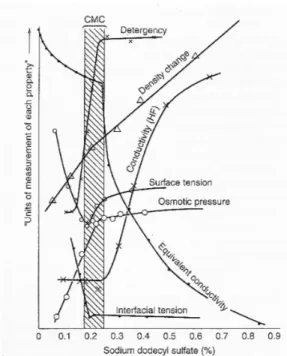
The concentration of surfactant at which micelles first appear in solution is called the critical micelle concentration or CMC. Above the CMC, the concentration of free surfactant is essentially constant, while the micelle concentration increases approximately linearly with total surfactant concentration. The concentration at which micelles first become detectable depends on the sensitivity of the experiments used to determine the CMC. At this concentration, brusque changes in several physical properties take place. Actually, the CMC can be experimentally determined from the discontinuity or inflection point in the plot of a physical property of the solution as a function of surfactant concentration (Patist et al., 2001) as shown in Figure 3.3. A wide variety of techniques involving the measurement of physical properties have been used to determine CMC
values such as surface tension, electrical conductivity, light scattering, refractive index and viscosity.
Figure 3.3 Changes in some physical properties for an aqueous solution of sodium dodecyl sulphate (SDS) close to the CMC.
Many factors are known to affect the CMC value in aqueous media. Among these are the surfactant structure, the presence of electrolytes or organic additives in solution, temperature, pressure and pH values.
3.2.2 Solubilization
One of the most important characteristics of micelles is their ability to take up all kinds of substances. Actually a number of solutes, which would normally be insoluble or slightly soluble in water, dissolve extensively in surfactant solution above the CMC. Binding of these compounds to micelles is generally driven by hydrophobic and electrostatic interactions.
Solubilisation is usually treated in terms of the pseudophase model, in which the bulk aqueous phase is regarded as one phase and the micellar pseudophase as another. This allows the affinity of the solubilisate for the micelle to be quantified by a partition coefficient, R, usually expressed as a ratio of concentrations. Solubilization is believed to occur at a number of different sites in the micelle (Rosen, 1989) and the nature of the solubilisate largely determines its position in the aggregate. Saturated hydrocarbons show a preference for the core of the micelle (Jobe et al., 1982). In contrast, solubilisates that
contain hydrophilic substituents, such as alcohols or amines, prefer to stay at the surface, where the hydrophilic groups can remain largely hydrated (Porter, 1994). The Stern region is particularly flexible in binding molecules as it contains both the highly hydrophilic surfactant head groups and hydrophobic domains due to backfolding of the surfactant tails as well as water molecules (Gruen, 1985). However, since microenvironments available for solubilization change continuously, due to the dynamic nature of micelles, any attempt to situate the solubilized molecule in specific sites of the micelle could be difficult.
3.2.3 Micellar Catalysis
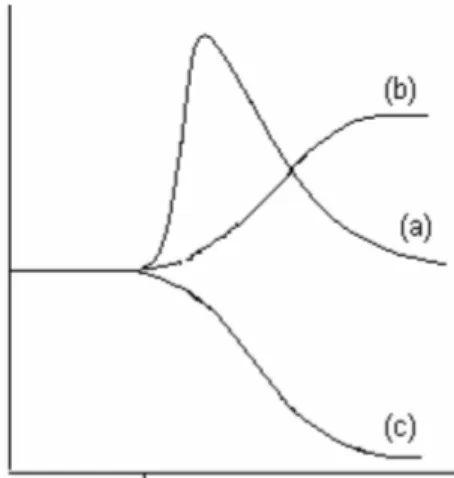
Concerning reactive process, it has been recognized for long time, that the reaction medium plays an important role in controlling the mechanism and rates of chemical reactions. The chemical reactivity exhibited by molecules and ions organized around these assemblies, is often very different from their reactivity in pure water. Actually, chemical reactions can be influenced in three main ways: by an increase or decrease of rate reaction, by an alteration in the reaction pathway and by an alteration in the reaction stereochemistry. In the presence of ionic surfactants some reaction rates are dramatically enhanced over a narrow concentration range near the CMC to fall off more gradually with increasing surfactant concentration (Figure 3.4, curve (a)). In other reactions, the observed rates rose more gently to plateaus in enzyme-like fashion (Figure 3.4, curve (b)). A further series of reactions displayed the opposite behaviour beyond the CMC, considering that the reaction rates decreased (Figure 3.4, curve (c)).
Figure 3.4 Effect of surfactants on reaction rates. Curves (a) and (b) represent micellar catalysis while curve (c) is a typical example of micellar inhibition.
The phenomenon of the rate enhancement is known as “micellar catalysis”. The fact that the surfactant is not consumed in the reaction and that the surfactant concentration required to obtain such effects is usually very low, justifies the use of the term “micellar catalysis”. The efficiency of micellar catalysis relies on two principal factors. First, there is the effect of the micellar environment on the rate-controlling step in the reaction mechanism. The relative free energies of the reactants and the transition state can be altered when the reaction takes place in the micellar phase instead of the bulk water (Romsted, 1976). A more important consideration is the localization of the reacting species in the relatively small volume of the micelles compared to the bulk solution. This leads to a large increase in the effective concentration and the observed rate increases accordingly. Thus rate enhancements of bimolecular and higher order reactions are a consequence of the localized concentration of reactants at the micelle-solution interface. The kinetic data analysis of chemical reactions in micelles generally involves the use of the well-known pseudophase model (Shinoda and Hutchinson, 1962; Menger and Portnoy, 1967), which assumes the micellar solution as consisting of two separate phases. The reaction may take place in both the aqueous and micellar pseudophases and the overall reaction rate is the sum of the rates in each pseudophase (Shinoda and Hutchinson, 1962). A rate promotion occurs when both reactants are preferentially located in the micelles, while a rate decrease follows if only one of the reactants has been incorporated into the micelles, since in the latter case the two reaction partners are separated.
3.3 Micellar Extraction
Micellar systems have attracted considerable attention in the last few years as potential extracting media and continue to have a broad appeal for extraction applications (Cöklen and Hatton, 1985; Stalikas, 2002; Juang et al., 2003). Solutes that bind to micelles in solution are extracted to different extents, depending on the micelle-solute binding interactions. Hydrophobic compounds, are favourably partitioned in the non-polar microenvironment, while metal ions can bind electrostatically to the polar head of the surfactant, or can be extracted by complexation with a ligand soluble into the micellar pseudo-phase, thus being preferentially in form of metallic chelates. For effective metal recovery, the separation of the micellar pseudo-phase from the aqueous phase has to be achieved. It can be carried out by means of ultrafiltration (Micellar Enhanced Ultrafiltration or Ligand Modified-Micellar Enhanced UltraFiltration) (Klepac et al., 1991; Fillipi et al., 1998).
3.3.1 Micellar-Enhanced Ultrafiltration
A large number of studies have demonstrated that the separation of the micellar pseudo-phase from the aqueous pseudo-phase can be achieved by ultrafiltration using membranes with pore diameter smaller than the size of the micelle (Scamehorn et al., 1989). Ultrafiltration is a membrane separation process aimed at dissolved or dispersed particles, which have size ranging from 1-100 nm. As a consequence, the pore size is too large to reject small molecules (below 103 Da). Micellar Enhanced Ultrafiltration (MEUF) is a surfactant-based separation process in which surfactants are added to a waste stream to promote the removal of small molecules. MEUF has been widely used to remove metal ions (Scamehorn et al., 1994; Juang et al., 2003; Li et al., 2006) and organic contaminants (Kim et al., 1998; Doulia and Xiarchos, 2007; Zaghbani et al., 2007) from dilute aqueous solution. Metal ions or organic molecules as hydroxamic acids, in which we are mainly interested, can be recovered through MEUF, once they are attracted on the micelle surface. The micellar solution is subsequently passed through an ultrafiltration membrane with pore sizes small enough to retain the micelles and the associated reactants.
3.4 Determination of the acid dissociation constant of SHA in the presence of SDS. The hydrogen ion concentration in water generally differs from the value on the micelle surface. For instance, in the presence of SDS micelles, the negatively charged surface will attract protons resulting in an increase in the proton concentration at the surface with a consequent decrease in the pH. Hartley and Roe (Hartley and Roe, 1940) showed that the surface pHS is related to the bulk pHW, at 25 °C, by the following equation:
pHS − pHW = −Ψ⁄ 59.2 (3.1)
where Ψ is the surface potential of the micelle in mV. The high surface potential of the SDS micelle (~ 120 mV) leads to a decrease in the local pH at the surface that, according to equation (3.1) is equivalent to about two units. This result shows that [H+]S/[H+]W ≈ 100, i.e. the proton concentration on the micelle surface is one hundred times higher than in water. The pKA of a ligand that is located on the micelle surface is also shifted. Actually, the major influence on the pKA shift is attributed to the increased proton concentration close to the micelle surface, rather than an effect on the intrinsic pKA of the ligand, arising from the change in environment (James and Robinson, 1978). Again following Hartley and
Roe (Hartley and Roe, 1940) at 25°C the surface pKA, (pKA)S, is related to the bulk pKA, (pKA)W, by equation (3.2):
(pKA)S − (pKA)W = Ψ⁄ 59.2 (3.2)
According to the above considerations any evaluation of data obtained for micellar systems requires the knowledge of the surface pKA, (pKA)S. Hence, the (pKA)S value of the ligand used in the present study (SHA) has been measured in the presence of SDS.
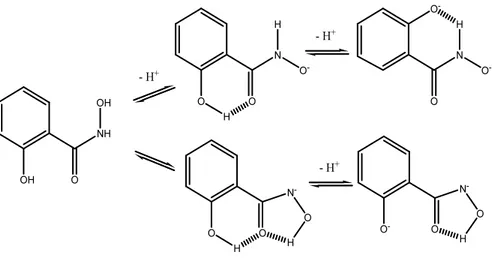
Salicylhydroxamic acid, here employed to complex Ni(II), is a weak acid with three protonation sites: the carbonyl oxygen, the aminic nitrogen and the phenolic group . The hydrogen ion equilibria of SHA can be represented as follows:
Figure 3.5 Dissociation equilibria of SHA.
The first acid dissociation constant of SHA in the presence of SDS has been measured in this thesis for the first time. The same value of pKA1 has been measured in pure water solution, (pKA1)W in order to determine the term Ψ⁄ 59.2 which should be employed to evaluate the hydrogen ion concentration on the micellar surface according to equation (3.1). The pKA1 of SHA have been evaluated in water and in SDS solutions by means of spectrophotometric titrations. In particular, it has been indirectly measured by exploiting the protonic exchange reaction between SHA and dihydrogen phosphate (reaction (3.3)).
HL- + H 2PO4 - ⇄ HPO 4 2- + H 2L (3.3)
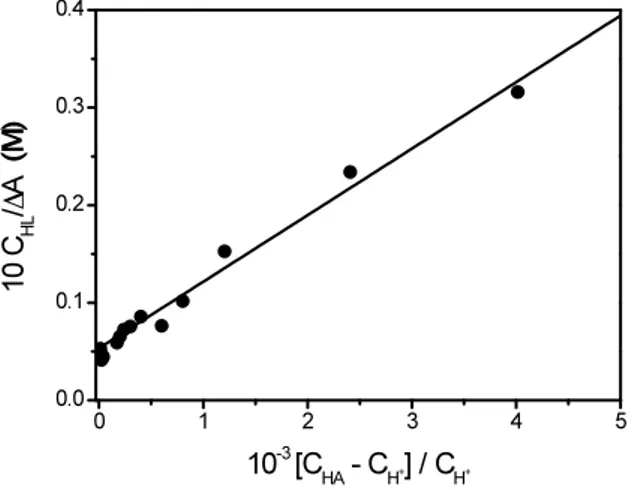
Spectrophotometric titrations were carried out by adding known amounts of HCl in the spectrophotometric cell containing a known amount of SHA and an excess of Na2HPO4. The absorbance values at 238 nm were analyzed according to equation (3.4) (see Appendix I). € CHL ΔA = 1 Δε + 1 KΔε [HPO42−] [H2PO4−] (3.4)
where CHL is the total ligand concentration, ΔA = A-εHLCHL, Δε = εH2L-εHL and K represents the equilibrium constant of reaction (3.3). This constant is defined as K = KHA/KA1, where
KHA refers to the acid dissociation of H2PO4
-. The analysis of a typical titration according to equation (3.4) is shown in Figure 3.6.
Figure 3.6 Analysis of a spectrophotometric titration for the determination of pKA1 of SHA
in SDS 3.5×10⁻² M. C
HL = 1×10 -4 M; C
HA = 1×10
-2 M; λ = 238 nm; T = 298 K.
Using the pKHA value of NaH2PO4 in SDS 2×10
-2
M, that is an average value of the investigated SDS concentrations (pKHA = 6.95 ± 0.02)(Ghezzi, 2008) the pKA1 values of
SHA at each SDS concentration, reported in Table 3.1, have been obtained from plots as that shown in Figure 3.6. The value of pKA1 in water is in agreement with the literature data
(pKA1 = 7.56) (García et al., 2007).
Comparison of the pKA1 values in water and SDS solution yields (pKA1)S − (pKA1)W = 1.7 as an average value of the data of Table 3.1. According to the relationship ΔpK = ΔpH (Hartley and Roe, 1940; James and Robinson, 1978) one can conclude that the hydrogen ion concentration on the SDS micelles is higher by a factor of about 50 compared to water.
Table 3.1 Dependence of SHA pKA1 on SDS concentration. 102
[SDS] (M) pKA1 (SHA) ΔpKA1 (SHA)
0 7.6 0.0 0.4 9.4 1.8 0.7 9.3 1.7 1.5 9.3 1.7 2.4 9.2 1.6 3.5 9.1 1.5 6.0 9.1 1.5
3.5 Extraction of SHA and Ni(II)/SHA complex by MEUF.
Micellar enhanced ultrafiltration (MEUF) has been used to evaluate the extent of the adsorbtion of salicylhydroxamic acid and its complex with Ni(II) on the surfactant. Solution of water and different amounts of SDS, containing 10-3
M SHA was subject to an ultrafiltration procedure. After the micellar phase (retentate) was separated (extracted) from the liquid matrix (permeate), a spectrum of the permeate was recorded and compared with that of the initial solution. The extraction procedure was applied also to measure the extent of extraction of the of the free metal (M) and the Ni(II)/SHA complex (ML). The yield of the extraction process for each species is expressed by the retention coefficient, Ri (equation (3.5)).
(3.5)
where and are the molar concentrations of the i-th reactant in water and in SDS respectively. Ultrafiltration experiments have been performed for samples containing different amounts of SDS, but it has been observed that the retention coefficients do not change their values varying the surfactant concentration. It turns out that RL = 0.87, RM = 0.25 and RML = 0.32 at each investigated SDS concentration. Note that salicylhydroxamic acid displays a fair distribution between the aqueous and the micellar phase, while its complex with Ni(II) tends to stay more on the micelle surface, as it is sensitive not only to the hydrophobic effect, but also to the electrostatic attraction of its positive charge by the negatively charged SDS micelles.
3.6 Complex Formation Equilibria.
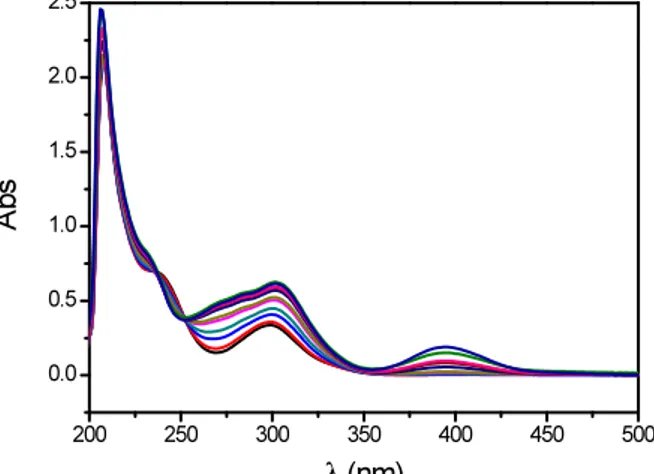
The interactions of Ni(II) with SHA in SDS micellar solution is revealed by the spectral changes occurring in the UV region (Figure 3.7). All titrations have been performed under conditions of metal excess (CM ≥ 10 CL), where only 1:1 complexes are formed.
Figure 3.7 Spectral changes recorded during a spectrophotometric titration of SHA with Ni(II). pH=5.41, [SDS]= 3.5×10⁻²
M, I=0.2 M, T=25°C.
Spectrophotometric titrations of SHA with Ni(ClO4)2 were performed at 304 nm, where the
spectral change is the largest, with the aim of evaluating the equilibrium constant, Kapp, of
the binding reaction (3.6)
Mf +Lf MLT (3.6)
where Mf and Lf are the total concentrations of uncomplexed metal and ligand, whereas
MLT is the total complex concentration.
In the presence of surfactant the expression for Kapp is:
(3.7)
The superscripts W and S denote the concentrations of the reactants in the aqueous and micelle pseudophase respectively.
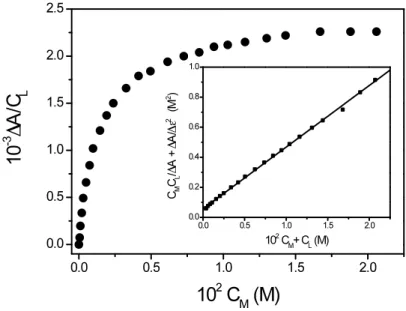
Experiments were performed in the pH range between 4.2 and 5.9 for different SDS concentrations. Figure 3.8 shows a typical titration curve at pH = 5.2 and I = 0.2 M (NaClO4).
Figure 3.8 Binding isotherm deriving from a spectrophotometric titration of SHA with Ni(II). [SDS] = 3.5×10⁻² M, pH = 5.41, I = 0.2 M, λ = 304 nm, T = 298 K. Inset: analysis
of the titration by means of equation (3.8).
Titrations were analyzed according to equation (3.8) (derivated in Appendix II) that gives a straight line whose intercept and slope provide the equilibrium constant, Kapp, together with
the change in extinction coefficient, Δε (inset of Figure 3.8).
€ CMCL ΔA + ΔA Δε2 = 1 KappΔε+ CM + CL Δε (3.8)
It should be noticed that application of equation (3.8) requires an iterative procedure since Δε is not known “a priori”. Hence the term ΔA/Δε2 is disregarded on a first approximation and is then calculated from the slope of the straight line obtained by plotting CMCL/ΔA vs.
(CM+CL). This Δε value will be used to re-evaluate the (CMCL/ΔA + ΔA/Δε 2
) term and so on, until convergence is reached.
The analysis of the equilibria and kinetics (described below) has been based on a general reaction pattern, which includes possible interaction between the metal and the two different ligand forms (Scheme 3.1).
As displayed by MEUF extraction results, SHA is present just partially on the micelles surface, while a considerable amount of it remains in the aqueous phase, therefore the
measured Kapp in the presence of the surfactant includes the contributions of the apparent reaction that takes place in both the phases of the solution. By inserting equation (3.5) in the expression of Kapp, is possible to separate the contributions to the equilibrium of the aqueous and micellar phase and evaluate the extent of the complexation reaction in the micelle phase only, in terms of (equation (3.9)).
(3.9)
where a and b are two numerical coefficients that depend on the fractions of metal and ligand in the aqueous and micellar phase, evaluated as reported in equations (3.10) and (3.11).
(3.10)
(3.11)
The trend of the apparent binding constant with [H+] does not change on going from aqueous solution (García et al., 2007) to micellar solution, hence Scheme 3.1, that was worked out for the reaction in water, was assumed as suitable to represent the overall binding process in SDS micellar medium too.
The acidity dependence of is given by equation (3.12)
(3.12)
where K1 and K2 are the equilibrium constants of the individual steps (I) and (II) respectively, whereas KA1 is the dissociation constant of ligand. The molar fraction of the ligand, α, is defined as [H+
]/(KA1+[H+
]), while β represents the molar fraction of the free form of metal, Ni2+
, and is equal to [H+
]/(KH+[H+
]), where KH = 1.38×10⁻¹⁰
M is the first dissociation constant of the [Ni(H2O)6]2+
ion in water (Baes and Mesmer, 1976) and it is even smaller in SDS, so that β = 1. Figure 3.9 collects all the apparent constants found by spectrophotometer analysis and shows how the reaction is improved at higher pH values and for SDS concentrations near to the CMC.
Figure 3.9 dependence on [H+
] and [SDS] for the Ni(II)/SHA system. I = 0.2 M; T = 298 K.
According to Scheme 3.1 is possible to deduce the dependence of KC on the other individual equilibrium constants, being .
The values of the obtained individual constants, at each analyzed SDS concentration, are collected in Table 3.2.
Table 3.2 Dependence of the equilibrium constants on [SDS] for the Ni(II)/SHA system at 298 K and I = 0.2 M (NaClO4). 102 [SDS] (M) K1 S (M-1 ) 10-5 K2 S (M-1 ) 1010 KA1 S (M) 105 KC S (M) 0 115 0.05 250 0.1 0.4 20.1-21.6a 8.6-8.6 a 3.89 1.7-1.5 a 0.7 94.3-101.3 a 21.1-38.0 a 4.79 1.1-1.8 a 1.5 62.2-54.3 a 20.7-19.1 a 6.92 2.3-2.4 a 3.5 15.7-12.2 a 5.0-4.3 a 8.32 2.7-2.9 a 6.0 12.3-11.4 a 2.5-3.6 a 8.51 1.7-2.7 a a
Values obtained from kinetic experiments as K1 = k1/k-1,K2 = k2/k-2, KC = (KA1 k2 k-1)/(k-2 k1).
3.7 Complex Formation Kinetics
The kinetics of Ni(II) binding to SHA have been investigated under pseudo first-order conditions (CM >> 10 CL) using the stopped-flow method.
The obtained kinetic curves are monoexponential in the range of pH between 4.2 and 5.7 and at I = 0.2 M (Figure 3.10A), and the kinetic effect is ascribed to formation of a mononuclear complex between Ni(III) and SHA. The behavior becomes more complex at the higher analyzed pH value (pH = 5.9), where the system displays two kinetic effects (Figure 5B). The analysis of the recorded traces provided the amplitude and time constants, 1/τfast and 1/τslow, of the two corresponding kinetic effects. Experiments carried out keeping
constant the pH, ligand and perchlorate concentration and varying the metal concentration show a good linearity of 1/τfast versus CM (Inset of Figure 3.10A), according to equation
(3.13).
1/τfast = kf,fastCM+ kd,fast (3.13)
Thus, a linear interpolation of the experimental data would provide the values of the apparent complex formation (kf,fast) and dissociation (kd,fast) rate constants of reaction (3.6),
Figure 3.10 Kinetic relaxation curves for the complexation reaction of Ni(II)/SHA system in [SDS] = 6×10⁻²
M; I = 0.2 M; λ = 304 nm; T = 298 K. (A) Fast effect: pH = 4.2; CM =
1.6×10⁻²
M; Inset: time constant values dependence on Ni(II) concentration for the fast effect; (B) Fast and slow effects: pH = 5.9; CM = 4×10
-3
M; Inset: time constant values dependence on Ni(II) concentration for the slow effect.
As done for the static experiments, the balanced partition of the ligand between the two phases in solution was taken into account also for the evaluation of the kinetic parameters. The direct and reverse apparent kinetic constants were thus splitted into two contributions, concerning the aqueous and the micellar phase. In such a way it was possible to consider the complexation kinetics just in the micellar phase. For this purpose a kinetic equation that involves two separate contributions has been derived in Appendix IV (equation (3.14)).
(3.14)
where the forward and reverse kinetic constants in water are indicated as and , while in the micellar phase they are pointed out as and . Equation (3.14) represents a straight line, whose slope and intercept correspond respectively to the forward (kf,fast) and reverse (kd,fast) constants of the reaction in the overall solution (reaction (3.6) and equation (3.13)). As and were already known from literature (García et al., 2007), and the global constants kf,fast and kd,fast have been evaluated from the dependence of 1/τfast on CM, and were determined by comparing equations (3.13) and (3.14) for each SDS concentration. Both and were found to depend on the medium
acidity. According to Scheme 3.1, the dependencies of and on [H+
] should be given by equations (3.15) and (3.16), respectively
(3.15)
(3.16)
where α and β have been already defined above and γ = KC/([H + ] + KC), with KC = [MHL + ][H+ ]/[MH2L 2+
]. Thus, for each SDS concentration a value of γ has been determined, using the corresponding value of KC (Table 3.2) and the acid concentration
evaluated according to equation (3.1). The plot of versus 1/[H+
] displays a linear trend at each SDS concentration as shown in Figure 3.11A, where the results of [SDS] = 3.5×10⁻²
M are represented. The data fit according to equation (3.14) yields the reaction parameters k1 and k2 reported in Table 3.3.
Table 3.3 Reaction parameters for the Ni(II)/SHA system at different SDS concentrations. I = 0.2 M; T = 298 K. 102 [SDS] (M) 10-3 k1 S (M-1 s-1 ) 10-2 k-1 S (s-1 ) 10-6 k2 S (M-1 s-1 ) k-2 S (s-1 ) 0 2.6 1.3 0.032 6.3 0.3 4.4 2.0 4.6 5.4 0.7 22.8 2.3 16.8 4.4 1.5 9.7 1.8 10.5 5.5 3.5 2.5 2.1 2.2 5.0 6.0 2.3 2.0 1.7 4.8
The value of /γ was found to depend linearly on [H+
] (Figure 3.11B) hence, according to equation (3.15) the reverse kinetic constants, and have been determined. The values of the obtained individual rate constants are reported in Table 3.4. The apparent equilibrium constant in micelle ( ) has been evaluated from the kinetic constants ratio, , in the pH range where only the fast kinetic effect is observable. The values so obtained are in good agreement with those provided by the static experiments (Figure
3.11C). The accordance of k1/k-1 and k2/k-2 values with K1 and K2 obtained from the
thermodynamic analysis (Table 3.2) strongly supports the effectiveness of the proposed reaction mechanism.
Figure 3.11 Kinetic behavior for the fast effect of the Ni(II)/SHA reaction in SDS 3.5×10⁻²
M, I = 0.2 M, T = 298 K. (A) Dependence of the forward rate constant, , on hydrogen ion concentration. (B) Dependence of the reverse rate constant, , on hydrogen ion concentration. (C) Dependence of on hydrogen concentration, evaluated from kinetic experiments, as / (■) and from spectrophotometric titrations (●).
Concerning the slow kinetic effect, it is worth to note that this is observed just at the higher analyzed pH value, pH = 5.9 (Figure 3.10B). Contributions to kinetic parameters values in the two phases have been separated for the slow effect too; therefore we are able to report the results in the pure micellar phase. The binding process, in this case, can be described by the two-step sequence (3.17).
Mf + Lf ⇄ MLT,I ⇄ MLT,II (3.17)
The apparent equilibrium constant, , should be a function of the rate constants of the two processes observed in the kinetic experiments, as shown in equation (3.18).
(3.18)
As commented before, the observed dependence of the rate constants on [H+
] suggests that several forms of both the ligand and the complex, differently protonated, should be involved in the binding process. Sequence (3.17) can thus be depicted in a more detailed form, as shown in Scheme 3.2.
Scheme 3.2 Reactive scheme for the Ni(II)/SHA system, involving the slow effect, in SDS micellar solution.
The overall rate constants of the slow effect, kf,slow and kd,slow is expressed by equation (3.19) which requires that values of 1/τslow tend to level off at the highest values of CM. This requirement is verified by the experimental trend displayed by the data pairs plotted in the inset of Figure 3.10B.
(3.19)
Separation of the contributions to 1/τslow of the reaction in the two phases has been done, resulting in equation (3.20), which is derived in Appendix IV.
(3.20)
By using the literature values (García et al., 2007)for the reaction parameters in water solution and the value obtained from the thermodynamic experiments, the values of the forward and reverse constants for the slow kinetic effect have been derived. Values of and are collected in Table 3.4.
Table 3.4 Time constants of the slow kinetic effect at different SDS concentrations for the Ni(II)/SHA system. I = 0.2 M; T = 298 K. 102 [SDS] (M) kS f ,slow (s -1) kS d,slow (s -1) 0 3.8 4.2 0.3 3.9 4.2 0.7 3.6 4.3 1.5 4.3 4.0 3.5 3.7 3.9 6.0 3.9 4.2 3.8 Micellar Catalysis In the presence of SDS, Ni2+
ion will be attracted electrostatically by the negatively charged micelle surface, whereas SHA will be retained on the micelle by hydrophobic forces. Under these circumstances, the reaction on the micelle surface is favored as the result of a local concentration increase of both reactants (James and Robinson, 1978). Spectrophotometric titrations were performed at different SDS concentrations, for each pH value, in order to evaluate the extent of the micellar catalysis on Ni(II) reaction with SHA. Introduction of the correct value of KA1 for each SDS concentration in equation (3.11) enabled us to estimate K1 and K2 of the complexation reaction, whose values are reported in Table 3.2 together with KA1 and KC.
It is found that K1 and K2 depend on SDS concentration in a similar way (for pH = 4.2÷5.9), both constants exhibiting a maximum at a surfactant concentration close to the CMC. Also the rate constants of the binding process display all the same trend for each analyzed pH value. Figure 3.12A shows the effect of SDS on the rate constants of complex formation. The values of show the maximum rate enhancement for a surfactant
concentration slightly lower than the CMC, corresponding to 7×10⁻³
M. The same dependence on SDS concentration is observed for the reverse constant of the fast kinetic effect, , (Figure 3.12B) and the apparent constant Kapp, obtained as / (Figure 3.12C). This behavior is characteristic of the catalysis effect of SDS micelles on the Ni(II)/SHA complexation, being the observed trend typical of a general bimolecular reaction rate in the presence of surfactant catalysis.
Figure 3.12 Micellar catalysis for the system Ni(II)/SHA at pH = 4.65, I = 0.2 M, T = 298 K. (A) Dependence of the forward rate constant, , on the SDS concentration.
(B) Dependence of the back rate constant, , on the SDS concentration. (C) Dependence of the equilibrium constant obtained from spectrophotometric titrations (■)
and expressed as / (●) on the SDS concentration.
3.9 Discussion
Table 3.1 shows that the pKA1 values of SHA do increase on going from water to SDS
solution, but less than observed in the case of ligands completely adsorbed on the micelle surface (Ghezzi et al., 2007; Biver et al., 2009). For these ligands the ∆pKA value is about
2, in agreement with the relationship ∆pKA = Ψ/59.2, where Ψ is the surface potential
(120mV for SDS) (Hartley and Roe, 1940). The lower value of ∆pKA1 observed for SHA
could be ascribed to the fact that this ligand is adsorbed only partially on SDS and, by consequence, the obtained acid dissociation constant value is intermediate between the value in water and the value in SDS. For both the complex formation equilibria and kinetics, separation of reaction contributions in the aqueous and micellar phase has proven to be essential to analyze the system. The separation procedure worked out in this thesis is of a completely general character and is suitable for any system that is partitioned between two different phases. Actually, we have applied the same treatment to an investigation on the system Ni(II)/PBHA (Phenylbenzohydroxamic acid) in SDS, previously performed in our laboratory that was not yet analyzed. As PBHA is equally distributed between water and micellar phase, separation of the two contributions, according to the method here described, resulted to be a successful approach also in this case.
Concerning the complex formation equilibria, Table 3.2 shows that the values of K1 are
rather insensitive to the presence of SDS, whereas the values of K2 display a dramatic
increase on addition of surfactant. Also, differently from KA1, the acid dissociation constant
of the protonated complex does not display important change in the presence of micelles. This behaviour is in apparent contrast with that of the Ni(II)/PADA system (Monteleone et al., 2004) where MHL is strongly stabilized by SDS, as shown by the large decrease of KC
and the large increase of K1 which becomes close to K2. However, the contrast can be
removed if one considers that concerning PADA the proton of MHL is bound to the amino group and, therefore, stays far from the reaction site. In this case, the increased proton concentration on the SDS surface inhibits the proton loss from the complex. On the other hand, in the case of SHA, the proton, being bound to the hydroxamate group, is part of the reaction site and should necessarily be removed in order the metal-oxygen bond to be formed. The high tendence to form the chelate (with proton expulsion) overcomes the proton mass action acting in the opposite direction, resulting in a value of K2 much higher
Concerning the complex formation kinetics of the Ni(II)/SHA system, Table 3.2 shows
that SDS exherts a catalytic effect on the steps of formation of both MHL (k1) and ML (k2).
This effect is expected since both steps are bimolecular and reaches its maximum at [SDS]
= 0.07 M, corresponding to the surfactant CMC. Looking at the reverse steps, Table 3.2
shows that k-1 >> k-2, in agreement with the fact that k-2 includes the work needed to
overcome the energy barrier necessary to break the chelate bond. Both k-1 and k-2 are
independent of the SDS concentration, as expected since the complex dissociation steps are
monomolecular. The reaction of complex formation of Ni(H2O)6 2+
are known to follow the
Id mechanism for which it turms out that k = KOSk*, where KOS is the stability constant of
an outer-sphere complex, while k* is the rate of water replacement by the ligand in the
inner solvation shell of the metal. The Eigen’s criterion states that, in the case of the Id
mode of activation, k* = kH2O, being kH2O the rate constant for the process of water
exchange at Ni(H2O)6 2+
ion. Since kH2O refers to a monomolecular process it is unlikely that
its value depends on the presence of the surfactant. On the other hand, owing to the
reaction restricted geometry provided by surfactant surface, the value of KOS does increase
on transferring the reactants from the water to SDS, thus explaining the dependence of k1
and k2 on [SDS].
The slow kinetic effect, which was observed also in aqueous solution (García et al., 2007) was explained considering that the formation of the Ni-SHA chelate induces the rotation of the phenol group around the C-C bond. Therefore, the formed complex will pass from the
cis to the trans conformation. Note that this cis trans rotation is a mononuclear process
in both directions, so its reaction rate is expected to be independent on [SDS], as experimentally found (Table 3.4).
The trans conformation is in principle suitable to allocate a second metal ion, thus providing the basic unti necessary for metallacrowns formation (Pecoraro et al, 1996).
Such a dinuclear complex was neither observed in the previous The slow kinetic effect, which was observed also in aqueous solution (García et al., 2007) nor in the present investigation. However in this thesis work it has been isolated in water solution of Fe(III), as reported in next chapter.
![Table 3.1 Dependence of SHA pK A1 on SDS concentration. 10 2 [SDS] (M) pK A1 (SHA) ΔpK A1 (SHA) 0 7.6 0.0 0.4 9.4 1.8 0.7 9.3 1.7 1.5 9.3 1.7 2.4 9.2 1.6 3.5 9.1 1.5 6.0 9.1 1.5](https://thumb-eu.123doks.com/thumbv2/123dokorg/7555779.109892/10.892.261.609.136.318/table-dependence-sha-sds-concentration-sds-sha-δpk.webp)
![Figure 3.9 dependence on [H + ] and [SDS] for the Ni(II)/SHA system. I = 0.2 M; T = 298 K](https://thumb-eu.123doks.com/thumbv2/123dokorg/7555779.109892/14.892.262.606.561.816/figure-dependence-h-sds-ni-ii-sha-i.webp)
![Table 3.2 Dependence of the equilibrium constants on [SDS] for the Ni(II)/SHA system at 298 K and I = 0.2 M (NaClO 4 )](https://thumb-eu.123doks.com/thumbv2/123dokorg/7555779.109892/15.892.131.780.166.320/table-dependence-equilibrium-constants-sds-ni-sha-naclo.webp)
