XVIIth World Congress of the International Commission of Agricultural Engineering (CIGR)
Hosted by the Canadian Society for Bioengineering (CSBE/SCGAB) Québec City, Canada June 13-17, 2010
AN INNOVATIVE COLORIMETRIC CALIBRATION METHOD USED TO QUANTIFY DIFFERENCES AMONG WILD AND REARED GILTHEAD
SEABREAM (SPARUS AURATA, LINNAEUS 1758)
C. COSTA1, F. ANTONUCCI1, F. PALLOTTINO1, E. CANALI1, C. BOGLIONE2, S. CATAUDELLA2, P. MENESATTI1*
1
CRA-ING – Agricultural Research Council, Agricultural Engineering Research Unit, Lab. for Advanced Engineering Applications in Agriculture (AgriTechLab) – Monterotondo (Roma) – Italy <[email protected]>
2
Aquaculture and Experimental Ecology Laboratory, Biology Department, University of Rome Tor Vergata, Rome – Italy
CSBE10XXX – Presented at YYY Conference or Symposium (Section II-B:
Aquacultural Engineering)
ABSTRACT The appearance of a product is a primary criterion in the purchasing decisions of consumers, being at the base of selection judgement of the product’s individual units quality. Appearance characters are defined by size, shape, form, colour and absence of visual defects. Appearance is utilized as a selection criterion throughout the market production chain, storage, marketing, and finally the utilization. Fish experts affirm to be able to visually discriminate among wild and reared fish of the same species by the fish colours. For the European fish market gilthead seabream (Sparus aurata) is, together with seabass (Dicentrarchus labrax), the most important marine cultured species. A novel colour calibration method based on the association between a standard colour chart and a Partial Least Squares (PLS) model developed in Matlab environment was developed. RGB declared values of the ColorCheker (24 patches) were used as y-block. The x-block was represented by the mean RGB values of the same 24 patches. Once colorimetrically calibrated, the images of 20 wild and reared seabreams were shape adjusted with landmark based geometric morphometric tools. Superimposed fishes were then compared with a PLS Discriminant Analysis. The results quantified differences between wild and reared fish. The proposed method of colour calibration allows the automatic finding out of frauds (reared fish sold as wild ones) and the identification of rearing methodologies able to produce wild-like gilthead seabream, in addition to quantitative investigation of other food products reducing the colour variance due to external factors.
Keywords: gilthead seabream, color chart, PLS, wild/reared quality, geometric morphometry
INTRODUCTION Maintenance of the natural skin pigmentation is of great importance from a commercial point of view, being directly associated with acceptance or rejection by the consumers (Shahidi et al., 1998) and the product market price. The degree and extent of pigmentation appear to be dependent of a number of factors including the type and level of dietary supplementation, the feeding duration, the species and strain, the age and/or size, or the sex of the fish (Torrissen and Naevdal 1984; Choubert et al., 1992;
Choubert and Blanc 1993). The appearance is a primary criterion in making purchasing decisions (Kays, 1999) and it is utilized as a selection criterion throughout the market production chain, storage, marketing, and finally the consumption. Generally appearance characters are defined by size, shape, form, colour and absence of visual defects. The functioning of modern colorimeters is comparable to the principle of colour perception used by the human eye (Choubert et al., 1993). In literature simple linear regression has frequently been used to describe the relationship between carotenoid concentration (one of the most important parameter to describe pigmentation) and colour. However, when large numbers of fish with wide ranges of carotenoid concentrations have been analysed, redness and other colour parameters seem to be related to carotenoid concentration in a nonlinear fashion, as described in this study (Smith et al., 1992; Christiansen et al., 1995). The proposed method of colour calibration would to allow the automatic finding out of frauds (reared fish sold as wild ones) and the identification of rearing methodologies able to produce wild-like gilthead seabream, in addition to quantitative investigation of other food products reducing the colour variance due to external factors.
MATERIALS AND METHODS The external coluration of 28 wild sea bream (Sparus aurata, L.) caught in the mid-eastern Tyrrhenian Sea (Civitavecchia, Italy) and 30 reared at the commercial hatchery ASA (Civitavecchia, Italy) were compared. Both lots have commercial size (mean weight: wild=259.5±46.0g; reared=342.8±32.3). Samplings were photographed after few hours post mortem. In order to measure the fish colour pattern, images were acquired with a high resolution camera Nikon P6000 and samples were illuminated with four photographic low consumption gas lamps with a power of 60 watt producing a light corresponding to 270 watt of the traditional bulbs. Such lamps presents a nominal illumination power of 3800 lumens paired with a light temperature of 5000 Kelvin degree (daylight) and an electronic converter that avoids the flickering effect.
.Manual white balance control, exposure and metering methods, were enabled. ISO sensibility was set to 100 to avoid noise appearance.
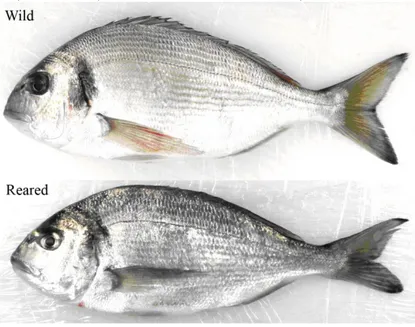
The GretaMachbeth ColorChecker 24 colour-patch was used as reference standard. Matlab 7.1 R14 was used to perform the image calibration based on PLS (Partial Least Square) calibration (Costa et al., 2009a). RGB declared values of the ColorCheker (24 patch) were used as y-block. The x-block was represented by the mean RGB value of the same 24 patch. This procedure allows the comparison of the fish colour patterns (Fig. 1).
After colour calibration to allow the comparison of the entire body fish area, on each fish a total number of 18 landmarks were digitized (Fig. 2). The first 13 landmarks were used to determine the region of interest to be compared among samples. Following the landmarks configuration the image RGB matrices was warped through a geometric morphometric procedure (Costa et al., 2009b; Menesatti et al., in press). In this way each pixel inside the ROI could be compared with the one in the same position of the other samples. For each individual the RGB values of each pixel were decomposed in a single line of values (129633 values).
The matrix (58x129633) representing the RGB colour inside the ROI values of each sea bream was analyzed with a Partial Least Square Discriminant Analysis (PLSDA; Sjöström et al., 1986; Sabatier et al., 2003; Costa et al., 2010). PLS is a soft modelling method for constructing predictive models with many and highly collinear factors. The technique looks for correlations among the RGB values of each pixel (x-block) and the
procedure. To determine the pixel’s contribution to the classification (wild vs reared) the load of each pixel (x variables) in each LV was extracted (Costa et al., 2009b).
Figure 1: Examples of calibrated images for each lot (wild and reared) examined.
Figure 2: A) Landmarks used for the warping procedure. Description: 1) snout tip; 2) position of the gold stripe on the profile; 3) projection of the opercular plate on the profile; 4) anterior insertion of the dorsal fin; 5) first soft ray of the dorsal fin; 6) posterior insertion of the dorsal fin; 7) and 9) anterior and posterior insertion of the caudal fin; 8) posterior most trunk extremity; (10) and (11) posterior and anterior insertion of the anal fin; 12) insertion of the pelvic fin; 13) ventro-lateral insertion of the opercular plate; 14) centre of the eye; 15) begin of lateral line; 16) projection of the first soft ray of the dorsal fin on the linear line; (17) and (18) upper (dorsal) and lower (ventral) insertion of the pectoral fin. B) ROI cut based on the first 13 landmarks.
RESULTS Table 1 shows the results of the PLSDA model. It is possible to observe as both the mean percentages of correct classification of the model and test are equal to 100%.
Table 1. Results of PLSDA model to highlight colorimetric differences between wild and reared seabream, n° of classified elements, n° of units (Y-Block) or n° of lots (wild and reared), n° Latent Vectors (LV) in the model.
n° classified elements 58 n° units (Y-block) 2
n° LV 4
% Cumulated Variance X-block 24.17 % Cumulated Variance Y-block 49.87 Mean Specificity (%) 100 Mean Sensitivity (%) 100 Mean Class. Err. (%) 0
Mean RMSEC 0.50
Random Probability (%) 50 Mean % Corr. Class. Model 100 Mean % Corr. Class. Indep. Test 100
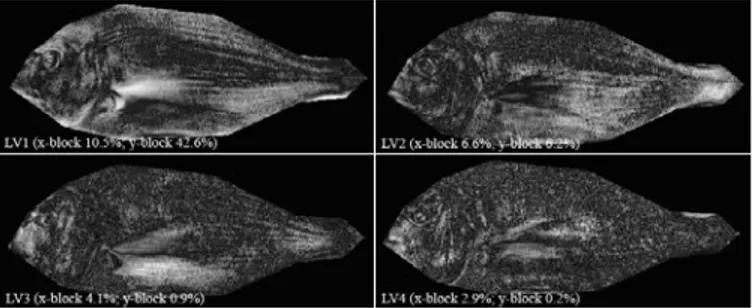
Figure 3 shows the loadings that each pixel gives to the construction of the model (the white pixels correspond to higher loadings). The first LV, which expresses the main variance on both X- and Y-block (X-block 10.5%; Y-block 42.6%), shows that the most important areas for the discrimination between wild and reared are the dorsal one and the cephalic one above the eye and around the gold stripe (the white area around the pectoral fin are due to the fin positioning).
Figure 3. PLSDA: scores of the pixels (x block) for each LV: white intensity is related to a higher contribution to the classification.
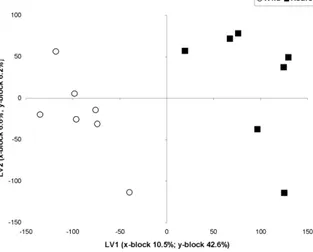
Figure 4 shows the scores of the 14 individuals used as test on the first two LVs. It is possible to observe the perfect separations between the first two lots.
Figure 4. PLSDA: Scatter plot of the scores on the first 2 LVs of the 25% test individuals. Mean RGB values in the area below the dorsal fin were measured for each sea bream. The Kruskal-Wallis test, which tests the equality of the medians, demonstrates the significant difference between wild and reared lots for all the colorimetric components: R (p = 5.056E-4), G (p = 2.233E-5) e B (p = 7.793E-7). For all the three components wild seabreams are lighter than reared ones, confirming the PLSDA results. For the first time those differences are quantitatively measured associating two emerging image analysis methodologies: colorimetric calibration (Costa et al., 2009b) and warping (Costa et al., 2009b; Menesatti et al., in press).
CONCLUSION The proposed method of colour calibration allows the automatic finding out of frauds (reared fish sold as wild ones) and the identification of rearing methodologies able to produce wild-like gilthead seabream, in addition to quantitative investigation of other food products reducing the colour variance due to external factors. Acknowledgements. This work was funded by the projects “Sistemi innovativi per la tracciabilita’ della filiera ittica: applicazione dell’analisi di tecnologie innovative per la ottimizzazione dei sistemi di controllo nella filiera ittica” and High-Vision (DM 19177/7303/08) from the Italian Ministry of Agricultural, Food and Forestry Politics. REFERENCES
Choubert, G., Blanc, J. M., and Counalin, C. 1992. Muscle carotenoid content and colour of farmed rainbow trout fed astaxanthin or canthaxanthin as affected by cooking and smoke-curing procedures. International Journal of Food Science and Technology 27: 277-284.
Choubert, G., and Blanc, J. M. 1993. Muscle pigmentation changes during and after spawning in male and female rainbow trout (Oncorhynchus mykiss) fed dietary carotenoids. Aquatic Living Resources 6: 163-168.
Christiansen, R., Struksnæs, G., Estermann, R., and Torrissen, O. J. 1995. Assessment of flesh colour in Atlantic salmon, Salmo salar L. Aquaculture Research 26: 311-321. Costa, C., Angelici, C., Scardi, M., Menesatti, P., and Uteri, C., 2009a. Using image
analysis on the ventral colour pattern in Salamandrina perspicillata (Savi, 1821) (Amphibia, Salamandridae) to discriminate among populations. Biological Journal of the Linnean Society 96: 35-43.
Costa, C., Pallottino, F., Angelici, C., Proietti, M., Capoccioni, F., Aguzzi, J., Antonucci, F., and Menesatti, P., 2009b. Colour calibration for quantitative biological analysis: a novel automated multivariate approach. Instrumentation Viewpoint 8: 70-71.
Costa, C., Menesatti, P., Aguzzi, J., D’Andrea, S., Antonucci, F., Rimatori, V., Pallottino, and P., Mattoccia, M., 2010. External shape differences between sympatric populations of commercial clams Tapes decussatus and T. philippinarum. Food And Bioprocess Technology, 3(1): 43-48.
Kays, S.J., 1999. Preharvest factors affecting appearance. Postharvest Biol. Technol. 15: 233-247.
Menesatti, P., Costa, C., Aguzzi, J., In press. Quality Evaluation of fish by hyperspectral imaging. In: Hyperspectral imaging for food quality analysis and control DW Sun (Ed), Elsevier.
Sabatier, R., Vivein, M., and Amenta, P., 2003. Two approaches for Discriminant Partial Least Square. In: Schader,M., Gaul,W., Vichi, M. (Eds.), Between data science and applied data analysis. Springer-Verlag, Berlin.
Shahidi, F., Metusalach, A., and Brown, J.A., 1998. Carotenoid pigments in seafoods and aquaculture. Crit. Rev. Food Sci. Nutr. 38: 1-67.
Sjöström, M., Wold, S., and Söderström, B., 1986. PLS Discrimination plots. In: Gelsema, E.S., Kanals, L.N. (Eds.), Pattern recognition in practice II. Elsevier, Amsterdam.
Smith, B. E., Hardy, R. W., and Torrissen, O. J. 1992. Synthetic astaxanthin deposition in pan-sized coho salmon (Oncorhynchus kisutch). Aquaculture 104: 105-119.
Torrissen, O.J., and Naevdal, G., 1984. Pigmentation of salmonids: genetical variation in carotenoid deposition in rainbow trout. Aquaculture 38: 59-66.