2
Literature Review
2.1 Multiphase System
2.1.1 Slip Velocity and Settling Velocity
Every process that involves chemical reactions or thermal and mass transfer between a liquid phase and solid particle is affected by the relative velocity between them. This velocity is generally called “slip velocity”.
Even though this kind of operations is widely used in the chemical industry there is a lack of information concerning the quantification of liquid and solid velocities in stirred tanks.
In the literature the two theories proposed to try to describe particle – liquid interactions in such system are basically two.
The fist one is the Kolmogoroff theory: it assumes that, in system with equal energy dissipation rate ε, mass transfer coefficients (thus slip velocities, being related) should be the same.
Mass transfer coefficients to spheres in a flowing fluid are usually calculated (Levins & Glastonbury, 1972) from equations of the form:
(
Sc)
f
Sh= Re, (2.1.1.1) where Re is the Reynolds number defined as
ν U DP
=
Re with DP referred to particle diameter, U referred to particle-liquid relative velocity, ν referred to liquid kinematic viscosity.
Sc is the Schmidt number:
v
D
Sh is the Sherwood number: v P D k D
Sh= with k referred to mass transfer coefficient.
According to Kolmogoroff theory the relative velocity U should be dependent on the Kolmogoroff length scale defined as:
4 / 1 3 0 = ε ν λ (2.1.1.2) If DP >> λ0 then
( )
3 1 ελ ∝ U while if DP << λ0 then 2 1 ∝ υ ε λ UIn the above equations the energy dissipation rate has been usually taken as the average power input/unit mass, though it is known that spatial energy distribution is far from being uniform.
The other approach is the terminal velocity-slip velocity theory.
Nienow, Bujac and Mullin ( 1972) showed that the slip velocity would be related to the terminal velocity in a still fluid. In their experiments they found that the mass transfer coefficient at conditions where the solid is just suspended kjs should not be less than that, kt, which would result form solid falling at its terminal velocity under the influence of gravity. In other words:
kjs =Ekt (2.1.1.3) where E was a function of a particle size as it is shown in table 2.1.1.1
Mean particle diameter (µm) E
470 1.2 730 1.24 1740 1.3
Table 2.1.1.1: Enhancement factor E (Nienow et al. 1972)
From this equation and considering that the increase in kjs above kt could also be due to the relative magnitudes of the slip and terminal velocities and that any increase in mass transfer coefficient above kjs due to increases in impeller speed could also be related to further increases in the slip velocity they obtained:
ujs = E2ut (2.1.1.4) and 8 . 0 = js js s N N u u (2.1.1.5)
where us is the actual slip velocity, ujs is the slip velocity of solid when just suspended, ut is the settling (or terminal) velocity of solid, N is the impeller speed, Njs is the impeller speed to just suspend particle.
Njs is calculated from Zwietering’s correlation (Zwietering, 1958):
( )
85 . 0 13 . 0 45 . 0 2 . 0 1 . 0 D X g D s N P js ∆ = ρ ρ ν (2.1.1.6)Where ν is the kinematic viscosity g is the gravitational constant ρ is the density of liquid
∆ρ is the density difference between solid and liquid
X is the percentage by weight of solid
D is the impeller diameter
s is a geometrical constant : 33 . 1 2 = D T s (Nienow, 1968)
with T = tank diameter
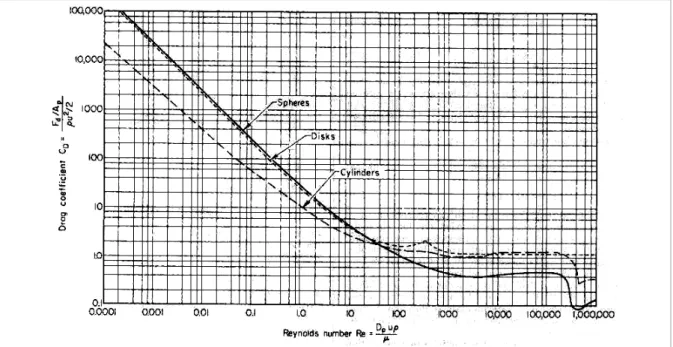
The settling velocity in a still fluid can be calculated using the equation reported by Perry ( 1997):
(
)
− = D s P t C gD u ρ ρ ρ 3 4 (2.1.1.7)where ρs is the density of solid and CD is the drag coefficient (see figure 2.1.1.1)
Both theories, though based on very different models, have been successful during different experiments (Nienow & Bartlett, 1974; Levins & Glastonbury, 1972) and on the other hand have showed some weaknesses. Nienow ( 1969) tried to correlate his results with Kolmogoroff theory and found a limitation in this approach: “… at the same power consumption, impeller of different size and in a different position give different mass transfer coefficients and … also the rate of increase of coefficient for any one impeller is a function of the impeller position and not just the power input…”.
On balance the terminal velocity-slip velocity theory showed some problems when the density difference between particles and the liquid tended to zero (Nienow, 1975).
More relatively recent works could be the link between some aspects of the two theories.
Magelli et al. ( 1990) measured solid concentration axial profiles in tanks stirred with multiple Rushton turbine. The profiles were interpreted with a one-dimensional sedimentation-dispersion model in which two parameters were present: an effective axial turbulent dispersion coefficient of the solid phase and the average settling velocity of the particles. Once the dispersion coefficient was already available form their previous work settling velocities were evaluated and they were found to be dependent on the ratio between the Kolmogoroff microscale and the particle diameter.
Figure 2.1.1.2: Us/Ut as a function of λ/Dp ( 1990)
Figure 2.1.1.2 shows the relationship found by the authors: where the turbulence is higher the settling velocity is lower.
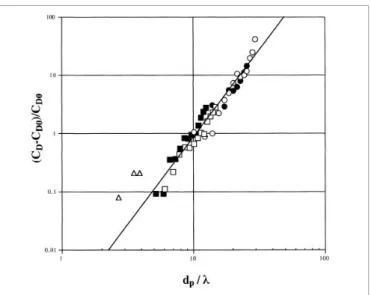
Brucato et al. ( 1998) developed a new technique for the experimental determination of particle settling velocity in a Couette-Taylor flow and found their data to be consistent with those found by Magelli et al. ( 1990).
Thus, the drag coefficient CD was then calculated from equation (2.1.1.7) and was compared to the one in still fluid CD0. Results are
reported in figure 2.1.1.3:
A simple correlation was proposed for these data: 3 4 0 8.76 10 × = − − λP D D D D C C C (2.1.1.8)
The authors suggested also that the constant factor appearing in equation (2.1.1.8) might slightly depend on particle diameter.
From what reported above it seems to be a relationship between the Kolmogoroff theory and the terminal velocity-slip velocity theory and other experimental studies on particle-liquid hydrodynamics in stirred vessel are thus much required.
2.1.2 Experimental Techniques
In recent years a number of authors have used non intrusive optical technique, such as LDA or PIV, in solid-liquid systems to try to determine the flowfields of the two phases and the relative velocities.
The main problem in such experiments is that optical techniques require a high degree of transparency to work properly and usually multiphase systems become relatively opaque even at low solid concentration, which results in the scattered light being restricted or blocked. This is due to the laser light being significantly diffused in all directions through multiple reflection and refraction effects by randomly distributed particles.
The usual approach to the issue is trying to match the refractive indices of the fluid and the particles.
Chen and Fan ( 1992) measured local flow properties of a three-dimensional gas-liquid-solid fluidized bed by using a PIV system in
conjunction with the refractive index matching techniques. They employed a sodium iodide solution (55% by weight) that matched the r.i of 500 µm glass beads. The discrimination between the different phases was done by analyzing the images pixel by pixel with a computer program.
Northrup et al. ( 1993) used Fluorescent Particle Image Velocimetry and the refractive index matching technique to measure flow velocities in the interstitial regions of a porous medium. The use of fluorescent particles allowed wavelength discrimination between the two phases just by filtering the light entering the camera. With PMMA particles the matching liquid medium was a mixture of organic liquids.
More recently other attempts have been done in stirred vessels by Zachos et al. ( 1996), Hasan et al. ( 1999), Virdung and Rasmuson ( 2004). All of them employed organic mixtures as liquid phase with PIV systems for particles tracking.
It has been pointed out that in order to obtain good results the controlling variable is the quality of the particles. Normally employed glass ballotini contain inhomogeneities and impurities that produce a huge light scattering even in a refractive index matching medium. On the other hand high-quality solid-phase materials, such as optical-grade glass or quartz, are much more expensive thus a compromise must be found.
However in our study such expensive particles where not available and it caused some problem during the setup of the experiments as it will be discussed in the following sections.
2.2 Turbulence studies
In stirred vessels a detailed knowledge of turbulence parameters is necessary in order to understand and model mixing rate dominated phenomena.
It is known that the discharge flows of a Rushton turbine or of a Pitched Blade turbine are characterized by coherent vortical structures induced by the blade motion, i.e. the trailing vortices.
Local experiments are required and are the only way to test the reliability of Computational Fluid Dynamics simulations.
2.2.1 Rushton Turbine
The pair of trailing vortices originating from behind each blade of a Rushton turbine has been largely discussed in the literature (see, for example, van't Riet & Smith, 1973; van't Riet & Smith, 1975; van't Riet, Bruijn & Smith, 1976; Van Der Molen & Van Maanen, 1978; Yianneskis & Whitelaw, 1993; Stoots & Calabrese, 1995; Lee & Yianneskis, 1998; Sharp & Adrian, 2001; Baldi & Yianneskis, 2004; Escudie, Bouyer & Line, 2004).
In the first pioneering work Van’t Riet and Smith ( 1973, 1975) recorded the flow of tracer particles both with a stationary camera and with a camera rotating synchronously at the stirrer speed.
They found that the position of the vortex axis is independent of Reynolds number at Re > 5 x 10³, and they were first formed in the range of Reynolds between 150 and 250.
Yianneskis and Whitelaw ( 1993) found that the impeller size could also influence the vortex trajectory.
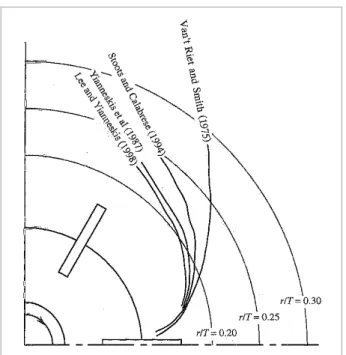
Other authors have carried out other experiments using LDA and LDV in order to identify more precisely the vortex axis both in radial and axial coordinates and to estimate turbulence properties. The results of some of these works are shown in figure 2.2.1.2:
Figure 2.2.1.2: trailing vortex axis (amended from Lee & Yianneskis, 1998)
Only in recent years PIV technique has been employed with success in this field of study (Sharp & Adrian, 2001; Baldi & Yianneskis, 2004; Escudie, Bouyer & Line, 2004).
Sharp and Adrian ( 2001) proposed a linear equation depending on the angular position for describing the trajectory of the vortex:
θ θ) 0.86 0.47
( = +
v
r and zv±(θ)=±(0.06+0.08θ) (2.2.1.1)
where rv is the radial axis coordinate
zv is the axial axis coordinate
θ is the angle from the impeller blade in the direction opposite to the blade rotation
Derksen et al. ( 1999) characterized the vortex size in a vertical plane of measurement relative to the blade position considering a dimensionless vorticity defined as:
TIP
U T
ω
ξ = (2.2.1.2)
where T is the tank diameter
Utip is the tip speed
ω is the dimensional vorticity defined as follow:
2 z U r Uz r ∂ ∂ − ∂ ∂ = ω (2.2.1.3)
where Uz is the axial velocity
Ur is the radial velocity
r is the radial coordinate
They used this parameter to identify the contour of the trailing vortices proposing a threshold value of 13 for Rushton turbine and of 7 for a PBT. Baldi and Yianneskis ( 2004) focused their attention on measuring Reynolds stresses and ε for Re between 15000 and 40000. They found that the normalized ensemble-averaged dissipation rate (ε/N3D2) in the impeller stream were in the range 5-10.
Escudie et al. ( 2004) proposed a new mathematical based technique to identify and locate trailing vortices and showed that the axis moves above the impeller plane while increasing the distance from the blade for both the upper and the lower vortex.
2.2.2 Pitched Blade Turbine
Concerning Pitched Blade Turbine, even though are commonly employed in industrial mixing applications, a smaller number of such exhaustive works can be found in the literature.
Most workers focused their attention on mean and r.m.s. velocities in the bulk of the vessel and around the impeller (Hockey & Nouri, 1996; Kresta & Wood, 1993; Javorsky et al. 1991).
Tatterson et al. ( 1980) observed the trailing vortices generated by a 45° 6-blade PBT in a vessel of diameter T = 295 mm, and a 45° 4-blade PBT in a 914 mm vessel. They found that the vertical structure of the 6-blade were not as well defined as for the 4-blade.
Schaefer et al. ( 1998) studied a 45° 4-blade PBT in a 152 mm diameter tank with clearance C = T/3. They found that the single vortex generated from behind a blade had an axis inclined at 20° to the horizontal and that its radius was essentially constant.
All the works previous mentioned, due to their measurement systems, focused their attention on the zone between to subsequent blades, i.e. 60° for a 6-blade (Rushton). Nothing has been studied about the behaviour of the vortices after have passed the incoming blade.
The aim of this study is to develop and evaluate a new method, that uses High Speed PIV, in order to bridge this gap.