Soft Chemistry Routes for the Synthesis of Sr
0.02La
0.98Nb
0.6Ta
0.4O
4Proton Conductor
Alma B. Santib´a ˜nez-Mendieta,aEmiliana Fabbri,bSilvia Licoccia,a,∗and Enrico Traversaa,b,∗,z
aDepartment of Chemical Science and Technology & NAST Center, University of Rome Tor Vergata, 00133 Rome, Italy bInternational Center for Materials Nanoarchitectonics (MANA), National Institute for Materials Science (NIMS),
Tsukuba, Ibaraki 305-0044, Japan
Proton conducting Sr0.02La0.98Nb0.6Ta0.4O4powders were prepared by auto-combustion or co-precipitation methods from aqueous solutions using citrates and oxalates as complexing agents. After calcination at 1100◦C the two methods lead to powders with sub-micrometric average particle size, 0.5μm and 0.7 μm, respectively. Upon sintering at 1600◦C, pellets with an average grain size of 11μm for the auto-combustion method and of 7 μm for the co-precipitation method were obtained. The electrical conductivity measured on sintered pellets at 800◦C in wet argon atmosphere was 1.9× 10⁻⁴S cm−1for the material obtained by co-precipitation method, 1.8× 10⁻⁴S cm−1for the one derived from auto-combustion method, and 7.4× 10⁻⁵S cm−1for the one produced by solid state reaction. The improvement in conductivity of the wet chemistry methods with respect to the solid state reaction was ascribed to the better control of the cation mixing with the synthetic conditions.
© 2011 The Electrochemical Society. [DOI:10.1149/2.027112jes] All rights reserved.
Manuscript submitted April 19, 2011; revised manuscript received September 1, 2011. Published October 31, 2011. This was Paper 779 presented at the Montreal, QC, Canada, Meeting of the Society, May 1–6, 2011.
High temperature proton conducting (HTPC) oxides have lately received increasing attention because of their possible application in energy conversion and storage devices such as hydrogen per-meation membranes, sensors or solid oxide fuel cells (SOFCs). As electrolyte materials for SOFC applications, these oxides offer sev-eral advantages over the most conventional oxygen-ion conducting electrolytes.1–3Taking advantage of the low activation energy for
pro-ton conduction, the use of HTPCs allows a reduction in the SOFC operating temperature without decreasing significantly the cell per-formance, whilst also reducing SOFC costs. Furthermore, in contrast from SOFCs based on oxygen-ion conducting electrolytes, protonic SOFCs generate water at the cathode side without diluting the fuel and thus reducing the cell efficiency. The breakthrough in HTPCs came in the early 1980s when Iwahara and co-workers showed that doped SrCeO3and other perovskite-related oxides presented proton conduction in a hydrogen-containing atmosphere at high tempera-tures. Following this, several studies have focused on these Ce-based perovskite oxides, though they show the drawback of decomposing under CO2containing atmospheres.4,5
Recently, raearth ortho-niobates and ortho-tantalates with a re-lated structure (RE(1-x)AxMO4, RE= La, Nd, Gd, Tb, Er, Y; A = Ca, Sr, Ba; M= Ta, Nb) have been proposed as HTPCs when exposed to water or hydrogen-containing environments. Moreover, these com-pounds have a good stability under CO2 containing atmospheres.6 In particular, LaNbO4 doped at 2 mol% with Sr, produced by spray pyrolysis, shows a total conductivity of 4× 10⁻⁴S cm−1at 800◦C.7
However, around 500◦C this material undergoes a phase transition from a fergusonite structure to a scheelite one, which causes a change in the conductivity behavior and therefore a modification of the acti-vation energy from 0.77 eV to 0.57 eV.6The LaNbO
4proton conduc-tivity is relatively small and its use in a SOFC device can be foreseen using this electrolyte deposited as a thin film, for example prepared by using the pulsed laser deposition (PLD) technique.8,9However, the
temperature needed to obtain the film growth is above 500◦C, so that the material would be deposited in the tetragonal phase, but it would change to monoclinic as the material returns to the ambient temper-ature. Avoiding such phase transformation is a challenge to improve LaNbO4characteristics for its potential use as electrolyte.
Chemical similarities of niobium and tantalum directed the at-tention to LaTaO4. For this oxide the conductivity is reported to be 1.5× 10⁻⁴S cm−1at 800◦C with 1 mol% Ca doping, when produced
∗ Electrochemical Society Active Member. zE-mail:[email protected]
by solid state reaction, but this material also undergoes a phase tran-sition around 220◦C.10Solid solutions of LaNbO
4 and LaTaO4have been studied and the phase transition for LaNb0.6Ta0.4O4 has been reported to occur at 800± 10◦C,11 thus suggesting the possibility
to fabricate an electrolyte suitable to operate a SOFC below 800◦C without structural changes. The objective of this work is to study the conductivity of Sr0.02La0.98Nb0.6Ta0.4O4 material, synthesized using wet-chemistry methods.
The synthesis of complex proton conductor oxides by wet chem-istry routes is a way of decreasing the processing temperature, improv-ing the morphological homogeneity, and controllimprov-ing the composition and particle size, all desirable features for the high-quality fabrica-tion of SOFC electrolytes. A few sol-gel procedures using oxalates, malates and citrates as chelating agents have been reported for the syn-thesis of niobate powders having homogeneous morphology and low sintering temperature.7,12The co-precipitation method has also been
reported to produce high-quality materials, though precursor solu-tions are difficult to obtain, as for the sol-gel procedure, due to the low cation solubility.13For the successful synthesis of homogeneous
com-pounds, preparing suitable coordination compounds with niobium and tantalum together with rare-earth soluble species into a homogeneous solution is needed. In the sol-gel-based auto-combustion technique, the chelating agent is normally used as a fuel.14 On these grounds,
the aim of this work was to fabricate Sr0.02La0.98Nb0.6Ta0.4O4via the auto-combustion and co-precipitation methods incorporating citrates or oxalates with nitrates, and compare their morphological and electri-cal characteristics with respect to products obtained by conventional solid state reaction.
Experimental
Co-precipitation synthesis.— 10 mmol of ammonium niobium ox-alate (C4H4NNbO9· nH2O, 99.99%, Aldrich), 0.03 mmol of strontium nitrate (Sr(NO3)2 98%, Wako) and 16.3 mmol of lanthanum nitrate (La(NO3)· 6H2O, 99.9%, Wako), were dissolved in separate solutions and the cation content in every solution was determined by inductively coupled plasma (ICP) optical emission spectroscopy (Nippon Jarrel-Ash Co. Iris). Tantalum oxalate was prepared from 6.6 mmol of as-purchased tantalum chloride (TaCl5, 90.0+%, Wako) that was poured in water to form a colloidal suspension. Ta2O5· nH2O was formed by adding 5 M ammonia solution. The suspension was left to age for 12 h at room temperature. The hydrated oxide was filtered but kept hu-mid to prevent the formation of tantalum oxide (Ta2O5). The product was washed three times with 1 M ammonia solution using AgNO3to
verify the absence of chloride ions. A water ammonium-monoxalate solution (AMoxa, (NH4)2C2O4· H2O, 95%, Wako) ([AMoxa]/[Ta] = 1) was prepared and heated to 75◦C; then, the washed hydrox-ide was dissolved in it to obtain the tantalum-oxalate solution. The tantalum content on this final solution was determined by ICP analysis. Two solutions, one prepared by combining the niobium and tantalum precursor solutions, and the other containing the lanthanum and stron-tium solutions were then prepared. The oxalate solution was poured into the nitrate solution, and the precipitated lanthanum oxalate was dissolved with nitric acid, thus obtaining a homogeneous solution of the four cations. This solution was dripped in 2 M ammonia solution to form a precipitate that was filtered and dried at 100◦C. This final material was the precursor powder from the co-precipitation method. Auto-combustion method.— The previously described strontium and lanthanum nitrate solutions were used. To prepare a tantalum-citrate solution, Ta2O5· nH2O was prepared as previously described and then dissolved in citric acid (CA, 98%, Wako) ([CA]/[Ta]= 2). Niobium citrate was prepared by precipitating ammonium niobium oxalate in ammonia solution to form the Nb2O5· nH2O, which was kept humid to avoid the niobium oxide (Nb2O5) formation; then, the product was filtered and subsequently dissolved in citric acid ([CA]/[Nb]= 1). ICP analysis was carried out on both oxalate solu-tions. The four solutions were then mixed adjusting the pH to 7 with concentrated ammonia solution. The solvent was then evaporated and the obtained gel was ignited and burned until ashes were obtained.
Solid state reaction synthesis.— As starting materials, Nb(V) oxide (Nb2O5, 99.9%, Wako), Ta(V) oxide (Ta2O5, 99.9%, Wako), lanthanum oxide (La2O3, 99.5%, Wako), and anhydrous strontium nitrate (Sr(NO3)2, 98%, Wako) were mixed in the proper stoichiomet-ric ratio. The mixture was subjected to ball milling for one day and then treated by two calcination steps at 1400◦C for 5 h, performing a grinding step in between the two thermal treatments.
Characterization.— Simultaneous thermogravimetric and differ-ential thermal analysis (TG-DTA) (NETZSCH, STA 409) of both precursor powders was performed in order to track the mass and ther-mal change effects leading to the oxide formation. The samples were heated up to 1400◦C in air with a heating rate of 5◦C min−1. The crys-talline structure of the powders and pellets was studied with X-ray diffractometry (XRD, Rigaku RINT Ultima III with Cu Kα radiation) using a scanning speed of 0.04◦s−1 in the 20◦–55◦ 2θ range, with 40 kV and 40 mA. Sample morphology was observed with a scanning electron microscope (SEM, Hitachi S-4800).
A linear shrinkage study was performed by heating the samples in air from 25◦C to 1400◦C with a heating rate of 5◦C min−1using a dilatometer (NETZSCH, DIL402E). The density of the pellets was measured by the Archimedes method, using water at 22.5◦C and the crystallographic densities as theoretical densities.15
The electrical conductivity was determined by electrochemical impedance spectroscopy (EIS) using a multichannel potentiostat (Bio Logic VMP3) in wet Ar (∼3% humidity) and dry Ar atmospheres over the 1 Hz – 1 MHz frequency range, with an ac voltage amplitude of 800 mV between 500◦C and 800◦C. EC-Lab software was used to control the potentiostat and the acquired data were fit to equivalent circuits using Zview software. The electrodes were assembled by coating both sides of the pellets with gold paste (Nilaco Corporation), drying at 100◦C and firing to 1000◦C for 10 minutes in air.16
Results and Discussion
Powder synthesis.— Figure1shows the thermogravimetric (TG) and differential thermal analysis (DTA) curves for the powder precur-sors derived from the auto-combustion (Fig.1a) and co-precipitation (Fig.1b) methods. For the sample derived from auto-combustion, the TG curve shows a total weight loss of 55 wt%. Three main weight loss steps can be identified: a 4 wt% loss between 60◦C and 135◦C, accom-panied in the DTA curve by an endothermic peak at 100◦C, ascribable
Figure 1. Thermogravimetric (TG) and differential thermal analysis (DTA) curves for the Sr0.02La0.98Nb0.6Ta0.4O4 powders prepared by (a) auto-combustion method and (b) co-precipitation method.
to adsorbed water release; a 30 wt% loss between 300◦C and 550◦C, accompanied by a broad exothermic DTA peak, due to the decompo-sition of organic residues; and finally a 4 wt% loss between 700◦C and 850◦C, ascribable to carbonate decomposition. The complete pattern is similar to the previously reported patterns for niobates.12For the
co-precipitation precursor the TG curve shows a smaller total weight loss of 47.2 wt%, divided into four steps. The first step is an 11 wt% loss from 60◦C to 170◦C, corresponding to adsorbed water release. Between 220◦C and 310◦C the loss was 25 wt%, attributable to the ox-alate decomposition.17A 5 wt% loss can be observed between 360◦C and 430◦C, which can be related to the nitrate decomposition. The fi-nal 2 wt% loss from 815◦C to 845◦C is attributed to the decomposition of oxy-nitrates and oxy-carbonates.18,19
Given the TG-DTA results, the co-precipitation and auto-combustion precursors were calcined to various temperatures. The formation of a single phase was achieved with a thermal treatment at 1100◦C for 10 h. For the reference method, i.e. solid state reac-tion, the reported thermal studies set the temperature at 1400◦C.11
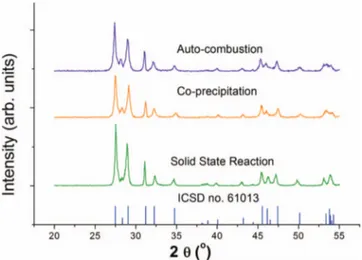
Figure 2 shows the XRD patterns for the Sr0.02La0.98Nb0.6Ta0.4O4 powders synthesized by co-precipitation and auto-combustion and heated to 1100◦C for 10 h. Figure2reports also the XRD pattern of the powder produced as described above by solid-state reaction and calcined at 1400◦C. In all the three cases, the same single phase was
Figure 2. X-ray diffraction patterns of La0.02Sr0.98Nb0.6Ta0.4O4powder cal-cined at 1100◦C for auto-combustion, co-precipitation and solid state reaction routes, and the ICSD pattern that corresponds to LaNbO4monoclinic structure.
observed, which corresponds well to LaNbO4with monoclinic struc-ture. The mean crystallite size, calculated using the Debye-Scherrer equation,20with the (112) diffraction peak was found to be 34 nm for
the co-precipitated sample, 64 nm for the sample prepared by auto-combustion, and 49 nm for the sample prepared by solid-state reaction. Figure 3 shows the SEM micrographs of the calcined Sr0.02La0.98Nb0.6Ta0.4O4 powders. The sample prepared by the auto-combustion method showed an average particle size of 0.5μm
Figure 3. SEM images of calcined La0.02Sr0.98Nb0.6Ta0.4O4particles by (a) auto-combustion, (b) co-precipitation and (c) by solid state reaction.
Figure 4. Linear shrinkage and densification rate during sintering of Sr0.02La0.98Nb0.6Ta0.4O4.
with a spheroid shape, with some agglomeration of primary particles (Fig.3a). By using the co-precipitation method, an average particle size of 0.7μm was obtained with primary particles in larger agglom-erates (Fig.3b). Finally, the solid state reaction powder presented an average particle size around 1μm with particles having sharp edges (Fig.3c).
Sintering performance.— A study of the densification behav-ior was performed for the Sr0.02La0.98Nb0.6Ta0.4O4 green pellets. Figure4shows the curves obtained for linear shrinkage and densifi-cation rate as a function of temperature. For the samples prepared by auto-combustion, the maximum shrinkage rate was found at 1350◦C, while for those prepared by co-precipitation it was found at 1416◦C. Pellets made of the auto-combustion produced powder were sintered at 1400◦C for 10 h and 1600◦C for 10 h, showing relative densities of 85% and 92% with respect to the theoretical value, respectively. Pellets of the sample produced by the co-precipitation procedure were sintered at 1500◦C for 10 h and 1600◦C for 10 h, obtaining pellets with relative densities of 87% and 95%, respectively. In comparison, the pellets manufactured by the solid state reaction method, sintered also at 1600◦C for 10 h, achieved a relative density of 91%.
TableIshows the cation concentration obtained by ICP analysis of the sintered pellets using the three different methods against the nominal values of the Sr0.02La0.98Nb0.6Ta0.4O4 composition. The re-sults showed that for all the samples the deviations from the nominal values are relatively small.
Figure5shows the SEM micrographs of the fracture surface of the three pellets sintered at 1600◦C for 10 h. All the samples presented a relatively dense structure, though some micro-structural differences can be identified. For the auto-combustion sample (Fig. 5a), the morphology of the grain boundaries cannot be easily distinguished and longitudinal traces are present along the grains, indicating that the fracture was intra-granular. For the co-precipitation sample (Fig.5b), the grain boundaries were visible and smooth, suggesting
Table I. Cation concentrations (mol%) measured using ICP analysis, for the Sr0.02La0.98Nb0.6Ta0.4O4 sintered pellets prepared by solid state reaction (SSR), co-precipitation and auto-combustion method compared with the nominal values. Element analyzed Nominal SSR Co-precipitation Auto-combustion
Sr 1.00 0.96 1.03 0.99
La 49.00 49.48 49.17 49.55
Nb 30.00 30.67 29.01 29.35
Figure 5. SEM images of fractured pellets of Sr0.2La0.98Nb0.6Ta0.4O4by (a) auto-combustion, (b) co-precipitation and (c) solid state reaction.
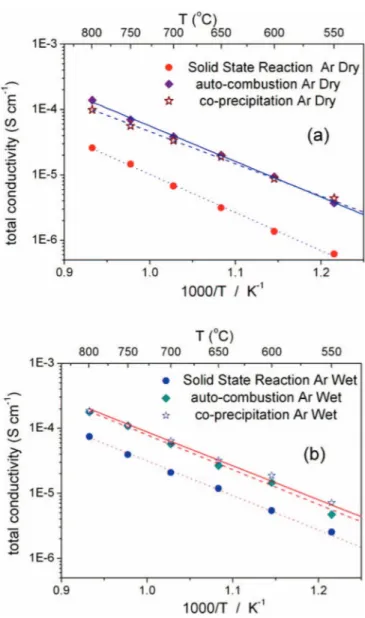
Figure 6. Total electrical conductivity of Sr0.2La0.98Nb0.6Ta0.4O4 sintered pellets in (a) dry argon and (b) wet argon atmospheres, as function of temper-ature for different methods of synthesis.
that separation of the particles occurred along the grain boundaries. For the solid state reaction sample (Fig.5c), grains appear separated and the main fracture path was inter-granular. The histogram was built by laying a series of randomly distributed lines on the image and measuring the length of the intercepted grains. The grain size distribution was fit to the pertinent distribution using an iterative computation algorithm known as Levenberg-Marquardt algorithm,21
resulting in a log-normal distribution.22,23For the pellets fabricated
by auto-combustion procedure the average grain size was 10.95± 2.25μm, 6.47 ± 2.62 μm for the co-precipitation method, and 5.12 ± 2.30 μm for the solid state reaction.
Conductivity.— Figure 6 shows the Arrhenius plots of the to-tal conductivity measured in wet and dry argon atmospheres for
Table II. Activation energy (Ea) and pre-exponential term (A) of the total Sr0.02La0.98Nb0.6Ta0.4O4conductivity.
Auto-combustion Co-precipitation Solid state reaction
Ar Dry Ar Wet Ar Dry Ar Wet Ar Dry Ar Wet
Ea (eV) 1.16± 0.02 1.14± 0.28 1.06± 0.16 1.05± 0.03 1.18± 0.03 1.08± 0.02
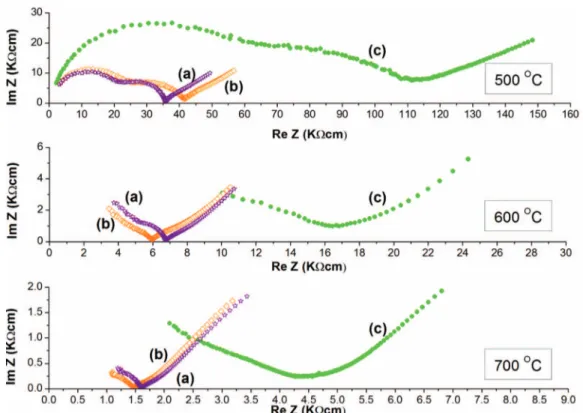
Figure 7. Complex impedance plane plots at 500, 600 and 700◦C of Sr0.2La0.98Nb0.6Ta0.4O4samples produced by: (a) auto-combustion, (b) co-precipitation and (c) solid state reaction.
the Sr0.02La0.98Nb0.6Ta0.4O4 pellets, prepared with the three meth-ods. In the whole range of temperature investigated, the conduc-tivity values measured for the auto-combustion and co-precipitation samples were almost one order of magnitude larger than the con-ductivity measured for the samples prepared by solid state reaction, both in dry (Fig. 6a) and in wet (Fig. 6b) Ar atmospheres. De-spite the Sr0.02La0.98Nb0.6Ta0.4O4 conductivity was about one order of magnitude lower than the conductivity reported in the literature for Sr0.02La0.98NbO4 and Ca0.01La0.99NbO46,7, Sr0.02La0.98Nb0.6Ta0.4O4 did not present the drawback of phase transition below 800◦C.
The values calculated for the activation energy and the pre-exponential factor are summarized in the table II. The activation energy values decreased going from dry to wet, while the pre-exponential term increased, indicating the proton conducting behavior of the material. The pre-exponential term is associated with charge carrier concentration, and larger values were observed for the samples prepared by wet-chemistry routes. These data show that the wet chem-istry routes allowed a better control of the sample microstructure and homogeneity that resulted in larger proton conductivity. A similar be-havior has been reported for different proton conducting oxide, yttrium doped barium zirconates (BaZr1-xYxO3-δ, where 0.2≤ x ≤ 0.5): in this case the pre-exponential term was larger for 20 mol% Y-doped barium zirconate which showed also the highest conductivity compared to the other samples with larger Y content.16It is worth noticing that in
the case of CaxLa1-xNbO4at 500◦C the activation energy varies from 0.54 eV to 0.77 eV as a consequence of the phase transformation from tetragonal to monoclinic and that such transformation does not occur for the tantalum doped material, which is stable in the monoclinic phase in the 500–800◦C range.6
Figure7shows the complex impedance plane plots measured at 500, 600 and 700◦C for the tested pellets manufactured by the three different synthesis methods. For each sample, at 500◦C three con-tributions are clearly visible in the complex impedance plane plots; based on the values of the specific capacitance, the first and the second semicircles were associated to the bulk and grain boundary contribu-tion, while the polarization at lower frequency was associated to the
electrode response. At 600 and 700◦C the complex impedance plane plots showed only the grain boundary and electrode responses.
Conclusions
Sr0.02La0.98Nb0.6Ta0.4O4 was successfully synthesized by auto-combustion and co-precipitation methods from an aqueous solution containing citrate and oxalate complexes. For both methodologies the synthesis temperature is 1100◦C, which is lower with respect to the solid state reaction procedure, making it a more environmen-tal friendly process. The sintering temperature was 1600◦C for both methodologies and the conductivity achieved was 1.9× 10⁻⁴S cm−1 and 1.8× 10⁻⁴S cm−1at 800◦C for the co-precipitation method and for the auto-combustion method, respectively, both larger than the solid state reaction conductivity in the same conditions, most likely because of the better control on cation-concentration and distribution that can be attained with wet-chemistry methods, and in the better microstructure achieved.
Acknowledgments
This work was partially supported by the Ministry of Foreign Affairs (MAE) of Italy under the framework of the Italy-Japan Joint Lab on Materials Nanoarchitectonics for Sustainable Development (MaNaSD), and by the World Premier International Research Center Initiative of MEXT, Japan.
References
1. E. Fabbri, D. Pergolesi, and E. Traversa,Chem. Soc. Rev., 39, 4355 (2010). 2. T. Norby,Nature., 410, 877 (2001).
3. K. D. Kreuer,Annu. Rev. Mater. Res., 33, 333 (2003).
4. H. Iwahara, Y. Asakura, K. Katahira, and M. Tanaka,Solid State Ionics, 168, 299 (2004).
5. H. Iwahara, T. Esaka, H. Uchida, and N. Maeda,Solid State Ionics, 3/4, 953 (1981).
6. R. Haugsrud and T. Norby,Nat. Mater., 5, 193 (2006).
7. T. Mokkelbost, I. Kaus, R. Haugsrud, T. Norby, T. Grande, and M. A. Einarsrud,J. Am. Ceram. Soc., 91, 879 (2008).
8. J. H. Shim, T. M. G¨ur, and F. B. Printz,Appl. Phys. Lett.92, 253115 (2008). 9. D. Pergolesi, E. Fabbri, A. D’Epifanio, E. Di Bartolomeo, A. Tebano, S. Sanna, S.
Licoccia, G. Balestrino, and E. Traversa,Nat. Mater., 9, 846 (2010). 10. R. Haugsrud and T. Norby,J. Am. Ceram. Soc., 90, 1116 (2007).
11. F. Vullum, F. Nitsche, S. M. Selbach, and T. Grande,J. Solid State Chem., 181, 2580 (2008).
12. E. Camargo, E. Longo, and E. Leite,J. Sol-Gel Sci. Technol., 17, 111 (2000). 13. A. Watanabe, H. Haneda, Y. Moriyoshi, S. Shirasaki, S. Kuramoto, and H. Yamamura,
J. Mater. Sci., 27, 1245 (1992).
14. L. Bi, Z. Tao, C. Liu, W. Sun, H. Wang, and W. Liu,J. Membr. Sci., 336, 1 (2009). 15. S. Tsunekawa and H. Takei,Phys. Status Solidi (a)50, 695 (1978).
16. E. Fabbri, D. Pergolesi, S. Licoccia, and E. Traversa,Solid State Ionics, 181, 1043 (2010).
17. B. Viswanathan, J. Gopalakrishnan, V. Srinivasan, and M. V. C. Sastri,J. Thermal Anal., 3, 4 429 (1971).
18. S. Mentus, D. Jeli´c, and V. Grudi´c,J. Thermal Anal. Calorim., 90, 393 (2007). 19. M. Suresh, A. V. Prasadarao, and S. Komarneni,J. Electroceram., 6, 147 (2001). 20. R. Jenkins and R. Snyder, Introduction to X-Ray Powder Diffractometry, John Wiley
and sons, p. 81, New York, 1996.
21. W. H. Press, B. P. Flannery, S. A. Teukolski, and W. T. Vetterling, Numerical Recipes in C: The Art of Scientific Computing, 2nd Edition, Cambridge University Press, p. 994, New York, 1992.
22. E. L. Crow and K. Shimizu, Log-normal distributions, theory and applications, Series III: statistics, textbooks and monographs, p.1 Marcel Dekker, New York (1988) 23. R. B. Bergmann and J. Krinke,J. Cryst. Growth., 177, 191 (1997).