UNIVERSITÀ DEGLI STUDI DI ROMA
"TOR VERGATA"
FACOLTA' DI SCIENZE MATEMATICHE FISICHE E
NATURALI
DOTTORATO DI RICERCA IN
BIOLOGIA CELLULARE E MOLECOLARE
XXII Ciclo
Protein Tyrosine Phosphatase 1B (PTP1B):
Identification of new substrates and new potential mechanism of
modulation of the Ras pathway
Emanuela Ferrari
A.A. 2009/2010
Docente Guida/Tutor: Prof. Gianni Cesareni
Coordinatore: Prof. Gianni Cesareni
Index ABSTRACT ... 4 INTRODUCTION ... 5 PHOSPHOTYROSINE NETWORK ... 5 THE PTP FAMILY ... 6 CLASSICAL PTYR-SPECIFIC PTPS... 6
THE PTP1B STRUCTURE AND REGULATION ... 8
THE PTP1B CATALYTIC MECHANISM ... 9
THE GENERATION OF „SUBSTRATE TRAPPING‟ MUTANT TO IDENTIFY PTP1B SUBSTRATES ... 11
THE PTP1B SUBSTRATES ... 13
METABOLIC FUNCTION OF PTP1B ... 13
THE ROLE OF PTP1B IN CANCER ... 14
TC-PTP:THE CLOSEST HOMOLOGUE TO PTP1B ... 17
EPIDERMAL GROWTH FACTOR RECEPTOR (EGFR)SIGNALING ... 18
Phosphatidylinositol 3 kinase/Akt pathway ... 19
Pathway induced by PLC- ... 19
Ras/Raf/MAP Kinase Pathway ... 19
ROLE FOR GAB1 AND SHP2 IN EPIDERMAL GROWTH FACTOR-INDUCED RAS ACTIVATION ... 20
AIM OF THE WORK ... 23
RESULTS ... 25
GST PULL-DOWN ASSAYS IDENTIFY PLC-,GAB1 AND SHP2 AS SPECIFIC SUBSTRATES OF PTP1B ... 25
OVER-EXPRESSION OF PTP1B IN HEK293 CELLS SPECIFICALLY DECREASES TYROSINE PHOSPHORYLATION OF THE INFERRED SUBSTRATES UPON INSULIN STIMULATION ... 25
PLC-,GAB1 AND SHP2 PHOSPHORYLATION, INDUCED BY SRC KINASE, IS REDUCED IN CONDITION OF PTP1B OVER-EXPRESSION. ... 29
GENERATION OF STABLE CELL LINES EXPRESSING SIRNA AGAINST PTP1B ... 32
DEPLETION OF PTP1B AFFECTS PLC-,GAB1 AND SHP2 TYROSINE PHOSPHORYLATION ... 33
PTP1B CONTROLLED OVER-EXPRESSION DECREASES TYROSINE PHOSPHORYLATION OF PLC-,GAB1 AND SHP2 ... 37
PTP1B SPECIFICITY: THE RELATED PHOSPHATASE TC-PTP DOES NOT DEPHOSPHORYLATE PLC-1,GAB1 AND SHP2 PROTEINS ... 39
EGF AND INSULIN HORMONES: A DIFFERENT RESPONSE OF HEK293 CELLS ... 41
PTP1B SPECIFICALLY INTERFERES WITH SHP2 RECRUITMENT BY GAB1 AND WITH ERK1/2 ACTIVATION ... 43
DISCUSSION ... 50
METHODS ... 54
REAGENTS, ANTIBODIES AND PLASMID CONSTRUCTS ... 54
GST FUSION PROTEIN PURIFICATION ... 55
GENERATION OF A STABLE CELL LINE EXPRESSING AN SIRNA TARGETING PTP1B MRNA ... 55
CELL CULTURE, TRANSFECTION AND EXTRACT ANALYSIS ... 55
CELL STIMULATION, PREPARATION OF CELL LYSATE ... 56
IMMUNOPRECIPITATION AND IMMUNO-BLOTTING ... 56
FAR WESTERN ASSAY ... 57
PULL-DOWN ASSAYS ... 57
Abstract
Protein tyrosine phosphatases play a crucial role in signal transduction. To advance our understanding of the network based on this enzyme family, we have developed a combined experimental and computational approach to correctly place the tyrosine phosphatases in the context of a functional human interactome. We have applied this strategy to the identification of new PTP1B phosphatase substrates. We have used a Bayesian approach to integrate information about substrate preference, as determined by probing high density phospho-peptide chips, and distance in the human protein interaction network to rank phospho-proteins according to likelihood of being PTP1B substrates. By focusing on the proteins involved in the EGFR pathway, we identified PLC-, Gab1 and SHP2 as putative PTP1B substrates. A variety of in vitro and in vivo approaches were used to validate this prediction. The activity of PTP1B on PLC-, Gab1 and SHP2 tyrosine phosphorylation were also confirmed by phosphatase over-expression and siRNA knock down experiments. TC-PTP, the closest PTP1B homologue, does not dephosphorylate PLC-, Gab1 and SHP2, demonstrating a specificity of PTP1B towards these three substrates. In addition we demonstrated that PTP1B over-expression negatively affects the EGF induced association between Gab1 and SHP2 proteins leading to a decrease of MAP kinase activation. We also provide evidence of a physical association between Gab1, PTP1B and the docking protein Grb2 to form a ternary complex.
Introduction
Phosphotyrosine network
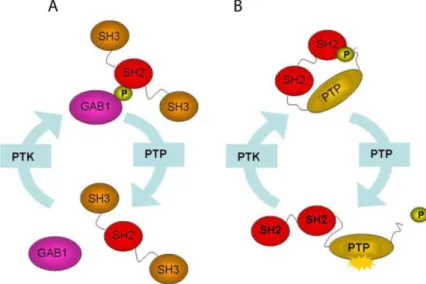
Over the past two decades it has become clear that tyrosine phosphorylation plays a pivotal role in a variety of important signalling pathways in multicellular organisms including those controlling cell growth and tissue differentiation, inter-cellular communication as well as immune response (Pawson and Scott, 2005). Tyrosine phosphorylation is reversible and dynamic; phosphorylation states are governed by opposing activities of protein tyrosine kinases (PTKs), which catalyse tyrosine phosphorylation, and protein tyrosine phosphatases (PTPs), which are responsible for dephosphorylation. The consequences of this post-translation modification is
Figure 1. An example of regulation via reversible tyrosine phosphorylation. A) Through the phosphorylated tyrosine, the Gab1 adaptor may generate an interacting platform for proteins with SH2 domain as Grb2. The assemblage of this protein complex is a key event for the signal transduction of several growth factors. B) The tyrosine phosphatase SHP2 is regulated by an intramolecular interaction between the N-terminal SH2 domain and the phosphorylated C-terminal tail (close conformation). The dephosphorylation of SHP2 N-terminal SH2 domain may promote the activation of the catalytic domain (open conformation).
described in Figure 1. The phosphorylation event can act as a molecular switch to activate or deactivate a protein. In addition, the phosphorylated tyrosine can mediate the formation of multi-protein signal complexes as a result of the action of phosphotyrosine recognition domains such as the SH2 or the PTB module. Perturbations of the tyrosine phosphorylation cycle at any level may cause human diseases such as autoimmunity, diabetes and cancer. The importance of phosphorylation and the regulatory role of PTKs is established; however, it has recently become apparent that PTPs can no longer be viewed as passive housekeeping enzymes in these processes (Tonks, 2006).
The PTP family
Since the completion of the sequence of the human genome, it has become possible to catalogue the genes encoding members of the PTP superfamily. The sequencing of the human genome has helped identify 107 PTP-coding genes but only 85 are cataliytically active. Similarly, of the 90 genes coding for the protein tyrosine kinases (PTK) only 85 are catalytically active (Motiwala and Jacob, 2006). However, the number of genes only illustrates the minimal level of complexity in the family, as additional diversity is introduced through the use of alternative promoters, alternative mRNA splicing and post-translational modifications. Both group of enzymes are equally important in maintaining optimal protein phosphorylation level and are distributed almost equally in tissues. The PTPs superfamily can be further classified into three major families based on their structure, function and sequence: the classical, phosphotyrosine (pTyr)-specific phosphatases, the dual specificity phosphatases (DSPs) and low molecular weight phosphatases (Motiwala and Jacob, 2006). This structural diversity is indicative of the functional importance of the PTPs in the control of cell signaling (Tonks, 2006).
Classical pTyr-specific PTPs
In humans, there are 38 classical phosphotyrosine (pTyr)-specific phosphatases (PTP) genes (Ostman et al., 2006). The classical PTPs are broadly divided into receptor-like forms (RPTPs) and non-receptor forms (Figure 2). The RPTPs have the potential to regulate signalling through ligand-controlled protein tyrosine dephosphorylation. Of the 21 RPTPs, 12 possess a tandem arrangement of PTP domains in their intracellular segment.
With the exception of PTP 11, the membrane-distal (named D2) domain is inactive. In many cases, the extracellular domains include immunoglobulin-like domains and fibronectin type III domains, similar to the extracellular domains of cellular adhesion molecules (Ostman et al., 2006). The non-transmembrane PTPs often contain regulatory region that flank the catalytic domain and control the activity of the enzyme regulating the subcellular location or the substrate specificity. The catalytic PTP domain spans approximately 280 amino-acids and contains a highly conserved active site with a cysteine residue that is required for catalytic activity (Ostman et al., 2006; Tonks, 2006). The prototypic member of the classical PTPs is the enzyme PTP1B.
Figura 2. The classical protein tyrosine phosphatases (PTPs) can be classified as receptor-like or non-transmembrane proteins. (Adapted from Tonks, 2006 Nat Rev Mol Cell Biology).
The PTP1B structure and regulation
PTP1B was initially purified as a catalytic domain of 37 kDa, but the isolation of cDNA-encoding PTP1B revealed a full-length form of the protein that also contains an extension of 114 residues at the C-terminal side of the catalytic domain (Brown-Shimer et al., 1990; Chernoff et al., 1990). In fact PTP1B consists of an N-terminal catalytic domain, a C-terminal hydrophic stretch, and an intervening region containing two proline-rich motifs. Like all PTPs, the catalytic domain of PTP1B contains a critical cysteine residue within its active site that mediates nucleophilic attack on substrate phosphotyrosine residues. The C-terminal 35 residues are predominantly hydrophobic in nature and function in targeting the enzyme to the cytoplasmic face of membranes of the endoplasmic reticulum (ER) (Frangioni et al., 1992). The targeting of PTPs to define subcellular locations contributes to the regulation of their function by restricting the spectrum of substrates to which they can gain access. The C-terminal segment of PTP1B not only controls activity indirectly by regulating subcellular location, but may also exert a direct effect on catalysis. PTP1B is sensitive to proteolytic cleavage by calpain, for example following engagement of the gpIIb-IIIa integrin on the surface of platelets, which generates a truncated, soluble 42 kDa form of the enzyme (Frangioni et al., 1993). Generation of this truncated form of PTP1B, which lacks 75 residues from the C-terminal segment of the protein, including the ER-targeting motif, is associated with enhanced PTP activity, suggesting a role for the C-terminal segment in suppressing catalytic function. The PTP1B proline rich motifs serve as binding sites for proteins including p130Cas, Grb2 and Crk. Interestingly, PTP1B was one of the first PTPs shown to exist as a phosphoprotein in vivo. Several Ser/Thr phosphorylation sites were identified in the regulatory C-terminal segment, including phosphorylation of Ser 378 by PKC (protein kinase C) and two sites, Ser 352 and 386, whose phosphorylation was regulated in a cell cycle-dependent manner (Flint et al., 1993). Although changes in activity were associated with changes in phosphorylation, the precise mechanism by which PTP1B function may be regulated by phosphorylation is unclear. It has been shown that the Akt-mediated serine phosphorylation within the catalytic domain of PTP1B decreases its ability to dephosphorylate the insulin receptor (IR) in overexpressing cells (Ravichandran et al., 2001). In mice injected with insulin, PTP1B becomes tyrosine phosphorylated, and this corresponds with a decrease in activity (Tao et al., 2001). There have even been reports of phosphorylation of
tyrosyl residues in PTPs, including PTP1B (Dadke et al., 2001; Tao et al., 2001). For example insulin hormone stimulates phosphorylation of PTP1B by the IR in three sites (Tyr66, Tyr152, Tyr153). Phosphorylation of PTP1B at these three sites increases its phosphatase activity creating a negative feedback loop to downregulate insulin signalling. On the other hand, in vivo insulin stimulation of skeletal muscle and adipose tissue also resulted in PTP1B tyrosine phosphorylation. In this letter case, PTP1B tyrosine phosphorylation seemed to decrease the enzyme activity. Overall, the functional significance of these modifications largely remains to be established. PTP1B can also be modified by the small ubiquitin-like modifier SUMO, which decreases its activity (Dadke et al., 2007). In cells over-expressing PTP1B, SUMO ligation was demonstrated to occur transiently following insulin stimulation. It is also well established that PTP1B, as well as other member of PTPs, is negatively regulated through reversible oxidation of the catalytic-site cysteine. Stimulation of various cells with growth factors as epidermal growth factor (EGF) results in a transient increase in the intracellular concentration of H2O2. The sulfur atom of the
Cys residue at the active site of members of the PTP family is normally present as a thiolate ion, which promotes its nucleophilic function but renders it sensitive to oxidation. Upon encountering ROS, this Cys residue is oxidized to sulfenic acid and then rapidly converted to a cyclic sulfenamide. This results in inhibition of PTP activity, thereby fine tuning the tyrosine phosphorylation response. However, oxidation of the PTPs is transient. Restoration of PTP activity after reduction back to the thiolate form of the active site Cys terminates the tyrosine phosphorylation-dependent signal (Figure 3).
The PTP1B catalytic mechanism
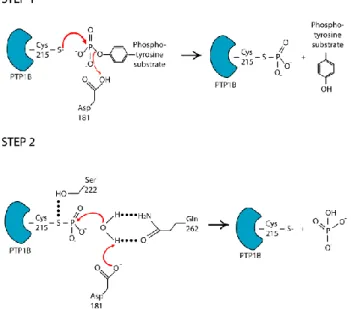
A variety of structural studies, coupled with extensive enzymatic and kinetic analyses from several laboratories, have provided important insights into the mechanism of substrate recognition and catalysis (Denu and Dixon, 1998). PTP-mediated catalysis proceeds via a two-step mechanism (Figure 4). All members of the PTP family are characterized by the presence of a signature motif, [I/V]HCXXGXXR[S/T], which contains the cysteinyl residue (Cys 215 in PTP1B) that is essential for catalysis. In the first step, there is nucleophilic attack by the sulfur atom of the thiolate side chain of the Cys on the substrate phosphate, coupled with protonation of the tyrosyl-leaving group of the substrate by the side chain of a conserved acidic residue (Asp
181 in PTP1B) acting as a general acid.
.
Figura 3: A general model for the regulation of PTP1B activity by reversible oxidation
This leads to formation of a cysteinyl-phosphate catalytic intermediate. In the second step, mediated by Gln 262, which coordinates a water molecule, and Asp 181, which functions as a general base, there is hydrolysis of the catalytic intermediate and release of the phosphate (Tonks, 2006).
The generation of ‘substrate trapping’ mutant to identify PTP1B substrates
Substrates identification is a crucial step in delineating the signalling pathways regulated by PTP1B (Bourdeau et al., 2005). However, progress in this area to date has been limited, due to the transient nature of the interaction between wild type phosphatases and their substrates. To overcome this problem, a mutant form of phosphatase was developed that maintains the wild-type substrate specificity while reducing the catalytic activity. In other words these mutants, dubbed “trapping mutants”, allow to change an enzymatic assay into a binding assay (Blanchetot et al., 2005). The PTPs residue that is mutated to generate the substrate-trapping mutant is the invariant catalytic acid (Asp 181 in PTP1B) that is conserved in all members of the PTP family. This stratagem has offered us a unique approach to identification of physiological substrates of PTPs in general (Figure 5). These mutants represent a practical tool since they allow conversion of a relatively laborious enzymatic assay into a convenient binding assay that has a high-throughput potential. In fact, substrate-trappig mutants have been used to characterize or confirm physiological substrates and consequently the signaling pathway in which a PTP is involved. Thanks to the substrate-trapping mutant approach multiple PTP1B substrates have now been identified (Figure 6) and it has been possible to delineate signalling pathways regulated by the phosphatase.
Figura 5. Mutation to Ala of the residue that functions as a general acid in the first step of catalysis, Asp 181 in PTP1B, creates a catalytically impaired (toothless) mutant PTP, which maintains a high affinity for substrate but does not catalyze dephosphorylation effectively. Following expression, the mutant PTP binds to its physiological substrates in the cell, protecting them from dephosphorylation by the endogenous wild-type PTP. The complex can be isolated and the substrates identified. Since the general acid is conserved in all members of the PTP family, the strategy may be applicable to all PTPs. (Adapted from Tonks, 2003, FEBS Letter).
Figura 6. The figure shows the number of PTP1B partners known from 1992 to 2008. This list included both enzymatic and physical interactions between PTP1B and other proteins of the human proteome.
The PTP1B substrates
PTP1B substrates are involved in multiple cellular processes such as glucose uptake, proliferation, differentiation, apoptosis, cell–cell adhesion, extracellular matrix attachment, motility and invasion (Stuible et al., 2008). They include RTKs, intracellular PTKs, adapter proteins, cytoskeletal proteins, and transcription factors (Lessard et al., 2009). PTP1B-catalyzed phosphotyrosine removal may, in a substrate-dependent context, either inactivate or activate its substrate activities and correspondingly modulate their downstream signaling. For instance, PTP1B-mediated dephosphorylation of the IR down-regulates insulin receptor signaling and contributes to insulin resistance (Elchebly et al., 1999; Seely et al., 1996). In other circumstances, however, PTP1B can have opposite effects. This can occur directly through the removal of an inhibitory phosphotyrosine residue on a particular substrate (e.g.: c-src (Bjorge et al., 2000)), or indirectly via the inactivation of a substrate acting as an inhibitory protein (e.g.: p62Dok (Dube et al., 2004). In both cases, the net result is the increased activation of downstream signaling cascades. In a recent study, Mertins et al. combined the traditional substrate-trapping approach with quantitative mass spectrometry (MS) and identified five new direct substrates of PTP1B under basal, EGF-, or PDGF-induced conditions (Mertins et al., 2008). These include the cell adhesion mediators p120ctn and ZO-1, the regulator of cell motility LPP, as well as the phosphoinositide signaling enzymes PLC-γ1 and SHP2. Quantitative MS also recognized three additional well-described PTP1B substrates, namely EGFR, PDGFR, and p62Dok, thereby confirming the reliability of the technique. Altogether, the use of high-throughput technologies such as quantitative proteomics will accelerate the discovery of new candidate PTP1B substrates and potentially help to unravel new PTP1B functions.
Metabolic function of PTP1B
PTP1B is well established as a critical modulator of metabolic signaling in mammals. PTP1B null mice display enhanced sensitivity to insulin (Elchebly et al., 1999; Mok et al., 2002). This correlates with enhanced tyrosine phosphorylation of the IR in muscle, liver and brain. The first evidence that PTP1B had a physiological role in the regulation of IR tyrosine phosphorylation was obtained by microinjection of PTP1B into Xenopous oocytes, where tyrosine phosphorylarion of IR was markedly
decreased (Cicirelli et al., 1990). Overexpression studies using PTP1B have shown that upon insulin stimulation, expression of the WT enzyme decreases IR phosphorylation and glucose incorporation into glycogen (Kenner et al., 1996). In addition, transient overexpression of PTP1B WT in primary culture of rat adipose cells reduced glucose uptake and GLUT4 translocation to the cell surface (Chen et al., 1997). A direct association between IR and PTP1B was identified using substrate trapping method (Seely et al., 1996). PTP1B is also involved in leptin signaling and several in vitro experiments demonstrated that PTP1B is a negative regulator of the leptin signaling pathway. Leptin signaling is mediated by stimulation of the JAK/STAT signal transduction cascade. JAKs (Janus kinases) are cytosolic tyrosine kinases which phosphorylate the STAT (signal transducer and activator of transcription) proteins. More recently, tissue-specific knockouts of PTP1B confirmed the role of the enzyme in metabolic syndrome and ER-stress in liver (Cheng et al., 2002), in glucose homeostasis in muscle (Delibegovic et al., 2007)), as well as body weight, adiposity and leptin action in neurons (Bence et al., 2006). These remarkable data highlight the potential of PTP1B inhibitors in the treatment of diabetes, obesity, and metabolic syndrome. Following the landmark studies describing the metabolic phenotype of knockout mice, published in 1999, there was a surge of interest in PTP1B-targeted therapeutics among academic and industrial laboratories.
The role of PTP1B in cancer
The dephosphorylation of substrates by PTP1B suggests that overexpression of the phosphatase should protect against transformation induced by constitutively active PTKs. Consistent with its role as an inhibitor of receptor tyrosine kinases, over-expression of PTP1B in fibroblast inhibits the transformation induced by oncogenes including v-Src (Woodford-Thomas et al., 1992), Bcr-Abl (LaMontagne et al., 1998) and Neu NT (Brown-Shimer et al., 1992). The above results, coupled with effects of PTP1B on the insulin receptor, supported the notion that the main role of PTP1B is to act as a brake to proliferative and metabolic signals. However, more recent data indicate that this simple model is somewhat limited. In fibroblast, PTP1B is required for the activation of the small GTPase Ras, an enzyme that is generally associated with increased cell proliferation and motility (Dube et al., 2004). In a study of 29 human breast cancer samples, 72% displayed PTP1B expression greater then the maximum observed in nine samples of normal mammary epithelium. Importantly, this study also linked the expression of PTP1B to that of ErbB2,
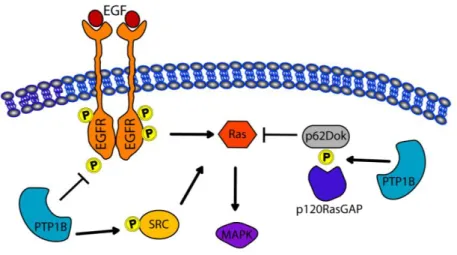
finding that 11 of 12 tumors (>90%) that express ErbB2 also over-express PTP1B (Wiener et al., 1994). In a significant fraction of human clinical samples of ErbB2-positive breast cancer, amplification of the chromosome 20q13 (containing the PTP1B gene) has been noted, with increased expression of PTP1B. Consistent with a positive signalling function, PTP1B has been identified as the major tyrosine phosphatase able to increase the specific activity of endogenous Src kinase by reducing phosphorylation at Y527 both in colon (ten Hoeve et al., 2002) and in breast cancer (Arias-Romero et al., 2009; Bjorge et al., 2000). However, tissue samples from ErbB2/PTP1B-/- mice gave inconsistent results regarding the phosphorylation and the activity of Src kinase. This contradicts the current paradigm that activation of Src kinase is essential for erbB2-induced oncogenesis (Julien et al., 2007). Julien et co-workers suggests that PTP1B can up-regulate the growth promoting pathway by deactivating p62DOK, an adaptor protein previously described as a substrate of PTP1B, which down-regulates Ras/MAP kinase signalling through its association with the Ras GTPase-activating protein p120RasGAP (Dube et al., 2004). However, changes in p120RasGAP were not observed in the study by Neel's group (Bentires-Alj and Neel, 2007). In Figure 7 is graphically showed the PTP1B targets that have a positive (indicated by an arrow) or a negative effect on Ras/Map Kinase pathway.
Figura 7: PTP1B can dephosphorylate EGF receptor attenuating MAP Kinase signaling downstream of EGFR. On the other hand the dephosphorylation of p62Dok and Src proteins by PTP1B enhances the RAS MAP Kinase pathway.
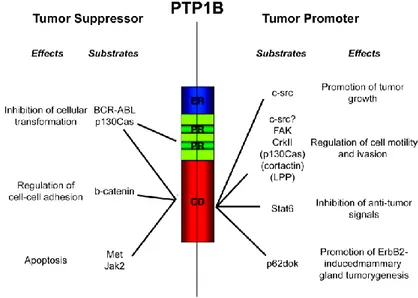
An outstanding issue is the mechanism by which cellular transformation alters PTP1B expression. Two general hypothesis have been proposed to explain the function of PTP over-expression in cancer: first, tumor cells may up-regulate PTP1B to balance dysregulated kinase activity, and not doing so would promote tumorigenesis. Alternatively, PTP1B might actively promote the oncogenic and metastatic process, in which case decreasing its expression would have the opposite effect (Stuible et al., 2008). In the case of PTP1B and ErbB2-induced breast cancer, recent results support the second hypothesis (Bentires-Alj and Neel, 2007; Julien et al., 2007). Given that loss of PTP1B function attenuates carcinogenesis in mouse models of breast cancer and in mammalian cells, it is plausible that PTP1B inhibitors might prove useful in the therapy of certain cancers (Arias-Romero et al., 2009; Tonks and Muthuswamy, 2007). Despite the increasing number of reports implicating PTP1B in cancer, we are far from understanding its exact role in tumorigenesis and one of the major issues is to reconcile, at a system level, the reported tumor suppressor and tumor promoter roles of this phosphatases (Figure 8).
Figura 8. Schematic representation of the two faces of PTP1B in cancer. Given its function in different cellular processes, PTP1B may act either as a tumor suppressor or a tumor promoter through the dephosphorylation of specific substrates. ER: C-terminal hydrophobic tail anchored in the endoplasmic reticulum. PR: Proline-rich motif. CD: Catalytic domain. (Adapted from Tremblay, 2009 Biochimica et Biophysica Acta).
TC-PTP: The closest homologue to PTP1B
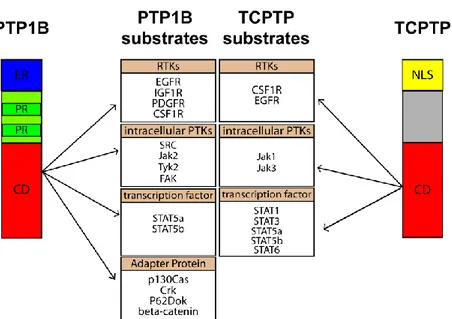
The ubiquitously expressed T cell PTP (TC-PTP) is the enzyme most similar to PTP1B. TC-PTP and PTP1B share over 70% amino acid sequence identity within their catalytic domains. However, while PTP1B is predominantly endoplasmic reticulum (ER)-localized, TC-PTP is largely nuclear. Human TC-PTP is described as an intracellular protein comprising 418 aa residues. A splicing event can generate two distinct mRNAs, termed TC-PTPa and TC-PTPb, with predicted protein sizes of 45 kDa (mouse and human) and 48.5 kDa (human), respectively (Bourdeau et al., 2005). In overexpression studies, the 45-kDa form localizes to the nucleus whereas the 48.5 kDa TC-PTP is attached to the ER (Bourdeau et al., 2005). The 45-kDa form can also translocate to the cytoplasm upon mitogenic stimulation (Tiganis et al., 1998). TC-PTP null mice are born normal but die between 3 and 5 weeks from a variety of consequences, including defects in hematopoiesis and immune function (You-Ten et al., 1997). Accordingly, members of the Janus Kinase family, JAK1 and JAK3 (Simoncic et al., 2002), as well as the signal transducer and activator of transcription family members STAT1 (ten Hoeve et al., 2002) ,STAT3 (Yamamoto et al., 2002), and STAT5a/5b (Aoki and Matsuda, 2002), have been identified as substrates of TC-PTP (Bourdeau et al., 2005). The JAK/STAT pathway is widely used by the cytokine receptor superfamily to link receptor stimulation to gene transcription. In fact the propagation of signals downstream of cytokine receptors involves STAT phosphorylation by the JAKs (Aaronson and Horvath, 2002) and it is also crucial for hematopoietic development. Together, this indicates that TC-PTP functions as a major negative regulator of cytokine signaling. Although TC-PTP and PTP1B show high identity in their catalytic domains (Iversen et al., 2002), their localization, substrates, as well as mouse knockout phenotypes are remarkably different (Figure 9). TC-PTP and TC-PTP1B are involved in the regulation of cell proliferation via several pathways including growth factor receptors. In vitro and in vivo studies have shown that both PTP1B and TC-PTP are able to dephosphorylate EGFR. In Cos-1 cells, after EGF induction, TC-PTP traslocates from the nucleus to cytoplasm and dephosphorylates the EGFR, leading to decreased activation of phosphatidylinositol 3-kinase (PI3K) and Akt (Tiganis et al., 1999). TC-PTP has also been shown to suppress transformation of Rat2 cells by the v-fms oncogene. Overall TC-PTP seems to act as a tumor suppressor gene.
Epidermal Growth Factor Receptor (EGFR) Signaling
Signaling through the epidermal growth factor receptor (EGFR) is crucial for many cellular processes including growth, cell-cycle progression, differentiation and apoptosis (Hunter, 2000; Schlessinger, 2004). Ligand stimulation of the EGFR and the three other members of EGFR family of receptor tyrosine kinases (ErbB2, ErbB3, ErbB4) causes dimerization of EGFR monomers and activates their intrinsic tyrosine kinase activity. Receptor activation leads to phosphorylation of specific tyrosine residues within the cytoplasmic tale of EGFR. These phosphorylated residues serve as docking sites for proteins containing Src homology 2 (SH2) and phosphotyrosine binding (PTB) domains, the recruitment of which leads to
Figura 9. Schematic representation of the structures of PTP1B and TC-PTP and their respective substrates linked to cancer. ER: C-terminal hydrophobic tail anchored in the Endoplasmic Reticulum, PR: Proline-rich region; CD: Catalytic Domain, NLS: Nuclear Localization Sequence.
activation of intracellular signaling pathways. EGFR-mediated phosphorylation and activation of multiple binding partners initiates signal propagation through a number of interacting branches including the mitogen-activated protein kinase (MAPK) cascade and the phosphatidylinositol 3-kinase (PI3K)/Akt survival pathway (Kiyatkin et al., 2006).
Phosphatidylinositol 3 kinase/Akt pathway. The phosphatidylinositol 3 Kinase (PI3K) pathway is involved in the regulation of cell growth, differentiation, migration and apoptosis. PI3K is a dimeric enzyme constituted by a regulatory subunit (p85) and a catalytic subunit (p110). The regulatory p85 subunit consists of several domains including the SH3 domain, two proline rich fragments, and two SH2 domains separated by the iSH2 (inter SH2) sequence. The iSH2 domain provides the interaction between the p85 and p110 subunits, and the two SH2 domains are responsible for binding of the p85/p110 heterodimer with receptor tyrosine kinases (Krasilnikov, 2000). The p85 subunit can interact with EGFR through the docking protein Gab1. The catalytic p110 subunit of PI3K possesses both serine-threonine protein kinase and phosphoinositide kinase activities. The catalytic subunits generates the second messenger phosphatidylinositol 3,4,5-triphosphate, that is responsible for phosphorylation and activation of the protein serin/threonin kinase Akt.
Pathway induced by PLC-. PLC- associates with activated EGFR with the SH2 domains and it is subsequently phosphorylated at tyrosineresidues. PLC- phosphorylated and activated provokes the hydrolysis of PIP2 to
produce two second messengermolecules: inositol 1,4,5-trisphosphate (IP3),
which increases intracellular levels of free Ca2+, and diacylglycerol, an endogenous activator of protein kinases.
Ras/Raf/MAP Kinase Pathway. The adaptor proteins Grb2 (growth factor receptor-binding protein 2) and Shc (Src homology 2 (SH2) and collagen domain protein) play key roles in signaling downstream of EGFR. Grb2 associates with activated EGFR either directly or through tyrosyl-phosphorylated Shc (Schlessinger, 2000). This association is mediated by the SH2 domain of Grb2 that binds to specific phosphotyrosine residues on EGFR or Shc. Grb2, through its N-terminal SH3 domain, associates with the cytoplasmic guanine nucleotide exchange factor (GEF) SOS (homolog of the Drosophila melanogaster Son of sevenless) (Cheng et al., 1998). This interaction leads to a conformational modification of SOS, now able to catalyzes the transformation of an inactive GDP-bound form (Ras-GDP) of
the small membrane-anchored GTPase Ras into its active GTP-bound form (Ras-GTP). Ras-GTP activates Raf-1 that phosphorylates the mitogen-activated protein kinase (MAPK) extracellular signal-regulated kinases 1 and 2. Activated MAPK traslocates into the nucleus where transcription factor involved in cell proliferation are activated. EGF-induced membrane recruitment of the SOS Grb2 complex can be mediated not only by EGFR but also by the Grb2-associated binder (Gab) adaptor proteins (Saxton et al., 2001; Schlessinger, 2000).
Role for Gab1 and SHP2 in Epidermal Growth Factor-induced Ras Activation
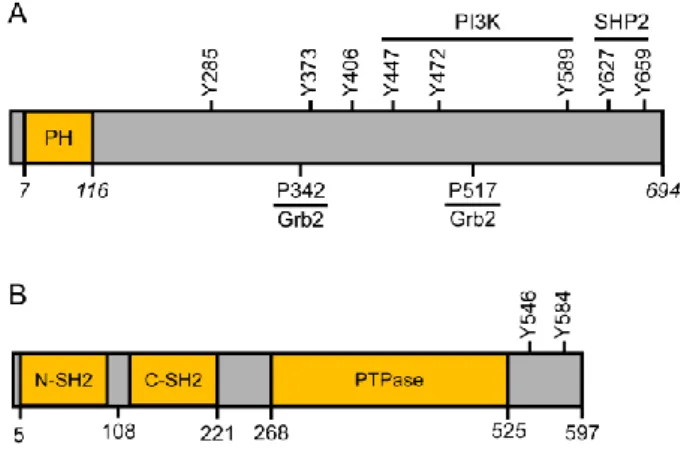
SHP2 is a PTPase with two Src homology-2 (SH2) domains (N-SH2 and C-SH2) located in the N-terminal region and two potential Grb2 SH2 domain binding sites located in the C-terminal region (Figure 10B) (Tonks and Neel, 2001). SHP2 is basally inactive due to auto-inhibition by its N-SH2 domain. It can be activated by binding to tyrosine-based activation motifs or by deletion of the N-SH2 domain (Hof et al., 1998). A major SHP2-binding protein in growth factor-stimulated cells is Gab1 (Holgado-Madruga et al., 1996). Gab1 is a multisite docking protein that contains an N-terminal pleckstrin homology (PH) domain, multiple tyrosine phosphorylation sites, and two Grb2 SH3 domain binding sites (Figure 10A).
Figura 10. Schematic representation of the structures Gab1 (A) and SHP2 (B)
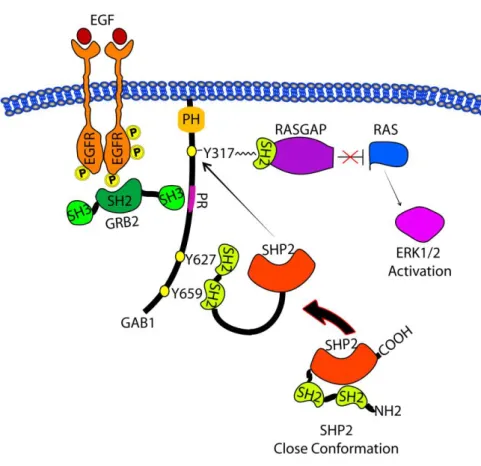
Gab1, as well as SHP2, becomes tyrosine-phosphorylated in cells stimulated with EGF and other growth factors. Gab1 contains the N-terminal pleckstrin homology (PH) domain that mediates membrane targeting, several proline-rich motifs serving as binding sites for SH3 domain containing proteins, such as Grb2 and the soluble tyrosine kinase Src, and multiple tyrosine phosphorylation sites that recruit a variety of effectors, including the SH2 domains of p85, RasGAP, and SHP2 (Schaeper et al., 2000). Gab1-mediated recruitment of p85 leads to PI3K activation and the production of phosphatidylinositol (3,4,5)-trisphosphate (PIP3) in the plasma membrane. This Gab1-PI3K interaction generates positive feedback in PI3K stimulation: the PH domain of Gab1 binds PIP3, and this leads to a further recruitment of Gab1 to the membrane, which further activates PI3K (Rodrigues et al., 2000). In addition, the plasma membrane recruitment of Gab1 influences the Ras/MAPK pathway in multiple ways. Gab1 can bind the Grb2-SOS complex, which activates Ras, and tyrosyl-phosphorylated Gab1 can bind RasGAP, which negatively regulates Ras. The protein phosphatase SHP2, which binds to Gab1, was reported to be a positive regulator of the MAPK pathway (Gu and Neel, 2003; Schaeper et al., 2000). In particular Tyr-627 and Tyr-659 of Gab1 constitute a bisphosphoryl tyrosine-based activation motif that mediates binding and activation of SHP2 in EGF-stimulated cells (Cunnick et al., 2002). This positive effect is related to the formation of the Gab1 SHP2 complexes and subsequent dephosphorylation of the docking sites on Gab1 involved in RasGAP binding (Montagner et al., 2005), which results in an elevation of active Ras-GTP and activation of ERK1 and ERK2 proteins as illustrated in figure 11.
Figura 11. Mecanism by which Gab1-SHP2 complex promotes RAS- MAP Kinase pathway.
Aim of the work
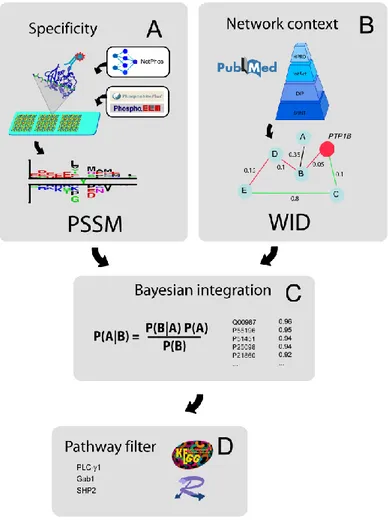
An essential step in the elucidation of the physiological functions as well as the signalling pathways modulated by PTP1B is the identification of its substrates. The substrate recognition specificity of PTP1B was investigated in the laboratory where I performed the PhD work by a novel technology that permits to identify in vivo phosphatase substrates by combining orthogonal information in a statistically meaningful framework. This general strategy, outlined in Figure 12, offered the starting point for my project. Among the proteins predicted to be PTP1B enzymatic targets, we focused on those known to be involved in both EGFR and insulin signaling pathways. In particular, we decided to investigate the two predicted targets with the highest score, Gab1 and PLC-, while SHP-2 was further studied because of a specific interest of our group in this protein. In order to validate the general strategy described in Figure 12, the main goal of my project was to demonstrate the PTP1B enzymatic role on PLC-, Gab1 and SHP2 proteins. Moreover, to better understand the role of PTP1B in the Ras/MAP Kinase pathway, I investigated the functional effect of the PTP1B activity on Gab1 protein.
Figura 12. Schematic illustration of the strategy used to discover potential PTP1B substrates. (A) High density peptide chip technology is used to identify the phosphopeptides that have the capacity of binding the trapping mutant catalytic domain of PTP1B. The results were used to create a Position Specific Scoring Matrix (PSSM) to rank the human tyrosine phosphorylated proteins according to the likelihood of being PTP1B substrates in vitro. (B) A second feature is WID, Whole Interactome Distance. We first compiled a weighted human interactome by combining the interactions imported from four major protein-protein interaction databases: DIP, HPRD, IntAct and MINT. For each protein in the human interactome we next calculated WID, a weighted graph distance from PTP1B. C) Since the two features that we considered are largely independent we integrated them by a naïve Bayesian approach. D) The Bayesian framework ranked each phosphorylated human proteins with a score reflecting the probability of being a physiological target of PTP1B. Finally we used a pathway filter to retain only the substrates that had already been described as playing a role in the EGF and insulin pathways.
Results
GST pull-down assays identify PLC-, Gab1 and SHP2 as specific substrates of PTP1B
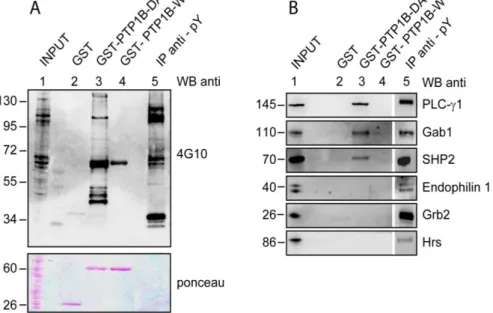
For a limited number of putative PTP1B partners annotated in the EGF pathway and also involved in insulin signaling, we assessed the ability to bind the PTP1B-D181A trapping mutant in pull down assays from extracts of HEK 293 cells stimulated with EGF. We tested four proteins that are predicted to contain a PTP1B substrate peptide (PLC-, Gab1, SHP2 and HRS) and two (Grb2 and Endophilin-1) that do not contain any substrate peptide. As shown in Figure 10A, while hardly any phosphorylated protein could be affinity purified with GST alone or with the wild type catalytic domain of PTP1B, numerous bands were detected in the trapping mutant lane. By probing the proteins that were affinity-purified with the PTP1B-GST fusions with antibodies specific for PLC-, Gab1 and SHP2, we confirmed that these proteins specifically bind PTP1B-D181A (Figure 13B, lane 3). HRS, on the other hand, could not be detected among the proteins affinity purified by PTP1B-D181A. Grb2 and Endophilin-1, which do not contain PTP1B substrate phospho-tyrosine peptides, are also unable to bind the PTP1B trapping mutant.
Over-expression of PTP1B in HEK 293 cells specifically decreases tyrosine phosphorylation of the inferred substrates upon insulin stimulation
To determine whether the PLC-, Gab1 and SHP2 tyrosine phosphorylation levels were altered by PTP1B expression, we ectopically expressed in HEK 293 cells the full-length phosphatase, genetically tagged with an amino-terminal FLAG epitope, and we monitored the phosphorylation levels of the inferred targets upon insulin stimulation. The PTP1B overexpression was controlled with a specific antibody against the phosphatase (Figure 14A). Since the PTP1B overexpression doesn‟t lead to a general dephosphorylation of the protein extract as shown in the blot revealed with the antiphosphotyrosine antibody, we can conclude that the enzymatic activity of the phosphatase is specific. The lysates were also revealed with antibodies against PLC- (WB: anti-PLC-), Gab1 (WB:
anti-Gab1), SHP2 (WB: anti-SHP2), Grb2 (WB: anti-Grb2) and tubulin (WB: anti-tubulin) to detect protein levels in the cell extract (figure 14B).
Figura 13. Bacterially expressed wild type PTP1B catalytic domain (GST-PTP1B WT), PTP1B trapping mutant domain (GST-PTP1B DA) or GST were mixed with 1 mg of lysates from HEK 293 cells previously starved and induced for 5 min with EGF. A) The proteins affinity purified by the corresponding GST fusion bait were washed with lysis buffer, separated on SDS-PAGE, transferred onto nitrocellulose membranes and probed with anti-phosphotyrosine antibody (4G10). Lane 1 contains the total cell lysates while in the following three lanes are the proteins co-purifying respectively with the GST (negative control), the catalytically inactive trapping mutant of PTP1B and wild type PTP1B. Lane 5 represents the immunoprecipitation with the anti-phosphotyrosine antibody 4G10. The membrane in the lower panel was detected with ponceau solution to demonstrate that we loaded the same amount of GST fusion proteins (60 kDa) and GST alone (26 kDa). B) Total cell lysates (15 g), the proteins affinity-purified by the indicated GST fusions and the phosphoproteins immuno-precipitated by 4G10 were resolved by SDS PAGE and immunoblotted (WB) with antibodies against PLC, Gab1, SHP2, Endophilin 1, HRS and Grb2 to verify the presence of the specific proteins.
Aliquots of the cell lysates, transfected with a vector directing the expression of PTP1B or with a control empty vector, were immuno-precipitated with antibodies recognizing PLC-, Gab1 and SHP2, after separation by gel electrophoresis, the levels of tyrosine phosphorylation were revealed with the anti-4G10 antibody (Figure 15). The same blots were incubated with antibodies against the three proteins to document the successful immunoprecipitation. The diagrams in Figure 15 report the ratio of the phosphorylated and unphosphorylated forms for each protein analyzed, as a function of time, upon insulin induction. In this experimental set up we have not been able to detect any signal with the 4G10 anti-phospho-tyrosine antibody when cell extracts are immuno-precipitated with an anti SHP2 antibody. In the absence of phosphatase overexpression, PLC- and Gab1 phosphorylations peak at 5 minutes after addition of insulin and markedly decline after 20 minutes. Upon PTP1B over-expression the phosphorylation of both inferred targets sharply decreases when compared to controls (Figure 15).
Figura 14. HEK 293 cells were transiently transfected with FLAG-tagged PTP1B (lanes 4, 5, 6) and FLAG vector as negative control (lanes 1, 2, 3). After serum starvation for 18 hours, cells were stimulated with 100 ng/ml of insulin for 5 (lanes 2, 5) and 20 minutes (lanes 3, 6). As control we used unstimulated cells (lanes 1, 4). A) Total extracts were revealed with anti-4G10 antibody to monitor tyrosine phosphorylation after insulin induction (WB: anti-anti-4G10) and with PTP1B specific antibody (WB: anti-PTP1B) to confirm phosphatase over-expression in lanes 4, 5 and 6. The over-expression of the phosphatase (lanes 4, 5 and 6) does not lead to a non specific dephosphorylation of the protein extract (Figure 11A, WB anti-4G10). B)MThe lysates were also revealed with antibodies against PLC-1 (WB: anti-PLC), Gab1 (WB: anti-Gab1), SHP2 (WB: anti-SHP2), Grb2 (WB: anti-Grb2) and tubulin (WB: anti-tubulin) to detect protein levels in the cell extract.
Likewise, if we first affinity purify the phosphorylated proteins with an anti-phosphotyrosine antibody and we then monitor, by western blot, the levels of the inferred targets (Figure 16), we observe a consistent drop in the phosphorylation of the substrates of PTP1B upon its over-expression. In these conditions we were also able to prove that SHP2 phosphorylation level is decreased. The observed reduction in the phosphorylation levels is specific for the inferred PTP1B targets since in spite of PTP1B over-expression, the cell phosphorylation profile does not change appreciably (Figure 14A) and, in addition, a protein, which received a low score in our predictive
Figura 15. HEK 293 cells were transiently transfected with FLAG-tagged PTP1B (lanes 4, 5, 6) and FLAG vector as negative control (lanes 1, 2, 3). After serum starvation for 18 hours, cells were stimulated with 100 ng/ml of insulin for 5 (lanes 2, 5) and 20 minutes (lanes 3, 6). As control we used unstimulated cells (lanes 1, 4).Cell lysates were immuno-precipitated with anti-PLC, Gab1, SHP2 (B) The blots in panels B were incubated with protein-specific (upper panel) or with anti-phosphotyrosine antibodies (WB: 4G10) to monitor the phosphorylation levels of the immuno-precipitated proteins (lower panel). After normalization of the immuno-precipitated proteins, phosphorylation levels were quantified and plotted.
algorithm, such as the adapter Grb2, does not show any phosphorylation reduction contingent on PTP1B expression (Figure 16, WB anti Grb2).
PLC-, Gab1 and SHP2 phosphorylation, induced by Src kinase, is reduced in condition of PTP1B over-expression.
PTP1B has been reported to negatively regulate the activity of the Insulin Receptor (INSR) (Romsicki et al., 2004) as well as that of other RTKs such as the Epidermal (EGFR) and the Platelet Derived Growth Factor Receptors (PDGFR) (Haj et al., 2003) by removal of phosphate groups, thus functioning as a negative modulator of hormone signaling. Thus the observed decrease in the phosphorylation of PLC-, Gab1 and SHP2 upon PTP1B over-expression could be accounted for by an indirect effect
Figura 16. HEK 293 cells were transiently transfected with FLAG-tagged PTP1B (lanes 4, 5, 6) and FLAG vector as negative control (lanes 1, 2, 3). After serum starvation for 18 hours, cells were stimulated with 100 ng/ml of insulin for 5 (lanes 2, 5) and 20 minutes (lanes 3, 6). As control we used unstimulated cells (lanes 1, 4). Cell extracts were immuno-precipitated with anti-4G10 and INPUT (right panel) and IP material (left panel) were revealed with anti-PLC, anti-Gab1, anti-SHP2 and anti Grb2 antibodies.
mediated by the inactivation of the receptor kinase activity. To lend further support to the identification of PLC-, Gab1 and SHP2 as direct PTP1B targets we repeated the experiment described in the previous section in conditions whereby the phosphorylation of the inferred targets was triggered by expression of a constitutively active form of the kinase Src (Y527F) whose activity is not down-regulated by PTP1B. HEK 293 cells expressing the Src kinase were co-transfected with a plasmid directing the synthesis of a FLAG tagged PTP1B or with the empty vector as a control. The results of this experiment (Figure 17 and 18) largely parallel those reported in Figure 15 and 16. We ectopically expressed in HEK 293 cells the full-length phosphatase, genetically tagged with an amino-terminal FLAG epitope and the kinase Src to increase total tyrosine phosphorylation. 1 mg of extract was immuno-precipitated with anti 4G10 antibody and then we monitor, by western blot, the levels of the inferred targets (Figure 17B). When transfected with activated Src, the cell phosphorylation profile observed with the 4G10 antibody dramatically changes but it is only marginally affected by coexpression of PTP1B (Figure 17A). In addition, while Grb2 phosphorylation remains unaffected by PTP1B, PLC-, Gab1 and SHP2 markedly decrease their reactivity with the anti-phosphotyrosine antibody 4G10 when the phosphatase is present (Figure 17B). In Figure 18, 1 mg of total extract was immuno-precipitated to isolate the three proteins of interest and the control GRB2. Then we monitor the phosphorylation profile of these proteins using anti 4G10 antibody. Also in this case the phosphorylation profile of PLC-, Gab1 and SHP2 decrease when the phosphatase is overexpressed if compared when we transfected only Src kinase whereas the phosphorylation profile of GRB2 protein is not affected by the PTP1B over-expression (Figure 18).
Figura 17. HEK 293 cells were transiently transfected with a plasmid expressing Src-Y527F, (lanes 2 and 3) to increase tyrosine phosphorylation and co-transfected either with FLAG-tagged PTP1B (lanes 3) or with a corresponding amount of empty FLAG vector (lanes 1, 2). A) The input extracts were analyzed by SDS-PAGE and probed with antibodies against PLC (WB: anti-PLC), Gab1 (WB: anti-Gab1), SHP2 (WB: anti-SHP2), Grb2 (WB: anti-Grb2), PTP1B (WB: anti-PTP1B), Src (WB: anti-Src) and anti-phosphotyrosine (WB: anti-4G10). B) 1 mg of protein extract was precipitated with anti-phosphotyrosine antibody 4G10 (IP:anti-4G10). The immuno-precipitated proteins were separated on SDS-PAGE, transferred onto nitrocellulose membranes and IP material were probed with antibodies against PLC (WB: anti-PLC), Gab1 (WB: anti-Gab1), SHP2 (WB: anti-SHP2) and Grb2 (WB: anti-Grb2). Grb2 is used as a non-substrate control. The ratio between the intensity of the bands obtained with any specific antibody and with the anti Grb2 antibody is reported as a bar diagram.
Generation of stable cell lines expressing siRNA against PTP1B We generated stable cell lines expressing short hairpin RNAs targeting the phosphatase transcript. From the fourteen clones that were analyzed, we selected clone 11 (Figure 19) showing the lowest PTP1B expression level (i. e., a down regulation of 96% when compared to a control cell line expressing a scrambled siRNA). Clone 11 was used to monitor the tyrosine phosphorylation levels of the predicted targets contingent on partial depletion of PTP1B expression.
Figura 18. HEK 293 cells were transiently transfected with a plasmid expressing Src-Y527F, (lanes 2 and 3) to increase tyrosine phosphorylation and co-transfected either with FLAG-tagged PTP1B (lanes 3) or with a corresponding amount of empty FLAG vector (lanes 1, 2). PLC, Gab1, SHP2 and Grb2 proteins were immuno-precipitated from 1 mg of the cell lysates. The immuno-immuno-precipitated proteins were analyzed by western blot first with anti-4G10 antibody to detect the phosphorylation levels of each protein and then with protein specific antibodies. The ratio of phosphorylated to total protein is reported in a bar diagram.
Depletion of PTP1B affects PLC-, Gab1 and SHP2 tyrosine phosphorylation
HEK 293 stably expressing PTP1B siRNA or a scrambled control were transiently transfected with a plasmid encoding the constitutively active Src Y527F to increase tyrosine phosphorylation profile. It should be noted that the depleted expression of PTP1B does not affect the overall phosphorylation profile as shown in Figure 20A (WB anti 4G10). The
down-Figura 19. HEK 293 cells were stably transfected with a plasmid expressing a short hairpin RNA targeting PTP1B. As a negative control we used a plasmid expressing a short hairpin RNA containing 5 bases that do not target any human gene. We selected 14 PTP1B interference clones and the corresponding protein extracts were immunoblotted with anti-PTP1B (A), and with anti-beta-tubulin (B) antibodies. The bar diagram depicts the decrease in PTP1B expression by arbitrarily setting to 100 the amount of PTP1B in the control lane.
expression of PTP1B protein was confirmed as reported in Figure 20B. A fraction of the cell lysates were used to immuno-precipitate the tyrosine phosphorylated proteins with the anti-phospho-tyrosine antibody 4G10. The samples were separated by gel electrophoresis and revealed with antibodies against PLC- (WB: anti-PLC-), Gab1 (WB: anti-Gab1), SHP2 (WB: anti-SHP2) and Grb2 (WB: anti-Grb2) proteins (Figure 21). After normalization of the signal of the immuno-precipitated proteins with the intensity of the immunoglobulin band (IgG), the phosphorylation level in the different conditions was calculated and plotted as a bar diagram (Figure 21).
Figura 20. HEK 293 stably expressing PTP1B siRNA (lanes 3 and 4) or a scrambled control (lanes 1 and 2) were transiently transfected with a plasmid encoding the constitutively active Src Y527F (lanes 2 and 4) or with the empty vector (lanes 1 and 3). A) Protein extracts were immunoblotted with the 4G10 antibody (WB: anti-4G10), to monitor the phosphotyrosine profile of HEK 293 cells and with an antibody against the Src kinase to verify ectopic expression of the constitutively active mutant (lanes 2 and 4). B) Protein extracts were immunoblotted with an anti-PTP1B antibody (WB: anti-PTP1B), to monitor the endogenous PTP1B expression levels and against tubulin (WB: anti tubulin), as a loading control.
Figura 21. HEK 293 stably expressing PTP1B siRNA (lanes 3 and 4) or a scrambled control (lanes 1 and 2) were transiently transfected with a plasmid encoding the constitutively active Src Y527F (lanes 2 and 4) or with the empty vector (lanes 1 and 3). 1 mg of protein extract was immuno-precipitated with the anti-phosphotyrosine antibody 4G10 (IP: anti-4G10). The input cell extracts and the IP material were immuno-blotted (WB) with antibodies against anti-PLC, anti-Gab1, anti-SHP2 and anti-Grb2. The amount of IgG was used as loading control. The phosphorylation levels of the indicated proteins, in the presence of normal (2) and depleted (4) PTP1B expression were normalized and plotted as a bar diagram.
The reduced expression of PTP1B results in a significant increase in PLC-, SHP2 and Gab1 phosphorylation when compared to the control cell line expressing the scrambled siRNA (Figure 21A, compare lane 4 and lane 2) while, consistently with previous results, Grb2 phosphorylation is not affected by PTP1B down regulation. These results indicate that a decrease of PTP1B expression results in an increase in the phosphorylation of PLC-, Gab1 and SHP2 when the phosphorylation is triggered by an activated Src kinase.
The over-expression experiments showed until now were performed by transient transfection. In this condition PTP1B over-expression is very high. For this reason we decided to use inducible a Flp-In T-REx-293 cell line expressing controlled levels of PTP1B. In this latter case, as shown in Figure 22, PTP1B concentration is only 1,5 times higher than the endogenous level, to be compared with the five fold increase obtained in condition of transient expression.
Figure 22. Flp-In T-REx-293 cell line were either treated with doxycycline for 24 h to induce the expression of PTP1B (lane 2) or were transiently transfected with DNA encoding for PTP1B tagged to FLAG (lane 3). As control we used Flp-In T-REx-293 cell line not transfected and not induced (lane 1).
For this reason we decided to observe the phosphorylation profile of PLC-, Gab1 and SHP2 using Flp-In T-REx-293 cell line expressing controlled levels of PTP1B.
PTP1B controlled over-expression decreases tyrosine phosphorylation of PLC-, Gab1 and SHP2
T-REx-293 cells inducible for PTP1B (Figure 23) were treated with doxycycline for 24 hours to induce phosphatase expression (lane 2). The cells were stimulated with EGF for 5 minutes to increase the protein phosphorylation levels and aliquots of the cell lysates were immuno-precipitated with the 4G10 antibody. As negative control we used T-REx-293 cells stimulated for 5 minutes with EGF in the absence of doxycycline induction. Input and affinity purified phosphorylated proteins were immunoblotted with antibodies against PLC- (WB: anti-PLC-), Gab1 (WB: anti-Gab1), SHP2 (WB: anti-SHP2) and Grb2 (WB: anti-Grb2) (Figure 23). Since the phosphorylation level of Grb2 does not change if either of the two phosphatases is overexpressed, we used the intensity of its signal for normalization of the phosphorylation of the putative substrate proteins. Consistent with the results of the experiments so far, we could confirm by this experimental set up, that PTP1B over-expression, causes a decrease of the phosphorylation of PLC-, Gab1 and SHP2 also when phosphorylation is induced by EGF hormone.
Figura 23. HEK 293 cells stably transfected with FLAG tagged PTP1B and were induced for 24 hours with doxycycline to induce the expression of the phosphatase (lanes 2). Five minutes before cell lysis, cells were stimulated with EGF 100 ng/ml (lanes 1, 2). 1 mg of the protein extract of each sample was immuno-precipitated with 4G10 antibody. The input material (Input) was immunoblotted with antibodies against anti-PLC (WB: anti-PLC), anti-Gab1 (WB: anti-Gab1), anti-SHP2 (WB: anti-SHP2), anti-Grb2 (WB: anti-Grb2), anti-FLAG (WB: anti-FLAG) and anti-beta-tubulin (WB: anti-tubulin). The phosphorylated proteins (IP anti-4G10) were immuno-blotted with antibodies against PLC, Gab1, SHP2 and Grb2. The amount of phospho-Grb2 was used as a non-substrate control. The phosphorylation levels of the indicated proteins, in the presence of normal (1) and induced (2) phosphatase expression were normalized and plotted as a bar diagram.
PTP1B specificity: the related phosphatase TC-PTP does not dephosphorylate PLC-1, Gab1 and SHP2 proteins
To evaluate the specificity, within the PTP phosphatase family, of the PLC-, Gab1 and SHP2 de-phosphorylation by PTP1B, we used inducible Flp-In T-REx-293 cell lines expressing TC-PTP under the control of doxycycline. The relative expression of PTP1B and TC-PTP was monitored by probing both with the same anti-Flag antibody. TC-PTP is expressed twice as much as PTP1B in these conditions as shown in Figure 24.
T-REx-293 cells inducible for TC-PTP (Figure 25) were treated with doxycycline for 24 hours to induce phosphatase expression (lane 2). The cells were stimulated with EGF for 5 minutes to increase the protein phosphorylation levels and aliquots of the cell lysates were immuno-precipitated with the 4G10 antibody. Input and affinity purified phosphorylated proteins were immunoblotted with antibodies against
PLC- (WB: anti-PLC-), Gab1 (WB: anti-Gab1), SHP2 (WB: anti-SHP2) and Grb2 (WB: anti-Grb2) (Figure 25). Also in this case, we used the intensity of Grb2 protein to normalize the phosphorylation level of PLC-, Gab1 and SHP2. In the cell line overexpressing the phosphatase TC-PTP, we observed a significant reduction in the phosphorylation level of Shc (WB anti Shc), a validated target of TC-PTP (Figure 25), while hardly any effect is observed on the proposed PTP1B substrates. These results further confirm the specific role played by PTP1B in the dephosphorylation of its predicted substrates.
Figura 24. HEK 293 cells stably transfected with FLAG tagged PTP1B or FLAG tagged TC-PTP were treated 24 h with doxycycline to induce the expression of the two phosphatases (lanes 3). Different amount of total extract expressing both PTP1B and TC-PTP were loaded as described in the figure and the blot was revealed with anti-FLAG antibody.
Figura 25. HEK 293 cells stably transfected with FLAG tagged TC-PTP were induced for 24 hours with doxycycline to induce the expression of the phosphatases (lanes 2). Five minutes before cell lysis, cells were stimulated with EGF (lanes 1, 2). 1 mg of the protein extract of each sample was immuno-precipitated with 4G10 antibody. The input material (Input) was immunoblotted with antibodies against anti-PLC (WB: anti-PLC), Gab1 (WB: Gab1), SHP2 (WB: anti-SHP2), anti-Grb2 (WB: anti-Grb2), anti-FLAG (WB: anti-FLAG) and anti-beta-tubulin (WB: anti-anti-beta-tubulin). The phosphorylated proteins (IP anti-4G10) were immuno-blotted with antibodies against PLC, Gab1, SHP2 and Grb2. The amount of phospho-Grb2 was used as a non-substrate control. The level of phosphorylated Shc was checked to verify TC-PTP activity. The phosphorylation levels of the indicated proteins, in the presence of normal (1) and induced (2) phosphatase expression were normalized and plotted as a bar diagram.
EGF and insulin hormones: a different response of HEK 293 cells HEK 293 cells were induced for 5 minutes with EGF (lane 2, Figure 26) or with insulin (lane 3, Figure 26). We monitored EGF induction by detecting the phosphorylation of the Shc protein. Akt was not found to be activated either by EGF or by insulin hormone. On the other hand the MAP kinase pathway, whose activity was monitore by an antibody against activated ERK, is induced only when we stimulated with EGF.
Figura 26. HEK 293 cells were starved for 18 hours and then were induced with EGF 100ng/ml (lane 2) or insulin 100ng/ml (lane 3) hormones for 5 minutes. As control, we used starved cells (lane 1). Input material was controlled with antibodies against Shc protein (WB anti Shc), ERK proteins (WB anti p42/44 MAPK), and Akt protein (WB anti Akt) to detect their activation; the input were also detected with anti Gab1, anti SHP2 and anti tubulin antibodies.
The protein phosphatase SHP2, which binds to Gab1, was reported to be a positive regulator of the MAPK pathway after EGF induction. A portion of the extract was immuno-precipitated with anti-Gab1 antibody and, as shown in Figure 27, phosphorylated Gab1 binds SHP2 only upon EGF induction. ERK1/2 proteins, that are activated in these conditions as shown in Figure 27, don‟t interact with Gab1 (Figure 27).
Figura 27. HEK 293 cells were starved for 18 hours and then were induced with EGF 100ng/ml (lane 2) or insulin 100ng/ml (lane 3) hormones for 5 minutes. As control, we used starved cells (lane 1). A fraction of the extract (1 mg) was immuno-precipitated with anti Gab1 antibody and IP material was revealed with anti Gab1 protein (WB anti Gab1), to control the immunoprecipitation, with anti 4G10 antibody (WB anti 4G10) to detect the phosphorylation of Gab1, anti SHP2 (WB anti SHP2) and p42/44 MAPK (WB anti p42/44 MAPK) antibodies to detect their binding to Gab1 protein.
PTP1B specifically interferes with SHP2 recruitment by Gab1 and with ERK1/2 activation
In the previous experiments we have demonstrated that PTP1B dephosphorylates Gab1. Thus, to lend functional support to our findings, we entertained the hypothesis that the observed modulation of Gab1 phosphorylation levels by PTP1B overexpression could affect the binding of SHP2 to Gab1 and consequently attenuate ERK signaling. To support this hypothesis we transfected HEK 293 cells with PTP1B and stimulated them with EGF for 5 minutes. The protein content in cell extracts was monitored with specific antibodies (Figure 28). A fraction of the protein extract was precipitated with an antibody against Gab1 and the immuno-precipitated material was revealed with antibodies against Gab1, to control the immunoprecipitation efficiency, and anti SHP2, to monitor the formation of a Gab1-SHP2 complex (Figure 28, left panel). Gab1 phosphorylation induced by EGF was tracked with an anti phosphotyrosine antibody (4G10) and by far western with the two SH2 domains of SHP2 (Figure 28, left panel) that bind Gab1 phosphotyrosines (Shi et al., 2000). EGF stimulation (lane 3) results in tyrosine phosphorylation of Gab1 and as a consequence in the formation of a Gab1-SHP2 complex. This interaction occurs between the phosphorylated tyrosine 627 and 659 of Gab1 and the SHP2 SH2 domains (Cunnich et al., 2001). The PTP1B over-expression (lane 4) leads to a substantial decrease of the amount of SHP2 associated to Gab1, a decrease that parallels a reduction in Gab1 phosphorylation and in SH2 binding (Figure 28, left panel). In the right panel, we monitor the amount of proteins in the input. We also observed the MAPK phosphorylation level induced by EGF in the absence (lane 3) and in the presence (lane 4) of PTP1B and as illustrated in figure 29, the phosphorylation profiles of ERK1 and 2 proteins decreas after PTP1B over-expression (lane 4) respect to control (lane 3)
Figura 28. HEK 293 cells were transiently transfected with FLAG-tagged PTP1B (lanes 2 and 4) or with the corresponding amount of empty FLAG vector (lanes 1 and 3) and were stimulated with EGF for 5 minutes (lanes 3, 4). 1 mg of protein extract was immuno-precipitated with anti-Gab1 antibody (IP: anti-Gab1). The IP material (left panel) was immunoblotted with antibodies against Gab1 (WB: anti-Gab1) to control Gab1 immunoprecipitation, 4G10 (WB: anti-4G10) to monitor Gab1 phosphorylation levels, SHP2 (WB: anti-SHP2) to verify its interaction with Gab1 and with the purified SH2 domains of SHP2 to verify if the tandem SH2 domains of SHP2 interact with the phospho-tyrosines of Gab1. The amount of immuno-precipitated Gab1 was used as a reference to quantify and blot the fraction of Gab1 phosphorylated in the four different experimental conditions. In the bar diagram in A are quantified the amount of SHP2 and of SH2 domains bound to Gab1. The input (right panel) was revealed with antibodies against Gab1 SHP2, PTP1B and tubulin, as input control. The anti-beta-tubulin antibody was used as a loading control and the anti-PTP1B antibody was used to verify PTP1B transfection.
To further investigate the interaction between PTP1B and Gab1 we performed the overexpression of PTP1B in a doxycycline inducible 293 cell line. After 24 hours of PTP1B expression, we observed the dephosphorylation of Gab1 and the decrease of the Gab1-SHP2 complex (Figure 30). The observed impact of PTP1B on the formation of the Gab1 SHP2 complex is specific since it is not observed in inducible cell lines expressing the related phosphate TC-PTP (Figure 31).
Figura 29. HEK 293 cells were transiently transfected with FLAG-tagged PTP1B (lanes 2 and 4) or with the corresponding amount of empty FLAG vector (lanes 1 and 3) and were stimulated with EGF for 5 minutes (lanes 3, 4). The protein extracts were immunoblotted also with anti-phospho p42-44MAPK-ERK1/2, to control the activation of ERK1/2. The ratio of phosphorylated p42-44 MAPK to total ERK1/2 protein is plotted.
Figura 30. HEK 293 cells stably transfected with FLAG tagged PTP1B were treated 24 h with doxycycline to induce the expression of the two phosphatases (lanes 3). HEK 293 cells were then induced five minutes with EGF (lanes 2 and 3). 1 mg of the protein extract of each sample was immuno-precipitated with Gab1 antibody (IP: anti-Gab1). The input and the Gab1-bound proteins (IP material) were immunoblotted with antibodies against Gab1 (WB: anti-Gab1) to verify IP; anti-SHP2 (WB: anti-SHP2) to verify the presence of Gab1 interacting protein and 4G10 to monitor the level of phosphorylated Gab1. The expression of PTP1B was revealed using FLAG antibody.
Figura 31. HEK 293 cells stably transfected with FLAG tagged TC-PTP (A) were treated 24 h with doxycycline to induce the expression of the phosphatase (lanes 3). HEK 293 cells were then induced five minutes with EGF (lanes 2 and 3). 1 mg of the protein extract of each sample was immuno-precipitated with Gab1 antibody (IP: anti-Gab1). The input and the Gab1-bound proteins (IP material) were immunoblotted with antibodies against Gab1 (WB: anti-Gab1) to verify IP and anti-SHP2 (WB: anti-SHP2) and 4G10 to monitor the level of phosphorylated Gab1. The expression of TC-PTP phosphatases was revealed using FLAG antibody The amount of immuno-precipitated Gab1 was used as a reference to quantify the SHP2 fraction bound to phosphorylated Gab1 in TC-PTP overexpression conditions (bar diagram)