ALMA MATER STUDIORUM - UNIVERSIT `A DI BOLOGNA SEDE DI CESENA
SECONDA FACOLT `A DI INGEGNERIA CON SEDE A CESENA CORSO DI LAUREA MAGISTRALE IN INGEGNERIA
BIOMEDICA
TITOLO DELLA TESI
MODELING AND SIMULATION OF A SYNTHETIC
GENETIC CIRCUIT THAT IMPLEMENTS A
MULTICELLED BEHAVIOR IN A GROWING
MICROCOLONY OF E. COLI
Tesi in:
Bioingegneria Molecolare e Cellulare LM
Relatore
Prof. Ing. Stefano Severi
Correlatori
Presentata da
Prof. Emanuele Domenico Giordano
Andrea Samor´
e
Ing. Seunghee Shelly Jang
Prof. Ing. Eric Klavins
Sessione III
Contents
1 Molecular and Synthetic Biology 12
1.1 Nucleic Acids . . . 12 1.2 DNA . . . 13 1.3 RNA . . . 15 1.4 Transcription . . . 16 1.5 Translation . . . 17 1.6 Synthetic Biology . . . 18
1.6.1 Gene Expression Regulation . . . 19
1.6.2 Modeling . . . 22
2 Leader Election Project 24 2.1 Introduction . . . 24
2.2 Genetic Circuit . . . 25
2.3 Genetic components . . . 26
3 Mathematical Model 31 3.1 Input functions . . . 31
3.1.1 Promoter regulated by a repressor . . . 31
3.1.2 Promoter regulated by an activator . . . 33
3.1.3 Binding of an inducer to a transcription factor . . . 33
3.1.4 Hybrid promoter regulated by a repressor and an acti-vator . . . 35
3.2 Enzyme Kinetics . . . 36
3.3 Model of the Leader Election Circuit . . . 38
3.3.1 Assumptions . . . 38
3.3.2 Terms of the model . . . 38
3.3.3 Parameters . . . 41
4 Simulations and Results 43 4.1 gro environment . . . 43
4.2.1 Cost Function . . . 47
4.2.2 Ranking . . . 49
4.3 Results . . . 51
4.4 Conclusions . . . 60
4.5 Future application: pattern formation . . . 61
4.5.1 Spots . . . 63
4.5.2 Rings . . . 66
4.5.3 Considerations . . . 68
5 Appendix 69 5.1 Python script to split simulations on a Linux cluster . . . 69
5.2 gro Models . . . 78
5.2.1 Leader Election . . . 78
5.2.2 Spots . . . 83
5.2.3 Rings . . . 84
List of Figures
1.1 Nucleotides [1] . . . 12
1.2 DNA chemical structure [2] . . . 14
1.3 Scanning electron micrograph of Escherichia coli [3] . . . 18
1.4 Structure of a bacterial promoter . . . 20
2.1 Example of the wanted behavior. Leader cells are green, fol-lowers are red and undecided are grey. . . 24
2.2 Proposed genetic circuit of the Leader Election project [4] . . 25
2.3 L-Arabinose . . . 27
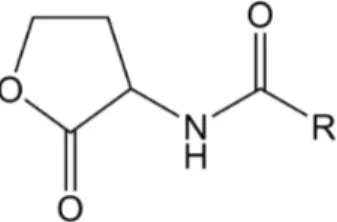
2.4 General structure of N-Acyl Homoserine Lactone (AHL) . . . 29
3.1 Input function of a gene regulated by a repressor with kd = 10 33 3.2 Input function of a gene regulated by an activator with kd = 10 34 3.3 Input function of an hybrid promoter with kdA = kdR = 10 and n = 2 . . . 36
4.1 Simulation of stochastic production and degradation of red fluorescent protein (RFP). The cells are genetically identical but the amount of protein differs slightly between individuals, note the different red intensity . . . 44
4.2 Example of sensitivity plot. The parameter βLuxI is varied over about two orders of magnitude around its nominal value, depicted as a yellow square. . . 48
4.3 Fitting of the cost function . . . 48
4.4 Structure of the scatter plot used to rank the parameters. On the left, the information that has been used to place the βLuxI dot in the right-hand graph. . . 49
4.5 The four zones of the scatter plot used to rank the parameters 50 4.6 Scatter plots when the goal is set to a majority of followers. . 52
4.7 The goal is set to a majority of followers. Left-hand column: cost function of the four most promising parameters. Right-hand column: the corresponding fraction of leaders, followers
and undecided cells are depicted in green, red and black. . . . 54
4.8 Scatter plot when the goal is to obtain a population in which there are about as many leaders as followers. . . 55
4.9 The goal is set to a colony split in half between leaders and followers. Left-hand column: cost function of the four most promising parameters. Right-hand column: the corresponding fraction of leaders, followers and undecided cells are depicted in green, red and black. . . 56
4.10 Scatter plot when the goal is set to a majority of leaders. . . . 58
4.11 The goal is set to a majority of leaders. Left-hand column: cost function of the four most promising parameters. Right-hand column: the corresponding fraction of leaders, followers and undecided cells are depicted in green, red and black. . . . 59
4.12 Example of pattern created by a Ben-Jacob’s bacterial strain. The image of P. vortex colony was created at Prof. Ben-Jacob’s lab, at Tel-Aviv University, Israel . . . 62
4.13 Simulation of the spots-forming finite state machine . . . 65
4.14 Simulation of the rings-forming finite state machine . . . 67
Sommario
La Biologia Sintetica `e una disciplina relativamente nuova, nata nei primi
anni duemila, che porta il tipico approccio ingegneristico al campo delle
bio-tecnologie: astrazione, modularit`a e standardizzazione vengono utilizzati per
tentare di domare l’estrema complessit`a dei componenti e costruire sistemi
biologici artificiali con una funzione definita. Questi sistemi, tipicamente
cir-cuiti genetici sintetici, vengono perlopi`u implementati in batteri e semplici
organismi eucariotici come ad esempio i lieviti. La cellula diventa quindi
una macchina programmabile ed il suo linguaggio macchina `e costituito da
sequenze nucleotidiche.
Il lavoro di tesi `e stato svolto in collaborazione con ricercatori del
De-partment of Electrical Engineering dell’Universit`a di Washington a Seattle
e con una studentessa del Corso di Laurea in Ingegneria Biomedica
dell’U-niversit`a di Bologna: Marilisa Cortesi. Nell’ambito della collaborazione ho
contribuito ad un progetto di Biologia Sintetica gi`a avviato nel Klavins Lab,
in particolare mi sono occupato della modellazione matematica e simulazione di un circuito genetico sintetico pensato per implementare un comportamento multicellulare in una microcolonia batterica.
Nel Primo Capitolo sono introdotte le basi della biologia molecolare, in particolare si accenna alla struttura degli acidi nucleici e vengono illustrati i processi di trascrizione e traduzione che danno luogo all’espressione genica. Sono inoltre enunciati i principali meccanismi di regolazione dell’espressio-ne genica sia al livello trascrizionale che traduzionale. Un’introduziodell’espressio-ne alla biologia sintetica completa la sezione.
Nel Secondo capitolo `e descritto il circuito genetico sintetico pensato per
far emergere spontaneamente due gruppi di cellule differenti, detti leaders e followers, a partire da una colonia isogenica. Il circuito si basa sull’intrinseca
stocasticit`a dell’espressione genica e sulla comunicazione intercellulare per
mezzo di una piccola molecola segnale per rompere la simmetria nel fenotipo della microcolonia. Sono illustrati inoltre i quattro moduli di cui il circuito si compone (coin flipper, sender, receiver e follower) e le loro interazioni.
dei singoli componenti del circuito genetico sintetico. Vengono poi esplici-tate le varie assunzioni semplificative che si sono rivelate necessarie al fine
di ridurne la complessit`a e quindi permetterne la simulazione. Trascrizione
e traduzione sono modellate in un unico passo e l’espressione dei vari geni dipende dalla concentrazione intracellulare dei fattori di trascrizione che agi-scono sui promotori utilizzati. Sono infine elencati i valori dei vari parametri e le fonti da cui sono stati ricavati.
Nel Quarto Capitolo sono dapprima descritte le caratteristiche principa-li dell’ambiente di simulazione, gro, sviluppato dal Self Organizing Systems
Laboratory dell’Universit`a di Washington. Viene poi dettagliata l’analisi di
sensitivit`a svolta per individuare quali caratteristiche dei diversi componenti
genetici sono desiderabili per il funzionamento del circuito. In particolare, `e
definita una funzione costo basata sia sul numero di cellule che si trovano in ognuno dei vari stati possibili al termine della simulazione che sul risultato voluto. In base alla funzione costo e tramite un tipo particolare di scatter plot, viene stilata una classifica di parametri. A partire da una condizione iniziale in cui i parametri assumono valori in un ordine di grandezza compa-tibile con le informazioni attualmente disponibili nella letteratura scientifica, questa classifica suggerisce quale componente genetico conviene regolare al
fine di ottenere il risultato voluto. Il comportamento per cui il circuito `e
stato ideato, ottenere una colonia in cui la quasi totalit`a di cellule siano nello
stato follower e solo qualcuna nello stato leader, sembra essere il pi`u difficile
da raggiungere. Poche cellule leader non riescono a produrre abbastanza se-gnale per far passare il resto della colonia nello stato follower. Per ottenere
una colonia in cui la maggioranza di cellule sia nello stato follower `e
necessa-rio aumentare il pi`u possible la produzione dell’enzima che genera il segnale.
Ottenere una colonia in cui met`a delle cellule sia nello stato leader e l’altra
met`a nello stato follower `e pi`u semplice. La strategia pi`u promettente
sem-bra essere aumentare leggermente la produzione di enzima. Per ottenere una
maggioranza di cellule leader, invece, `e consigliabile aumentare l’espressione
basale dei geni nel modulo coin flipper. Al termine del capitolo, una possibile applicazione futura del circuito genetico sintetico, la formazione spontanea
di pattern spaziali in una microcolonia, `e modellata ad un alto livello di
astrazione tramite il formalismo degli automi a stati finiti. La simulazione in gro fornisce indicazioni sui componenti genetici non ancora disponibili e
che `e quindi necessario sviluppare al fine di ottenere questo comportamento.
In particolare, dato che entrambi gli esempi di pattern proposti si basano
su una versione locale di Leader Election, `e essenziale utilizzare un metodo
di comunicazione intercellulare a corto raggio. Risulta inoltre fondamentale sviluppare componenti genetici che permettano di rallentare la crescita di
L’Appendice, infine, contiene il codice utilizzato per simulare il modello in gro, il listato di uno script Python utile per parallelizzare l’analisi di
sensi-tivit`a su un cluster Linux ed il codice Matlab con cui sono stati elaborati i
Abstract
Synthetic Biology is a relatively new discipline, born at the beginning of the New Millennium, that brings the typical engineering approach (abstrac-tion, modularity and standardization) to biotechnology. These principles aim to tame the extreme complexity of the various components and aid the construction of artificial biological systems with specific functions, usually by means of synthetic genetic circuits implemented in bacteria or simple eukary-otes like yeast. The cell becomes a programmable machine and its low-level programming language is made of strings of DNA.
This work was performed in collaboration with researchers of the Depart-ment of Electrical Engineering of the University of Washington in Seattle and also with a student of the Corso di Laurea Magistrale in Ingegneria Biomed-ica at the University of Bologna: Marilisa Cortesi. During the collaboration I contributed to a Synthetic Biology project already started in the Klavins Laboratory. In particular, I modeled and subsequently simulated a synthetic genetic circuit that was ideated for the implementation of a multicelled be-havior in a growing bacterial microcolony.
In the first chapter the foundations of molecular biology are introduced: structure of the nucleic acids, transcription, translation and methods to reg-ulate gene expression. An introduction to Synthetic Biology completes the section.
In the second chapter is described the synthetic genetic circuit that was conceived to make spontaneously emerge, from an isogenic microcolony of bacteria, two different groups of cells, termed leaders and followers. The circuit exploits the intrinsic stochasticity of gene expression and intercellular communication via small molecules to break the symmetry in the phenotype of the microcolony. The four modules of the circuit (coin flipper, sender, receiver and follower) and their interactions are then illustrated.
In the third chapter is derived the mathematical representation of the various components of the circuit and the several simplifying assumptions are made explicit. Transcription and translation are modeled as a single step and gene expression is function of the intracellular concentration of the
various transcription factors that act on the different promoters of the circuit. A list of the various parameters and a justification for their value closes the chapter.
In the fourth chapter are described the main characteristics of the gro simulation environment, developed by the Self Organizing Systems Labora-tory of the University of Washington. Then, a sensitivity analysis performed to pinpoint the desirable characteristics of the various genetic components is detailed. The sensitivity analysis makes use of a cost function that is based on the fraction of cells in each one of the different possible states at the end of the simulation and the wanted outcome. Thanks to a particular kind of scatter plot, the parameters are ranked. Starting from an initial condition in which all the parameters assume their nominal value, the ranking suggest which parameter to tune in order to reach the goal. Obtaining a microcolony in which almost all the cells are in the follower state and only a few in the leader state seems to be the most difficult task. A small number of leader cells struggle to produce enough signal to turn the rest of the microcolony in the follower state. It is possible to obtain a microcolony in which the ma-jority of cells are followers by increasing as much as possible the production of signal. Reaching the goal of a microcolony that is split in half between leaders and followers is comparatively easy. The best strategy seems to be increasing slightly the production of the enzyme. To end up with a majority of leaders, instead, it is advisable to increase the basal expression of the coin flipper module. At the end of the chapter, a possible future application of the leader election circuit, the spontaneous formation of spatial patterns in a microcolony, is modeled with the finite state machine formalism. The gro simulations provide insights into the genetic components that are needed to implement the behavior. In particular, since both the examples of pattern formation rely on a local version of Leader Election, a short-range commu-nication system is essential. Moreover, new synthetic components that allow to reliably downregulate the growth rate in specific cells without side effects need to be developed.
In the appendix are listed the gro code utilized to simulate the model of the circuit, a script in the Python programming language that was used to split the simulations on a Linux cluster and the Matlab code developed to analyze the data.
Ringraziamenti
Desidero qui ringraziare in primo luogo la mia famiglia, per tutto il supporto fornitomi da sempre ma in particolare in questi anni di studio universitario,
senza il loro appoggio sarebbe stato tutto pi`u difficile.
Un ringraziamento speciale va a Marilisa per il continuo incoraggiamento, le discussioni, le risate, il tempo passato insieme. Senza di lei questa tesi non sarebbe stata possibile.
Un grazie enorme al Prof. Stefano Severi, che con la sua infinita
disponi-bilit`a ha reso realt`a il sogno di un periodo di studio all’estero. Grazie mille
anche al Prof. Emanuele Giordano e alla Dottoressa Francesca Ceroni per i vari consigli ed il loro entusiasmo. Grazie a Shelly Jang ed Eric Klavins per avermi gentilmente accolto nel loro gruppo di ricerca per un periodo di diver-si mediver-si, durante i quali ho imparato molto ed appreso un approccio diverso ai problemi.
Grazie a Yaoyu Yang per la cena in un ristorante giapponese in cui mi ha fatto scoprire il sake! Grazie a William e Kristin, per tutto il tempo passato
insieme a Seattle, le chiaccherate (met`a in italiano e met`a in inglese) sulle
differenze fra Stati Uniti ed Italia, le birre, la casa stregata e la caccia agli zombies!
Grazie a Gianluca Selvaggio, che dal Portogallo ha sempre diffuso buon
umore attraverso Skype e lo stesso ha fatto Claudio Silvani, per`o
dall’Ita-lia. Grazie infine a tutti gli amici che sono entrati nella mia vita ed hanno contribuito a rendermi quello che sono.
Chapter 1
Molecular and Synthetic
Biology
1.1
Nucleic Acids
Nucleic Acids are linear macromolecules obtained by assembling, through covalent bond, simple building blocks named nucleotides. Each nucleotide is composed of three fundamental units: a pentose sugar, ribose o deoxiribose, a nitrogenous base in position 1’, and a phosphoric acid esterified to the alcoholic group of the sugar in position 5’ (Figure 1.1). Depending on the sugar utilized, the nucleotides are classified in deoxiribonucleotides and ri-bonucleotides. A molecule composed of the pentose sugar and a nitrogenous base, bound in position 1’, is called nucleoside.
Figure 1.1: Nucleotides [1]
The DNA is formed of deoxyribonucleotides, while the RNA is composed of ribonucleotides. There are five nitrogenous bases that are most commonly
used in the construction of nucleic acids: adenine (A), guanine (G), cytosine (C) and thymine (T) in the DNA, adenine (A), guanine (G), cytosine (C) and uracil (U) in the RNA, where the uracil substitutes the thymine.
1.2
DNA
The deoxyribonucleic acid (DNA) is the genetic material of the cell, it con-tains all the information necessary for protein synthesis and for the regulation of the cell’s functions. The structure of the DNA of prokaryotic cells is very simple, it is indeed formed of a single circular chromosome free in the cytosol that is not associated with any protein nor organized in complex structures, unlike the eukaryotic ones. The DNA has a fundamental role because it allows to describe the entire cell:
• codes all the information necessary to the life of the cell;
• its structure allows for a simple and elegant transmission of all the information needed to build an organism from a generation to the next; • directs and controls the entire vital cycle of the cell;
• can rarely mutate, change its description, in order to modify the infor-mation that it codifies and thus, generate an evolution of the functions. The DNA is composed of two filaments with complementary orientation: for every G in a filament there’s a C in the corresponding position in the complementary filament, and vice-versa. Every A of a filament is associated to a T and the other way around. The interaction between A and T and between C and G is specific and stable: the nitrogenous base guanine, with its double-ringed structure, is too big to fit in the space between the two filaments of the DNA, if coupled with the double ring of the adenine or with another guanine. Likewise, the nitrogenous base thymine, with its single-ringed structure, is too small to pair with another single-single-ringed base like cytosine or another thymine. Only the nitrogenous bases C and G, A and T have the appropriate spatial conformation and chemical interaction needed to form a stable base pairing (hydrogen bonds). Three hydrogen bonds form between C and G, and only two between A and T. The two DNA filaments are not just complementary but even antiparallel (Figure 1.2).
Triplets of nitrogen bases (codons) code for the twenty different amino acids that compose proteins. Most of the amino acids are coded by more
are used as a stop signal for translation. This redundant code makes the genetic information robust with respect to single nucleotide mutations.
Except for the mitochondrial DNA and the one of a small number of prokaryotes, the genetic material is universal, meaning that it follows the same rules in every living organism and virus.
1.3
RNA
The RNA has a structure that is very similar to that of DNA, in fact the genetic code of some viruses is entirely composed of RNA. However, it has assumed a totally different role in more complex organisms and so cells whose chromosomes are made of RNA do not exist.
There are three main differences between ribonucleic acid and deoxyri-bonucleic acid, in particular, the RNA:
• doesn’t usually assume the three dimensional double helix structure typical of the DNA;
• contains ribose and not deoxyribose;
• contains the base uracil in place of thymine.
All the RNA present in the cell is synthesized from a DNA mold by particular enzymes, RNA polymerases, while its degradation is performed by another group of enzymes, the ribonucleases.
In a prokaryotic cell there are, in different quantities, three types of RNA: messenger RNA, ribosomal RNA and transfer RNA. Each kind of RNA has different functions:
• the messenger RNA (mRNA) provides to the protein synthesis appara-tus a copy of the message codified in a gene of the DNA. The mRNA represent only a small fraction of the RNA present in the cell, even because a single RNA molecule can be used as a mold for many copies of the protein that it codifies;
• the ribosomal RNA (rRNA) is the type of RNA that has the highest concentration in the cell as it is part of the ribosomes, organelles that decode RNA and synthesize proteins. The ribosomes that are found in prokaryotic cells contain three different rRNAs named, after their sedimentation coefficient, 23S, 16S and 5S.
• the transfer RNA (tRNA) is composed of small molecules of ribonucleic acid that bind specifically and activate the single amino acids, while bringing them to the mRNA-ribosome complex, to become part of the forming polypeptidic chain. For every amino acid involved in protein synthesis there’s, at least, a specific tRNA.
1.4
Transcription
The RNA is synthesized from molds of DNA through the activity of the RNA polymerase. The RNA polymerase that can be found in E. coli cells
is a protein complex formed by four subunits, named α2, β, β0 and σ. The
complex α2ββ0contains the catalytic site and the sites responsible to bind the
DNA. The σ subunit, instead, is involved in the first steps of transcription: it is able to recognize the beginning of transcription due to the presence of a DNA region named promoter, and helps the opening of the double helix. The σ subunit is released when the RNA synthesis begins, while the remainder of the complex continues the synthesis.
In order to fulfill its function, the RNA polymerase needs triphosphate
nucleotides, the DNA sequence to be copied and bivalent ions (M g2+, M n2+).
The RNA polymerase scans the DNA sequence, looking for a specific sequence that marks the beginning of the region to transcribe. The σ subunit of the RNA polymerase recognizes the consensus sequences of the promoter, placed 35 and 10 nucleotides upstream of the beginning of transcription.
The higher the affinity between a particular promoter sequence and the σ subunit of the RNA polymerase, the higher will be the frequency of tran-scription of that gene. There are seven different σ subunits in the E. coli cell and the possibility of building RNA polymerases with significantly different σ factors allows the cell to activate or deactivate entire systems of genes with similar promoters.
The proteins produced by some genes are useful only in combination with other proteins. For this reason some groups of prokaryotic genes are under the control of the same promoter, this structure is called operon. A typical example is the lactose operon that contains three genes involved in the metabolism of this sugar. The transcription of an operon produces a long mRNA molecule that will be used by the ribosomes to synthesize the various proteins.
Some regulatory proteins, transcription factors, can precisely modulate transcription in response to external stimuli. The lactose operon, for exam-ple, has a promoter recognized by the σ70 RNA polymerase but its expression is maximized when the environment is rich in lactose and devoid of glucose.
When the levels of lactose are low, the protein LacI binds to a specific se-quence in the lac promoter just downstream of the -10 box, termed operator site. When LacI is bound to the operator, the steric bulk prevents the RNA polymerase from transcribing the downstream sequence, therefore it acts as a negative regulator (repressor). LacI is even able to bind allolactose, a lac-tose metabolite. When that happens the affinity of LacI for the operator site drastically diminishes thus increasing the probability of transcription of the genes of the operon. The consensus sequences of the promoter driving the lactose operon are not very similar to the ones better recognized by the RNA polymerase, so the lactose operon isn’t expressed at high levels even when LacI is not bound to the promoter. The receptor protein for the cyclic AMP (CRP) that, when the levels of glucose are low, is able to bind a sequence in the lac promoter, increases the transcription rate and thus acts as a positive regulator (activator).
1.5
Translation
The translation process, that leads to protein synthesis, can be subdivided in three steps: initiation, elongation and termination. In the initial phase the ribosome finds the point at which translation starts by recognizing a particular sequence of nucleotides in the mRNA, named ribosome binding site (RBS), to which it binds. The elongation phase consist of a sequence of iterated reactions:
• combination of aminoacyl-tRNA, ribosome subunits, other proteic fac-tors and the codon in the mRNA;
• formation of the peptide bond between the α-amminic group, of the amino acid bound to the tRNA, and the α-carboxylic one of the last amino acid of the polypeptidic chain forming on the ribosome. This causes the release of the tRNA bound to the second to last amino acid added to the chain;
• sliding of the ribosome on the mRNA till the next codon;
The termination phase, that begins when the ribosome reads one of the stop codons, causes the release of the polypeptidic chain. The correct imple-mentation of these phases rely on the contribution of both proteic and non proteic factors.
1.6
Synthetic Biology
Synthetic biology is a relatively new discipline, founded at the beginning of the 2000s with the realization of the Repressilator [5] and the Toggle Switch [6]. It aims to engineer biology: the goal is to create a systematic engineering science, founded on the standardization of cellular chassis, the types of parts available, their manufacture, their characterization and protocols for their interconnection, analogous to those that underlie and enable the scalability of mechanical, electrical and civil engineering [7]. In order to do that, the engineers involved in this new field have started to apply some of the clas-sical principles of engineering to biology: standardization, decoupling and abstraction.
The most used organism in synthetic biology applications is Escherichia coli (Figure 1.3), a gram negative bacteria often found in the intestine of warm blooded organisms. Most E. coli strains are not pathogens, but some of them are cause of acute food poisoning.
Figure 1.3: Scanning electron micrograph of Escherichia coli [3]
This bacterium plays a very important role in biotechnology and synthetic biology because it is quite easy to handle and it has been very widely used as laboratory organism. The work of Stanley Norman Cohen and Herbert Boyer, in which plasmids and restriction enzymes are used to build recombinant DNA in E. coli, is one of the foundations of biotechnology.
After being studied for over sixty years, E. coli is the organism better understood at molecular level and most of what is known about molecular processes can be ascribed to fundamental discoveries made in E. coli. Tamed strains, like K12, are well adapted to the laboratory environment and, unlike the wild type strains, have lost their capability to proliferate in the intestine and form biofilms.
The aim of a synthetic biology project is usually to build a synthetic ge-netic circuit that implements a particular function inside the cell. Regulation of gene expression at both the transcription and translation level is the chief way to make a group of genes solve a defined task.
1.6.1
Gene Expression Regulation
The necessity to tune gene expression and adapt it to the changes in the environment, has pushed the cell to develop mechanisms to change the rate of production of the different proteins. Synthetic biology exploits the reg-ulatory elements of the cell to achieve a specific objective. It is important to remember that all the tuning methods that are described in the following sections can be combined in order to obtain the desired expression rate. Regulation of Transcription
Regulation of transcription is needed to tune the amount of mRNA that is produced by the molecular machinery in a defined amount of time. It is mainly accomplished by modifying the promoter region of the considered gene or group of genes. The typical structure of a promoter is represented in Figure 1.4, the regions identified with -35 and -10 are the fundamental components of every promoter, since they are the sequences recognized by the σ subunit of the RNA polymerase. Their activity can be modulated by substituting single bases of the standard sequences for these elements, or by changing their relative distance.
A modification of the sequence of these regions usually diminishes the affinity between the RNA polymerase and the promoter, this decreases the rate of transcription and, as a consequence, the amount of mRNA available for translation. Indirectly, the concentration of the protein inside the cell will diminish. The variation in gene expression due to a different length of the core sequence is more difficult to predict. Intuitively there will be an optimal spacing, defined by the distance between the DNA-bounding regions of the RNA-polymerase, and any significant variation from that value will
Figure 1.4: Structure of a bacterial promoter
constitutive, modifying these regions is the main way to tune gene expression at the transcriptional level.
A regulated promoter is a promoter whose action is modulated by one or more transcription factors. A transcription factor is a molecule that gener-ally conveys an important information about an event, like a change in the environment in which the cell resides. This class of promoters is fundamental because it allows the cell to adapt the protein production to a necessity that changes in time.
The structure of a regulated promoter is the same as the one reported in Figure 1.4, the -10 and -35 boxes still have the same function and they can be used to control gene expression in the same way. In this case, though, there is an additional layer of regulation: the promoter contains even consensus sequences for the transcription factor, called operator sites. The transcription factor can bind to these sequences that are usually placed in one, or more, of the other regions of the promoter (Figure 1.4). Some consensus sequences are even found far from the promoter, both upstream and downstream, but they usually are functional only if coupled with another operator site in the promoter region. Due to the secondary importance of these sites, and the difficulty of defining clearly their activity, they are used very rarely for synthetic applications.
A transcription factor can be either an activator or a repressor, this means that there are transcription factors that promote the transcription of a gene, increasing the rate of transcription upon binding, and others that, when bound, reduce the production of mRNA, usually by preventing the RNA polymerase-promoter complex formation.
The region of the promoter in which an operator site is placed has a fundamental effect on its functionality. Repressors usually work by physically hampering the polymerase, thus preventing it from transcribing the DNA, so they will be maximally effective in the proximal or core regions. Activators, on the other hand, increase the transcription by favoring the binding between the RNA-polymerase and the promoter, so they are usually placed in distal,
where they can carry out their function without unintentionally obstruct the promoter.
This kind of regulation is incredibly specific, most promoters can respond to at most two transcription factors and the sensitivity and the strength of the modulation can be tuned by changing the consensus sequence and/or its location. In order to utilize a particular regulated promoter in a synthetic circuit and avoid unwanted interactions, it is necessary to understand its functioning in the bacterial environment. The activity of several transcrip-tion factors can be modulated by the interactranscrip-tion with a number of small molecules, named inducers. Several examples of this class of regulatory ele-ments will be described in the following chapter.
Regulation of Translation
Regulation of translation can be mainly achieved by acting on the Shine-Dalgarno region, also named ribosome binding site (RBS) after its function. The interaction between the ribosome and the RNA is quite well understood, computational models allow to predict the translational efficiency of a par-ticular RBS and to design new ones with defined strength. The possibility to tune the level of protein produced is extremely important in most synthetic biology applications, and this technique is often more accurate than the ones that act at transcriptional level, since it affects directly the translation pro-cess. Modifying the RBS region can be really effective to place the protein production in the desired order of magnitude, but its action is too coarse to tune it finely.
Another technique to regulate gene expression at the translational level that has been recently devised consists in modifying the length of the spacer between the RBS and the first codon of the sequence of the protein [8]. By increasing the span of this region it is possible to down-regulate the rate of translational initiation, since the relative positions of the Shine-Dalgarno region and the first codon will not be optimal. This method has been tested in E. coli using simple sequence repeats (SSR) to alter the spacer. The use of simple sequence repeats couples the translational regulation of gene ex-pression with an increase of the mutation rate of the spacer region, because repeated sequences have a strong bias for insertions/deletions. This second aspect of the tuning technique allows to take advantage of evolution to opti-mize the length of the spacer region.
The SSR used to implement this kind of regulation are composed of the repetition of one or two nucleotides and, from the characterization performed in [8], it is clear the possibility to tune gene expression over several orders of
magnitude. In the same paper it is even described how the nucleotidic com-position of the SSR can influence the decrease of the translational initiation rate. In particular, a SSR composed of only adenines will have the steep-est decline, while a poly-thymines sequence should grant the most gradual decline.
Sequence repeats seem ideal to tune gene expression because the relation between the length of the sequence and its effect on translation is very well defined. Besides, the regulatory range achievable by coupling this method with other techniques, like promoter engineering, is very large. The choice of using repetitions of nucleotides makes it really easy to experimentally sample the expression space, through combinatorial modifications the SSR region.
A third way to regulate gene expression at the translational level utilizes small antisense RNAs that target specific mRNAs in the cell. The antisense RNA is usually a short ribonucleotidic sequence that binds to a transcribed mRNA. The steric bulk interferes with translation while double stranded RNA is targeted for degradation. This kind of regulation is faster than tran-scriptional regulation mediated by transcription factors because it removes from the cytoplasm genes that have been already transcribed.
1.6.2
Modeling
The application of the previously mentioned engineering principles is greatly limited by various factors [9]:
• inability to avoid or manage biological complexity;
• tedious and unreliable construction and characterization of synthetic biological systems;
• evolution.
As a consequence, even simple modules can take a significant amount of time and resources to construct from devices, often requiring multiple
revisions to optimize the behavior. Modeling greatly aids in overcoming
module design problems [10].
An accurate computational representation of the system can help de-vise reliable synthetic genetic circuits by determining, for example, which architecture is the most robust or the one that better adapts to a certain application. A mathematical model might even be fundamental for the char-acterization of the system, since it might be able to identify the most critical
components and provide useful suggestions about the assays necessary to completely analyze the behavior of the circuit.
Simulations have two fundamental advantages over the wet laboratory: they are usually much cheaper and also quicker than experiments. While a certain minimum amount of experiments will be required for a particular study, models can help reduce their number by scanning a wide spectrum of possible components of the circuit or different experimental conditions, and allow to select only the most promising options to test in vivo. Shrinking the number of experiments means reducing the cost of the endeavor both in time and money required.
Another nice feature of the computational representation of the circuit is the possibility of having complete control over the virtual experiment and being able to extract values of quantities not actually measurable with labo-ratory techniques. This ability extend the usefulness of the model even to the troubleshooting phase of the construction of a genetic component. Having direct access to every intracellular part and process can be really helpful to identify the source of unexpected or undesired behavior.
In order to be useful, the model needs to faithfully represent the biologi-cal system, at least in the aspects that need to be investigated. This might mean that it is going to be necessary to build more than one model for the same circuit, to accurately capture each phenomenon. The same biological system can be described with different mathematical formalisms, but even with different parameters’ sets, that define the regime in which the system operates. In order to find the better composition of mathematical represen-tation and values for the parameters it is necessary to couple the realization of the model to the biological system. Direct or indirect measures of some characteristics of the genetic components can be used to define the system’s working point in the parameter’s space or, at least, define the physiological ranges of the quantities involved. Even if this phase might be very challeng-ing, especially when it is necessary to combine data from different sources, it is clear that computational modeling is becoming a fundamental tool in synthetic biology projects.
Chapter 2
Leader Election Project
2.1
Introduction
The Leader Election project aims to engineer a multicellular behavior in a growing microcolony of E. coli, a unicellular prokaryote. The objective is the spontaneous emergence of two different groups of cells from a colony of genetically identical individuals.
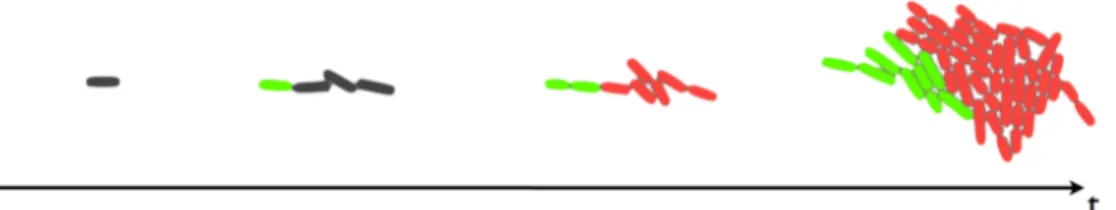
Ideally, starting from a single cell in a undecided state that grows and divides, at a certain point we want a cell to switch to a different state, named leader. Then, a leader cell must be able to turn the rest of the microcolony to the follower state (Figure 2.1). The leader and follower states are characterized by the expression of particular genes.
Figure 2.1: Example of the wanted behavior. Leader cells are green, followers are red and undecided are grey.
The construction of this system would provide an essential tool for the realization of cooperative behaviors in bacteria. The ability of a population of prokaryotes to work together toward a common goal by solving different aspects of a single task will make it possible to realize very complex
func-tionalities, without risking to make the metabolic burden unsustainable for the cells.
2.2
Genetic Circuit
The genetic circuit that was conceived to elect a group of leaders in a growing microcolony of E. coli is illustrated in Figure 2.2.
Figure 2.2: Proposed genetic circuit of the Leader Election project [4]
It can be subdivided in 4 different modules: coin flipper, sender, receiver and follower. Its modular structure was devised to allow the realization and testing of each component before the final assembly in the complete circuit. This exploits the decoupling principle, allowing to solve the issues of each module almost independently from the others.
The coin flipper module is composed of an hybrid promoter with operator sites for both the repressor TetR and another transcription factor named AraC. The hybrid promoter regulates the expression of an operon containing the coding sequences for two transcription factors: AraC and LacI.
The sender module is composed of a promoter, regulated by AraC, that controls the expression of LuxI, an enzyme that converts a couple of sub-strates into the messenger molecule AHL.
The receiver module is composed of a promoter, regulated by the re-pressor LacI, that drives the expression of LuxR. When LuxR binds AHL it
becomes an activator for the hybrid promoter of the last module, the follower one, downstream of which there is a coding sequence for the repressor TetR and another copy of the LuxI gene.
AraC acts as a repressor when the environment doesn’t contain arabinose, and becomes an activator in presence of that sugar. Before induction with arabinose, each cell of the microcolony is in the undecided state, in which there is negligible production of all the genes of the system, except LuxR, due to the basal expression of the various promoters. Leakiness is crucial for the pBAD/Tet promoter of the coin flipper module. With time, the stochastic leaky transcription and translation of AraC will give rise to a distribution of AraC concentration in the cells of the colony. Upon induction with arabinose, only the cells in which the concentration of AraC is above a certain threshold will be able to activate the positive feedback that leads to the substantial production of AraC and LacI that defines the leader state. Once the posi-tive feedback is on, LacI deactivates the receiver module and AraC activates the sender module. Leaders start producing LuxI, the enzyme catalyzes the formation of a chemical signal that diffuses in the extracellular environment and causes the nearby cells to activate the follower module. This last module represses the coin flipper with a negative feedback mediated by TetR. The second copy of the LuxI gene in the follower module is needed to relay the signal. With this second copy, cells that switch to the follower state start producing both TetR and signal, so that the information that a leader is already present in the colony, and for this reason the remaining cells should stop flipping coins, is spread quickly.
All the individuals of the colony contain the same construct, but not all the modules are ”on” in every cell. The coin flipper and sender modules are active in leaders, the receiver and follower ones are expressed in followers, while in undecided cells the only operating module is the receiver one.
2.3
Genetic components
In the following, a brief review of the natural function of the various molecular components of the circuit is presented.
AraC
In Nature, AraC is part of a complex system that allows the bacteria to exploit, as a source of carbon and energy, the pentose L-arabinose (Figure 2.3).
Figure 2.3: L-Arabinose
The wild type ara system is composed of various genes and promoters [11], [12]:
• araE is a gene that is needed for arabinose uptake and is controlled by the pE promoter;
• araF, araG and araH are also needed for arabinose uptake and are in an operon controlled by the pFGH promoter;
• araC encodes for a transcription factor and is under the control of the pC promoter;
• araB, araA and araD are a ribulokinase, an isomerase and an epimerase respectively and are under the control of the pBAD promoter.
AraC is a dimer that can interact with different operator sites: I1 and I2 are placed in the pBAD promoter and another one, O2, is about 200 base pairs upstream the other two. In absence of arabinose AraC binds to I1 and O2 and forms a loop in the DNA. In this conformation it is a repressor for both pBAD and pC. When arabinose is added to the environment, AraC binds to it and assumes a different 3D conformation that allows it to bind the I1 and I2 operator sites and act as an activator for the pBAD promoter.
LacI
LacI is part of another natural system involved in the utilization of a partic-ular sugar, lactose, as carbon source. Even this module is composed of many different parts:
• lacI is a repressor for the pLac promoter, it is constitutively transcribed and prevents the expression of the other three genes;
• lacZ codes for an enzyme, named β-galactosidase, that cleaves the dis-accharide lactose into glucose and galactose, prime carbon sources for E.coli;
• lacY is a gene that codes for a transport protein, β-galactoside per-mease, that anchors to the cell’s membrane and facilitates the lactose intake;
• lacA is the third gene of the operon controlled by pLac, it produces another enzyme, β-galactoside transacetylase, whose function is still unclear.
A LacI tetramer can bind the wild type pLac promoter in two points, the O1 operator site is the main one and is placed between the promoter and the beginning of LacZ. The other two sequences that LacI can bind in addition to O1 are O2 and O3, they can be found in positions +400 and -80 with respect to the beginning of translation. When the Lac repressor binds two operators sites at the same time, it causes the DNA to form a loop that makes the promoter virtually unaccessible by the RNA polymerase. The availability of lactose in the environment causes the removal of this block. The few molecules of sugar that cross the cell membrane are degraded by the small number of enzymes produced despite the repression. A side product of the metabolism of lactose, allolactose, binds to LacI, modifying its structure and making it unable to continue its repressive action. Another level of regulation of the lac operon is realized by the cAMP-CRP protein complex, the production of cAMP is catalyzed by the absence of glucose in the environment. This molecule activates the CRP protein, that is able to bind a specific site upstream of the pLac promoter and increases the affinity of the RNA polymerase for this element [13].
When only one operator site is present, like in many synthetic applica-tions, LacI still manages to repress transcription, despite less tightly than when all the operator sites are in the right place. LacI is easily inducible with Isopropyl β-D-1-thiogalactopyranoside (IPTG), an analog of allolactose that cannot be metabolized.
LuxI and LuxR
LuxI and LuxR are part of the luciferase enzyme complex. This system, initially identified in the marine bacteria Vibrio fischeri, controls the quorum sensing regulated luminescence production. These bacteria can establish a symbiotic relation with some marine animals that exploit the light produced by them to hunt at night or hide from predators. The light production is triggered by the increase of the cell concentration over a certain threshold that is not achievable when the bacteria are free in the ocean.
The natural luciferase enzyme complex is composed of many genes [14] • luxI is the enzyme that produces acyl homoserine lactone (AHL), a
signaling molecule (Figure 2.4), it is constitutively transcribed;
• luxR is the signal receptor, it resides in the cytoplasm and is produced continuously in Vibrio fischeri;
• luxC, luxD and luxE code for components of acid reductase that con-verts the long-chain fatty acid tetradecanoic acid into fatty-aldehyde substrate (tetradecanal) for the light-producing enzyme luciferase; • luxA, luxB encode the α and β subunits of luciferase enzyme; • luxG has still a non-identified function.
LuxI produces the AHL signal at a low rate starting from S-adenosylmethionine (SAM) and an acylated acyl carrier protein (ACP) from the fatty acid biosyn-thesis pathway. Apparently, the fatty acid substrate for LuxI is acquired from the pool of acyl-ACPs generated during fatty acid biosynthesis rather than from products of fatty acid degradation. This would allow for a continuous supply of the fatty acid substrate regardless of the growth conditions [15].
All the genes of this system, except LuxI and LuxR, are part of an operon regulated by the protein LuxR activated by AHL.
The signal produced by the cells diffuses across their membranes and accumulates in the environment. AHL binds to the LuxR protein. The consequent conformational change seems to cause the complex LuxR-AHL to dimerize. The dimer activates the genes responsible for the production of luminous signal.
Parts of this system have been imported in E. coli and conveniently pro-vide a means of intercellular communication.
TetR
TetR is a dimer that is part of the most abundant resistance mechanism against the antibiotic tetracycline in gram-negative bacteria [16]. In Nature, this protein binds to the operator sites TetO1 and TetO2 and represses its own production and that of TetA, a protein that is responsible for the export of the magnesium complex. The presence of the tetracycline-magnesium complex in the environment inactivates TetR, thus the exporter is produced and the intracellular concentration of antibiotic diminishes.
Since TetR is easily induced with anhydrotetracycline (ATc), a tetracy-cline analog, it is often employed in synthetic genetic circuits.
Chapter 3
Mathematical Model
The classical modeling strategy in biology and engineering makes use of or-dinary differential equations (ODE). Starting from a structural model of the interactions, like the one described in the previous chapter, it is possible to map the reaction network into a system of coupled ODEs. These equations can then be solved numerically in order to track the effects over time of the simultaneously occurring reactions [17].
3.1
Input functions
Most of the information used to construct the models of the various input functions comes from [18].
3.1.1
Promoter regulated by a repressor
As previously stated, a repressor is a protein that, upon interaction with DNA at a promoter site, decreases the probability of transcription of the downstream genes.
Considering a repressor R that binds to a promoter P, the resulting com-plex is R-P. If multiple repressors are needed in order to achieve repression, it is possible to consider the simultaneous binding of more repressor molecules with the parameter n. The RNA polymerase manages to transcribe the coding sequences downstream the promoter only when the repressor is not bound.
The binding of the transcription factor to the promoter can be described by mass-action kinetics:
d[nR − P ]
dt = k1· [R]
n· [P ] − k
Considering the equation at steady state: 0 = k1· [R]n· [P ] − k−1· [nR − P ] (3.2) k−1 k1 · [nR − P ] = [R]n· [P ] (3.3) kdn· [nR − P ] = [R]n· [P ] (3.4)
Where the dissociation constant kdn [M] has been introduced. The lower kd,
the higher the strength of interaction between the transcription factor and the promoter.
It is now possible to write an equation that expresses the conservation of DNA binding sites P:
[P ] + [nR − P ] = [Ptot] (3.5)
Where [Ptot] is the total concentration of DNA binding sites in the cell.
Combining (3.4) with (3.5) it is now easy to express the fraction of free promoter sites as an Hill function:
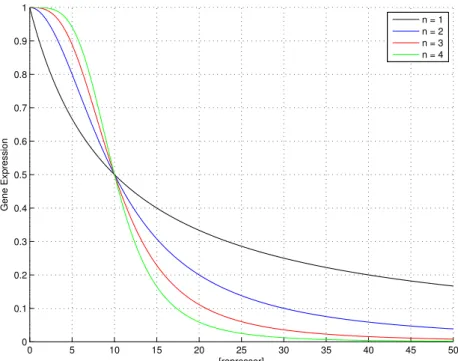
[P ] [Ptot] = kd n kdn+ [R]n = 1 1 + [R]k n dn (3.6) Figure 3.1 shows the monotonically decreasing input function of a pro-moter regulated by a repressor for different Hill coefficients n.
When the concentration of repressor equals the dissociation constant, half of the promoters are inactivated. As the Hill coefficient rises, the function tends to approximate a step and the slope of the region where the
0 5 10 15 20 25 30 35 40 45 50 0 0.1 0.2 0.3 0.4 0.5 0.6 0.7 0.8 0.9 1 [repressor] Gene Expression n = 1 n = 2 n = 3 n = 4
Figure 3.1: Input function of a gene regulated by a repressor with kd = 10
3.1.2
Promoter regulated by an activator
If a transcriptional activator A is considered, it is possible to describe the fraction of bound promoter sites as:
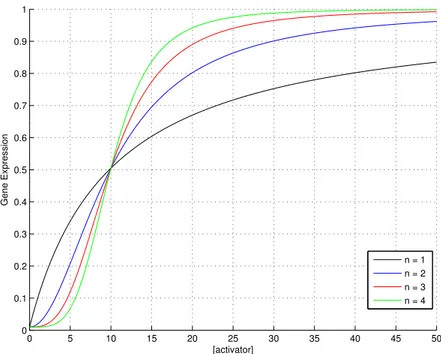
[P ] [Ptot] = 1 − kd n kdn+ [A]n = kd n + [A]n− kdn kdn+ [A]n = [A] n kdn+ [A]n (3.7) Figure 3.2 shows the monotonically increasing input function of a pro-moter regulated by an activator for different Hill coefficients n. Even in this case half of the promoters are inactivated (and half activated) in presence of
a concentration of transcription factor that equals kd.
3.1.3
Binding of an inducer to a transcription factor
Some transcription factors, TF, can bind small molecules named inducers, I, that alter their affinity for the DNA binding site. It is possible to describe this condition with mass-action kinetics:
d[T F − I]
0 5 10 15 20 25 30 35 40 45 50 0 0.1 0.2 0.3 0.4 0.5 0.6 0.7 0.8 0.9 1 [activator] Gene Expression n = 1 n = 2 n = 3 n = 4
With the conservation equations:
[T F ]tot = [T F ] + [T F − I] (3.9)
[I]tot = [I] + [T F − I] (3.10)
At steady state equation (3.8) becomes:
0 = k1· [T F ] · [I] − k−1· [T F − I] (3.11)
k−1
k1
· [T F − I] = [T F ] · [I] (3.12)
ks· [T F − I] = [T F ] · [I] (3.13)
Combining (3.13) with the two conservation equations (3.9) and (3.10) we get:
ks· [T F − I] = ([T Ftot] − [T F − I]) · ([Itot] − [T F − I]) (3.14)
ks· [T F − I] = [T Ftot] · [Itot] − [T Ftot] · [T F − I] − [T F − I] · [Itot] + [T F − I]2
(3.15) Reordering leads to
[T F − I]2− [T F − I] · (ks+ [T Ftot] + [Itot]) + [T Ftot] · [Itot] = 0 (3.16)
Solving the second order equation and discarding the solution that is not physically grounded, we get:
[T F −I] = (ks+ [T Ftot] + [Itot]) −p(ks+ [T Ftot] + [Itot])
2− 4 · [T F
tot] · [Itot]
2
(3.17) Equation (3.17) gives the concentration of the complex.
3.1.4
Hybrid promoter regulated by a repressor and
an activator
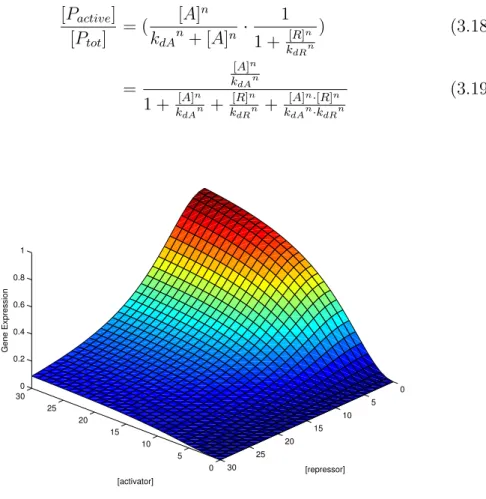
An hybrid promoter is a promoter that can bind different transcription fac-tors. Let’s consider the case of a promoter regulated by an activator and a repressor. By multiplying the fraction of operator sites that don’t bind the
repressor with the fraction of operator sites that bind the activator we get equation (3.19), that constitutes a three-dimensional input function for the promoter (Figure 3.3). [Pactive] [Ptot] = ( [A] n kdAn+ [A]n · 1 1 + k[R]n dRn ) (3.18) = [A]n kdAn 1 + k[A]n dAn + [R]n kdRn + [A]n·[R]n kdAn·kdRn (3.19) 0 5 10 15 20 25 30 0 5 10 15 20 25 30 0 0.2 0.4 0.6 0.8 1 [repressor] [activator] Gene Expression
Figure 3.3: Input function of an hybrid promoter with kdA = kdR = 10 and
n = 2
The hybrid promoter input function shows that gene expression is high only when there is no repressor and a lot of activator. As with the previous two-dimensional hill functions, it can be shown that the behavior becomes more switch-like when n increases.
3.2
Enzyme Kinetics
Let’s consider the case of an enzyme E that needs two different substrates
enzyme first binds one of the two substrates and forms a complex, C1 (3.20).
This complex is now able to bind a second substrate to form the complex C2.
At this point, the enzyme catalyzes the reaction between the two substrates and a molecule of the product is produced (3.21).
E + S1 kk1−1 C1 (3.20)
C1+ S2 kk2−2 C2 →k3 P + E (3.21)
The differential equations that describe this process are (3.22) to (3.27)
dE dt = k3· C2+ k−1· C1 − k1· E · S1 (3.22) dS1 dt = k−1· C1− k1· E · S1 (3.23) dS2 dt = k−2· C2− k2· C1· S2 (3.24) dC1 dt = k1· E · S1+ k−2· C2− k−1· C1− k2· C1· S2 (3.25) dC2 dt = k2· C1· S2− (k−2+ k3) · C2 (3.26) dP dt = k3· C2 (3.27)
With the conservation equations (3.28), (3.29) and (3.30).
E = E0− C1− C2 (3.28)
S1 = S10 − C1− C2− P (3.29)
S2 = S20 − C2− P (3.30)
Where E0, S10 and S20 are the total concentrations of enzyme, first
sub-strate and second subsub-strate, respectively.
If the enzyme has a low turnover like LuxI [15], it is possible to consider (3.23) and (3.24) at steady state. In this condition it can be shown that (3.27) reduces to (3.31) and the production of P is proportional to the amount of enzyme.
dP
dt = K · E0 (3.31)
3.3
Model of the Leader Election Circuit
The model is at a medium level of abstraction, transcription and translation are considered in a single step. The transcription and translation rate at a given time depends on the concentration of active transcription factor that is present inside the cell.3.3.1
Assumptions
A number of assumptions were made in order to simplify the model and reduce simulation time:
• a saturating concentration of arabinose is present at all times, so that all AraC molecules inside the cell are bound with arabinose and thus act as transcriptional activators;
• the basal expression rate of hybrid promoters and promoters regulated by an activator only is very low;
• both the substrates that LuxI needs to produce AHL are present in saturating concentrations;
• given the high diffusion constant of AHL of about 5.5 · 10−6[cm2
s ] [19],
the small simulation volume of 160 · 103µm3, and the fact that AHL
can freely diffuse across cell membranes [20], the concentration of AHL is considered uniform;
• interactions between transcription factors and inducers or between tran-scription factors and DNA are at steady state.
3.3.2
Terms of the model
It is possible to separate the contribution of three different components when the variation of the concentration of a protein in time is considered (3.32).
d[P ]
dt = BE + P R − DGR (3.32)
Where [P] indicates protein concentration, BE stands for basal expression, PR is the production term and finally DGR takes into account protein degradation. In the following, the basal expression of the coin flipper module will be termed leakiness and the basal expression of all the other promoters leakiness2.
In this model, production terms depend on the promoter input function. Since for each operator site used in the circuit at least a dimer of the cor-responding transcription factor is needed to achieve activation or repression, the Hill coefficients are set to 2. The various terms for each module of the circuit are detailed in the following.
Coin flipper production term
The coin flipper module is composed of an hybrid promoter that drives the expression of two genes in an operon. The hybrid promoter contains operator sites that can bind two different transcription factors: AraC and TetR. When the sugar arabinose is present in the environment, AraC acts as a transcrip-tional activator. TetR, instead, always acts as a transcriptranscrip-tional repressor.
The first gene of the operon encodes for AraC, while second one is a coding sequence for the transcription factor LacI.
P R = βAraC · ( [AraC] KdAraC) 2 1 + (Kd[AraC] AraC) 2+ ( [T etR] KdT etR) 2+ ( [AraC]·[T etR] KdAraC·KdT etR) 2 (3.33)
Where βAraC is a factor that defines the maximal transcription and
trans-lation rate of the genes that are under the control of this hybrid promoter when it is fully activated by AraC and not repressed by TetR.
Sender production term
The sender module consists of a promoter regulated by the activator AraC that controls the expression of a coding sequence for the enzyme LuxI. LuxI is an enzyme that converts two different substrates in a signaling molecule, AHL. P R = βLuxI· [AraC] 2 [AraC]2+ Kd2 AraC (3.34)
Where βLuxI is a factor that defines the maximal transcription and
trans-lation rate of the LuxI gene in this module when the promoter is fully acti-vated by AraC.
Receiver production term
The receiver module is composed of a promoter regulated by the repressor LacI. The gene downstream the promoter encodes for the protein LuxR, that acts as a signal receptor.
P R = βLuxR 1 + (Kd[LacI]
LacI)
2 (3.35)
Where βLuxR is the maximal transcription and translation rate of the
LuxR gene when the promoter is not repressed by LacI. Follower production term
The follower module contains another hybrid promoter that drives the ex-pression of an operon. The two genes in the operon are coding sequences for the repressor TetR and the enzyme LuxI. LuxI is present even in the follower module so that cells that activate this part of the circuit start producing signal and relay the information that somewhere a leader is already present.
P R = βT etR· (Kd[AHL−LuxR] AHL−LuxR) 2 1 + (Kd[AHL−LuxR] AHL−LuxR) 2+ ( [LacI] KdLacI) 2+ ( [AHL−LuxR]·[LacI] KdAHL−LuxR·KdLacI) 2 (3.36)
Where [AHL − LuxR] is calculated with (3.17) and βT etR is a factor
that defines the maximal transcription and translation rate of the genes that constitute the operon when the hybrid promoter is fully activated by AHL-LuxR and not repressed by LacI.
Protein degradation
The degradation terms are protein-specific and can be modeled with equa-tion (3.37) for each protein i of the circuit, when appropriate degradaequa-tion constants are considered.
DGRi = KdgrP i· [P i] (3.37)
Where Pi is the considered protein. Signal production and degradation
LuxI is an enzyme that in presence of two different substrates, SAM and hexanoyl-ACP, produces a small signaling molecule named AHL. The two substrates of the enzyme are assumed to be present in saturating concentra-tions, so that the contribution of each cell to the production term is propor-tional to the intracellular concentration of the enzyme.
d[AHL]
dt =
Nc
X
i=1
Where [LuxI]i is the concentration of enzyme in the simulation volume
due to cell i, Nc is the number of cells in the microcolony and [AHL] is the
concentration of signaling molecule in the volume of simulation.
3.3.3
Parameters
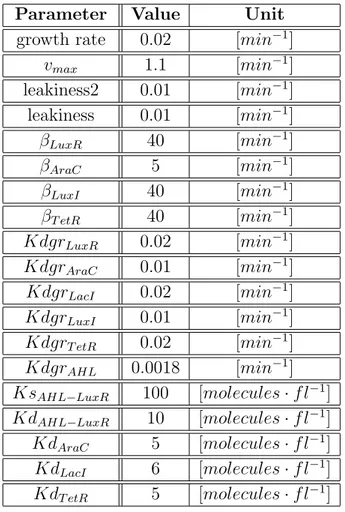
The circuit is assumed to be assembled on a low copy number plasmid, and the parameters that describe this condition are reported in Table 3.1.
Converting the concentration of the various molecules in their copy num-bers is straightforward: considering that the volume of an E. coli cell is
about 2µm3 it follows that if the cell contains only 1 molecule of a specific
substance, then its concentration is 1molecule
2µm3 = 1molecule2f l ≈ 1nM .
Parameter Value Unit
growth rate 0.02 [min−1]
vmax 1.1 [min−1] leakiness2 0.01 [min−1] leakiness 0.01 [min−1] βLuxR 40 [min−1] βAraC 5 [min−1] βLuxI 40 [min−1] βT etR 40 [min−1] KdgrLuxR 0.02 [min−1] KdgrAraC 0.01 [min−1] KdgrLacI 0.02 [min−1] KdgrLuxI 0.01 [min−1] KdgrT etR 0.02 [min−1] KdgrAHL 0.0018 [min−1] KsAHL−LuxR 100 [molecules · f l−1] KdAHL−LuxR 10 [molecules · f l−1] KdAraC 5 [molecules · f l−1] KdLacI 6 [molecules · f l−1] KdT etR 5 [molecules · f l−1]
Table 3.1: Table of parameters
The growth rate of 0.02 corresponds to a doubling time of 50 minutes, this value is not much higher than 20 minutes, that is widely considered the
bottom limit [21]. It is possible to vary the doubling time by changing the growth medium or the temperature of the local environment.
Since the substrate of LuxI is assumed to be present in saturating concen-trations, the enzyme produces AHL at the rate of about 1.1 AHL molecule per LuxI molecule each minute [15].
The values assigned to the betas are in a realistic range according to [22], where the maximal production rate of LacI and GFP was set to about 20gene·minproteins.
βAraC has a lower value than the others because preliminary simulations
made it clear that, with the actual dissociation constants, the production of 40 proteins per minute of AraC and LacI would have biased the system toward the leader state. This low rate of protein synthesis can be achieved by tuning gene expression, for example by varying the RBS spacer sequence [8]. Even the degradation constants of AHL, LacI, LuxR-AHL and AraC were obtained from literature [23], [24], [25], while the TetR one was assumed to be in the same order of magnitude as that of the other proteins.
KsAHL−LuxR is in the same order of magnitude as in [26], moreover the
acti-vation threshold is consistent with [20]. The value for KdLacI was obtained
considering that a single operator site in the promoter can reduce the protein production about 20 fold [27], in presence of about 40 monomers of LacI [28].
In these conditions, using equation (3.6) it is possible to estimate a KdLacI
between 10−8 and 10−9. The same reasoning led to the choice of KdAraC,
because 40 monomers are enough to activate gene expression in rapidly grow-ing cells [12]. The in vivo affinity between TetR and its operator site tetO is assumed to be in the same order of magnitude of the one between LacI and
O1. That explains the similar value of KdT etR and KdLacI.
From in vitro experiments, it was shown that the binding constant between LuxR and its operator site is about twice the one between TetR and tetO [29], [30].
Chapter 4
Simulations and Results
4.1
gro environment
gro is a specification and simulation language developed by the Klavins Lab-oratory at the University of Washington. This section describes the main features of the simulation environment and its peculiar characteristics [31].
With gro, it is possible to simulate a mathematical model of a synthetic genetic circuit at different levels of abstraction in each cell, and observe the emergent behavior of the growing microcolony. gro combines a distributed systems and parallel computing approach. With gro it is possible to simulate the growth of a microcolony in a monolayer, visualize it as would be viewed with a fluorescence microscope (Figure 4.1) and export data like the copy number of each molecule in each cell.
gro models growth, division, contact forces between cells and small molecule diffusion. Cells are assumed to be approximately cylindrical, with radius r = 0.5µm and initial length of l = 2µm. The time resolution of each sub-process of the simulation is controlled by the time step parameter dt that can be adjusted to reduce numerical errors.
The initial volume of the cell is V = πr2 · l ≈ 1.57f L and the growth of
each cell is modeled according to the differential equation dVdt = k · V where
the growth rate k can be varied. Each cell grows until it has approximately doubled in size, at which point it divides approximately in two. The mean and variance of the division size are also parameters that can be set in gro. Although the volume of the microcolony grows smoothly, the number of cells increases according to a discrete stochastic process.
The cells are constrained in a single layer so the contact forces can be modeled using a simple two-dimensional physics engine, the one that is im-plemented in gro was originally developed to simulate physics in computer
Figure 4.1: Simulation of stochastic production and degradation of red fluo-rescent protein (RFP). The cells are genetically identical but the amount of protein differs slightly between individuals, note the different red intensity
games. The effect is intended to be only qualitatively similar to the actual process.
Cell to cell communication via small molecules is simulated using the finite difference method with a 2D grid of square elements, the resolution
of which can be specified when a model is implemented. The dynamics
are simulated using Euler integration. When a new signaling molecule is declared, its diffusion and degradation rates can be specified. Cells emit, sense and absorb small molecules.
Each cell in the simulation runs a program written in the gro programming language. It is possible to specify the behavior at the most appropriate level of abstraction for the current design phase. For example, it is equally possible to specify the production of a particular molecule at a particular rate or model in detail the processes of transcription and translation.
gro is a strongly typed, interpreted programming language. To model parallelism, gro programs consist of sets of unordered guarded commands of the form g:c where g, the guard, is a boolean expression and c, the command, is a list of statements that can be either assignments or function calls. In each step of the simulation, each guard is evaluated: if it evaluates to true, then the associated command is evaluated. Each guarded command specifies a distinct process in the cell and all such processes occur effectively simultaneously. Following a standard approach in modeling parallelism, guarded commands are executed in an unspecified order despite being listed in a particular order in the code.
To model stochastic events in the cell, gro provides a special function, rate(), that takes one argument and returns true or false randomly. In par-ticular, rate(r) returns true upon a given evaluation with probability r · dt and false the rest of the time, where dt is the simulation time step. The rate function allows gro to approximate the Master Equation with Euler integration.
4.2
Sensitivity Analysis
To take into account the stochasticity of gene expression, the differential equations that constitute the mathematical model of the Leader Election circuit, described in the previous chapter, were approximated by using the rate() function of the gro language.
Starting from a condition in which the parameters of the model have their nominal value, reported in Table 3.1, a sensitivity analysis by varying one factor at a time around that central point in the parameters’ space was performed.
![Figure 1.1: Nucleotides [1]](https://thumb-eu.123doks.com/thumbv2/123dokorg/7472639.102512/12.892.162.736.760.981/figure-nucleotides.webp)
![Figure 1.2: DNA chemical structure [2]](https://thumb-eu.123doks.com/thumbv2/123dokorg/7472639.102512/14.892.221.666.332.868/figure-dna-chemical-structure.webp)
![Figure 1.3: Scanning electron micrograph of Escherichia coli [3]](https://thumb-eu.123doks.com/thumbv2/123dokorg/7472639.102512/18.892.241.651.550.896/figure-scanning-electron-micrograph-of-escherichia-coli.webp)
![Figure 2.2: Proposed genetic circuit of the Leader Election project [4]](https://thumb-eu.123doks.com/thumbv2/123dokorg/7472639.102512/25.892.160.734.378.666/figure-proposed-genetic-circuit-leader-election-project.webp)