ANALYSIS OF ALTERNATIVE PROPOSALS TO REFORM THE SPANISH
INTERGOVERNMENTAL TRANSFER SYSTEM FOR MUNICIPALITIES
Francisco Pedraja Chaparro, José Manuel Cordero Ferrera
Document de treball de l’IEB
2011/33
Documents de Treball de l’IEB 2011/33
ANALYSIS OF ALTERNATIVE PROPOSALS TO REFORM THE SPANISH INTERGOVERNMENTAL TRANSFER SYSTEM FOR MUNICIPALITIES
Francisco Pedraja Chaparro, José Manuel Cordero Ferrera
The IEB research program in Fiscal Federalism aims at promoting research in the public finance issues that arise in decentralized countries. Special emphasis is put on applied research and on work that tries to shed light on policy-design issues. Research that is particularly policy-relevant from a Spanish perspective is given special consideration. Disseminating research findings to a broader audience is also an aim of the program. The program enjoys the support from the IEB-Foundation and the IEB-UB Chair in Fiscal Federalism funded by Fundación ICO, Instituto de Estudios Fiscales and Institut d’Estudis Autonòmics.
The Barcelona Institute of Economics (IEB) is a research centre at the University of Barcelona which specializes in the field of applied economics. Through the IEB-Foundation, several private institutions (Caixa Catalunya, Abertis, La Caixa, Gas Natural and Applus) support several research programs.
Postal Address:
Institut d’Economia de Barcelona Facultat d’Economia i Empresa Universitat de Barcelona
C/ Tinent Coronel Valenzuela, 1-11 (08034) Barcelona, Spain
Tel.: + 34 93 403 46 46 Fax: + 34 93 403 98 32 [email protected]
http://www.ieb.ub.edu
The IEB working papers represent ongoing research that is circulated to encourage discussion and has not undergone a peer review process. Any opinions expressed here are those of the author(s) and not those of IEB.
Documents de Treball de l’IEB 2011/33
ANALYSIS OF ALTERNATIVE PROPOSALS TO REFORM THE SPANISH INTERGOVERNMENTAL
TRANSFER SYSTEM FOR MUNICIPALITIES
Francisco Pedraja Chaparro, José Manuel Cordero Ferrera
ABSTRACT: This paper offers an evaluation about the current design of the unconditional transfer system to the municipalities in Spain taking as a reference the precepts of fiscal federalism theory. The analysis carried out is based on the released results of the model during the period from 2004-2009, in which two different stages can be identified within the economic cycle; an expansive one up until 2007 and a recession period after that year. These data highlight that the design of the model along with the application of certain funding guarantees, have caused a disconnection between the evolution of the resources and the variables representative of need and capacity. Faced with this scenario, different reform alternatives are proposed with the aim of reconnecting the resources with these indicators. The potential impact of those proposals is evaluated using a simulation exercise in which the basic rule of status quo is assumed, i.e., that no municipality loses funding as a consequence of the new system.
JEL Codes: H70, H77
Keywords: Fiscal federalism, intergovernmental transfers, municipalities
Francisco Pedraja Chaparro Department of Economics University of Extremadura Elvas s/n. Avenue
06071 Badajoz (Spain) E-mail: [email protected]
José Manuel Cordero Ferrera Department of Economics University of Extremadura Elvas s/n. Avenue
06071 Badajoz (Spain) E-mail: [email protected]
1. INTRODUCTION
The objective of this paper is to analyze and make alternative proposals to the current system of general transfers to the municipalities in Spain, known as Municipal Revenue Sharing (Participación en los Ingresos del Estado –PIE-). These grants represent approximately two thirds of current municipal transfers which in turn represent one third of their revenues, with the rest of the current transfers coming from the Autonomous Communities (AC), although these are mainly conditional.
The scant importance of the contribution of the ACs to the ordinary municipal funding makes it difficult to appreciate the considerable differences that exist between ACs in different regimes (common or charter). While in the first case the transfers from the ACs to the municipal Treasury has had an almost marginal importance, in the charter regions (Basque Country and Navarre), the regional level assumes the main proportion of the unconditional grants to the municipalities. In turn, municipalities in the Canary Islands also receive more resources from a regional fund financed mostly by income obtained in virtue of its special economic-financial regime. These peculiarities lead to some significant inequalities in the per capita funding received by local governments1.
The current system of general transfers to the municipalities was established in the Law 51/2002, although its enforcement came into effect in 2004. The system, in a clear parallelism with that of the ACs, was born with a permanent disposition eliminating the traditional five-yearly revision process. However, the regional government regime was modified in 2009, while the local system maintains the same regulation, in spite of the significant change of the economic cycle.
This paper is organized as follows. First, we present the structural elements that should characterize an appropriate system of transfers according to the theoretical-normative principles. Subsequently, using a historical perspective, we describe the structure of the current model of general transfers to the Spanish municipalities and provide an evaluation of the system with particular emphasis in its main deficiencies. Finally, we
1
In this sense, if the average of per capita current transfers for all the municipalities was 100 in 2007, those belonging to the charter regime reached a value of 203, the canary ones 139 and the remaining municipalities in the general model only 93.
propose various alternatives for a possible reform and assess their potential effects using a simulation exercise.
2. THE STRUCTURAL ELEMENTS OF A GENERAL TRANSFERS SYSTEM TO THE MUNICIPALITIES
The economic literature justifies the existence of general transfers fundamentally, although not exclusively, for equity reasons. They are usually used to redress vertical and horizontal fiscal imbalances (equity among units in different levels of government and those in the same level such as the municipalities in our case) (Buchanan, 1950; Oates, 1972; Gramlich, 1977). According to these objectives, we can summarize the main structural elements of an appropriate system of unconditioned transfers in some lines that can serve us as a guide in the analysis and evaluation of the Spanish municipal transfers system (Boadway and Shah, 2007):
a) Related to the objective of vertical balance is the determination of the amount of the transfer and its evolution and revision period with the aim of designing a stable and flexible system.
The vertical imbalance arises from the existing differences between the spending needs derived from the responsibilities assumed by the sub-central governments and their own revenues, which are usually insufficient compared to the situation of the central government. The importance of this imbalance is a result of two opposing forces. On the one hand, the relative ease to decentralize services to the lower levels of government; on the other, the evident difficulty to decentralize revenues to small units of government fulfilling the demanding principles of tax assignment. This tension and consequent imbalance could become accentuated in the future due to the foreseeable loss of importance of the local resources motivated by recent economic changes2.
From a theoretical viewpoint, the total amount of the general grants should guarantee similar coverage levels in the provision of services in every jurisdiction given a certain
2
Among those changes we can mention the increasing importance of intangible assets in the generation of output, the development of e-commerce or the increase of competition between jurisdictions (Tannenwald, 2002).
tax effort (Broadway, 2001). The difficulty of calculating this value appropriately makes it advisable for it to be the result of a political negotiation between those responsible of both levels of government. In the case that the option chosen to restore the vertical balance is a transfer, it should be unconditional so that the municipalities can freely spend it according to their needs (expenditure autonomy).
Although the vertical balance between the central and municipal government can be reached thanks to the general transfer, it is highly probable that new imbalances may arise in the future. The reason for this may be the different expected evolution of the expenditure needs and the fiscal capacities in each of the levels of government. The lesser flexibility of the tax revenues of the sub-central governments and the greater elasticity of their expenditures with regards to the central government will end up breaking up the initial financial balance. Its maintenance thus requires the existence of certain commitments about the evolution of the main elements and review period.
Regardless of the vertical imbalance, the neutralization using transfers must be flexible and stable according to the comparative experience. Once the amount has been determined, the first objective can be reached by associating the grant to a particular index of evolution representing (directly or indirectly) the resources of the central government, while the second one requires a review of the system every few years. In the case of opting for a direct participation in the resources, that it should entail a wide range of income would be the preferred option, not only because the evolution of the transfer would be less variable but also to avoid possible strategic behaviors by the central government.
b) In terms of the horizontal balance, the desirable transparency requires the existence of a simple formula, whose design could have an equalization purpose or simply distributive depending on the objectives established by the government.
Given that expenditure needs and fiscal capacities are not uniformly distributed among the municipalities, similar individuals can enjoy different public services (in terms of quantity or quality) depending on their place of residence (horizontal inequity). Consequently, disparities in expenditure needs and/or fiscal capacities among units
belonging to the same level of government (municipalities) are the cause or reason of horizontal imbalances.
The transfers should be distributed among the municipalities following a simple formula, thus guaranteeing, not only the transparency of the system but rather ensuring that those revenues are stable, so that the municipalities can take them into account to calculate their budgeting correctly. The formula can have an equalization design in order to eliminate differences between the municipal fiscal capacities and allowing them to cover their expenditure needs in equivalent proportions, if they apply similar tax efforts. Another option is a distributive formula with multiple factors which only aims to improve the municipal sufficiency without a balancing objective.
The design of the transfer depends on the sort of services provided. In this sense, equalization transfers seem to be more suitable for decentralized governments that assume responsibilities on the main social services of the Welfare State such as health or education, while its implementation for municipalities offering essentially a range of basic services is difficult to support. Therefore, we will focus on the analysis of distributive formulas that have also been the traditional option used in the Spanish municipal transfer system.
These models, also known as variables-based or multiple factor formulas, only intend to improve the sufficiency through an accepted distribution of the general transfer among the various municipalities. The first stage consists in dividing the general transfer in parts and distributing them according to various indicators comprised between zero and one, so that their sum is equal to one. Subsequently, each of those parts is distributed based on a series of indicators representative of expenditure needs and fiscal capacities3. Logically, given that the formula is additive, the capacity indicator is included by its inverse, so the lower the relative fiscal capacity of the municipality, the higher the transfer assigned.
The variables included and their weights are usually determined by political decisions whose suitability may depend on the degree of acceptance of the results by the parties
involved. Analytically, if we consider that Q is the amount of the unconditioned transfer and Si the corresponding grant assigned to the municipality i, the distributive formula of
multiple factors would have the following expression:
IIC
b
IN
a
Q
=
+
(1)∑
=
S
iQ
a+b = 1Q
IIC
b
IN
a
S
i=
(
i+
i)
where IN and IIC are indexes which respectively reflect the expenditure needs and the fiscal capacity (inverse).
c) Distribution criteria. Regardless of the formula selected to distribute the resources among the municipalities, its success depends on the correct selection and quantification of the factors representing expenditure needs and fiscal capacities.
The expenditure needs depend on the range of services provided, so they can vary across municipalities due to different provision costs or because the units of service required can also be different4. The simplest option would be considering the total population as an indicator of needs, although its demographic composition can also be used. The argument normally used to sustain this choice is that the younger population usually demands more educational services, while the demand of health and social services grows when the proportion of elder population is higher. However, in our case the utilization of the total population seems to be the most appropriate option given that municipalities do not provide those services. Furthermore, this value is easy to calculate and difficult to manipulate.
Another relevant aspect with regards to the determination of the needs deals with the costs of provision, which can be much greater in some municipalities than in others due to differences in their geographic and climate conditions and even due to an unequal impact of certain factors such as poverty and unemployment (Boex and Martinez-Vasquez, 2007). Actually, there are multiple blocks of municipalities demanding for increased grants to offset those differences (e.g. those located in rural areas with
difficult access or the tourist ones). However, the possibility of further refining these elements of cost per unit of service or adjusting the criteria according to differentiated demands seems to be more appropriate in a regional context where the geographic characteristics are similar and therefore disparities among local governments´ provision costs are less significant. Indeed some of these indicators have been included in some of the regional transfer schemes designed by some CAs to provide their municipalities with additional resources with the aim of improving their levels of sufficiency. In any case, we should not neglect the efficiency problems that can arise when these factors of differentiated costs are used in a distributive formula (Broadway, 2004 and Borge, 2011).
The fiscal capacity represents the revenues that the municipalities can obtain from their tax bases. Its calculation is not simple, although this definition makes clear that revenues should not embody capacity. Rejecting the previous identification, the most common options are either the use of (indirect) macroeconomic indicators or more or less representative of the tax system at the local level (Shah, 2008). The first option entails difficulties both theoretical and in practice because these data are not often available at this level and its accuracy may be questionable. The other alternative seems more reasonable, since it measures the fiscal capacity by the revenue that could be raised if the local governments apply a standard (or average) rate to the fiscal bases of their taxes. In this case, the relative importance that each tax has in the total collection of the group of municipalities should be used as weights to obtain the indicator of capacity instead of using the weights of each particular municipality thus avoiding the indicator from being manipulated.
d) Finally, as a general recommendation, the basic decisions regarding these structural elements should be excluded from the behavior of the units delivering and receiving the transfers.
3. THE SPANISH GENERAL TRANSFER SYSTEM FOR MUNICIPALITIES
3.1. Background and current model
The current PIE regulation, in effect since 2004, came into effect with the approval of Law Decree 51/2002 which significantly modified the previous system of general transfers to Local Authorities.
The previous model (1999 – 2003) consisted in an unconditional transfer whose amount was revised every five years and which evolved during that period according to the nominal Gross Domestic Product (GDP) with a minimum guarantee of growth equivalent to the Consumer Price Index (CPI). Asides from some specific cases (Madrid, Barcelona and basically their respective Metropolitan Areas), the total transfer was distributed based on several factors. The main part is assigned to the weighted population with increasing coefficients according to municipal size (75%)5. Besides another factor of need (school units) whose weight in the distribution was reduced (2.5%), the rest of the transfer was distributed according to fiscal capacity (8.5%) and fiscal effort (14%), although both of them were incorrectly calculated.
This model had some funding guarantees that, along with the attention to specific situations, limited the effectiveness of the distribution formula: a general guarantee so that no municipality could see their transfer reduced with the revision of the system (statu quo rule) and another specific one for municipalities with less than 5,000 inhabitants, which were guaranteed a minimum transfer per capita.
The current model of transfers establishes a “dual” system different based on (basically) municipal size. In the case of municipalities with a registered population equal to or greater than 75,000 inhabitants (and some with lower population but which are capitals of provinces or Autonomous Communities), the general transfer assigned to each of them in the base year (2004) splits into two components: a group of territorialized tax shares in different state taxes and the so-called Complementary Financing Fund (CFF)
5
The municipalities with a population greater tan 500,000 inhabitants were weighted with a coefficient of 2.8, those with more tan 100,000 inhabitants with a 1.47, those with more than 50,000 with a 1.32, those with more than 20,000 with a 1.30, those with more than 10,000 with a 1.17, those with more than 5,000 with a 1.15 and those with a lower population with a coefficient of 1.
(Cession Model). On the other hand, the distribution formula is maintained for the rest of the municipalities with some changes (Variables Model).
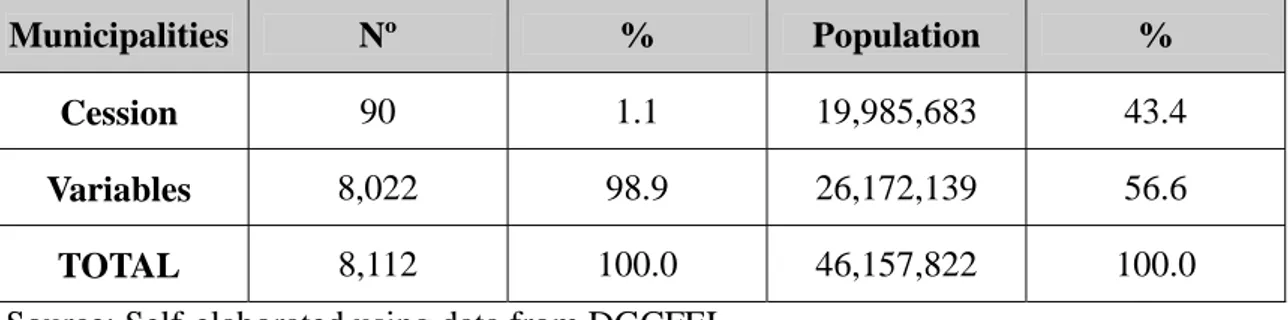
The application of one or other system for each municipality is revised every four years taking into account its population. The first revision came into effect in 2008 which made six municipalities which belonged to the variables model to pass to the cession model. Tables 1 and 2 report the distribution per municipalities and population between both models for the base year (2004) and 2008. It is worth noting that the cession model affects only 1% of municipalities, although its impact in terms of population is more balanced reaching 43.4% in both years.
Table 1. Distribution of municipalities between models (2004)
Municipalities Nº % Population %
Cession 84 1.0 18,750,367 43.4
Variables 8,025 99.0 24,447,317 56.6
TOTAL 8,109 100.0 43,197,684 100.0
Source: Self-elaborated using data from the General Directorate of Financial Coordination with Local Governments – Dirección General de Coordinación Financiera con las Entidades Locales – (DGCFEL).
Table 2. Distribution of municipalities between models (2008)
Municipalities Nº % Population %
Cession 90 1.1 19,985,683 43.4
Variables 8,022 98.9 26,172,139 56.6
TOTAL 8,112 100.0 46,157,822 100.0
Source: Self-elaborated using data from DGCFEL
Municipalities with the greatest size received, in the base year (2004), a transfer equal to the result of updating the amount received in the last year of the previous five-year period (2003), according to the evolution rate of the central state revenues (ITE for its Spanish initials; Índice de Ingresos Tributarios del Estado), excluding those assigned to the ACs such as Personal Income Tax (IRPF for its Spanish initials – Impuesto sobre la Renta de las Personas Físicas), VAT (IVA for its Spanish initials – Impuesto al Valor
Agregado) and excise taxes (Impuestos sobre Consumos Específicos). The calculation of this evolution rate (ITE), according to the dispositions established in the Law Decree 21/2001, follows a cash-basis criterion, which regulates the AC’s funding system. This criterion implies that the revenues corresponding to the central government are calculated as the difference between the total amount of revenues collected in the country and the sum of deposits made in favor of the Autonomous Communities6 and the final settlements corresponding to the two previous years7.
The transfer for the base year is divided into two parts, territorial tax shares and the Complementary Financing Fund (CFF). The first consists of fixed percentages in the unassigned yields to the ACs of several state taxes: Personal Income Tax (1.6875%), VAT (1.7897%) and excise taxes (2.0454%). In the Personal Income Tax, the assignment of the municipal collection is obtained directly from the taxes paid by the residents living in the municipality. However, in the case of indirect taxes (VAT and excise) the assignment follows a very indirect process; first, based on the importance of consumption of the autonomous community to which the municipality belongs to in the national consumption and, second, according to the registered population of the municipality in the region. The second element, the CFF, acts as an adjustment mechanism, since the amount for each municipality in the base year (2004) is calculated as a difference between the general grant for that year and the result obtained from the territorial tax shares.
Table 3 shows the relative importance of the general transfer components in the cession model in 2004. It can be noted that the CFF accounts for almost 85% of the total resources (on average) while the remaining 15% accounts to the set of shared taxes among which we can highlight the Personal Income Tax with a little more than 7% of the total. Even more relevant still are the extreme cases, which these average results hide, due to its possible effects in dynamic terms. Hence, the CFF represent 95% of the total resources in some municipalities (e.g. Telde) where, due to the special regime of the Canary Islands, indirect taxes do not exist. In contrast, the shared taxes reach their
6 This amount is based on the budget revenue forecasts according to the evolution of the previous years. 7
This two year delay corresponds to the time necessary to be able to determine the final settlement of various tax figures, specially the Personal Income Tax.
maximum in the third part of the transfer represented mainly by the Personal Income Tax (Alcobendas).
Table 3. Relative weight of different components in the cession model (2004)
Mean Max Min
Personal Income Tax (IRPF) 7.35% 20% 4%
VAT 5.9% 16% 0%
Excise taxes 2.1% 4,5% 0%
Tax Shares 15.3% 33% 5%
Complementary Financing Fund (CFF) 84.6% 95% 67%
Total 100.0%
Source: Self-elaborated using data from DGCFEL
In dynamic terms, the CFF evolves according to ITE, while the territorial tax shares depend on the own collection of revenues in each municipality (Personal Income Tax) or the evolution of state revenues (VAT and excise taxes). Likewise, for the latter, the evolution may also depend on the greater dynamism of consumption of the Autonomous Community to which the municipality belongs with regards to the national average and the municipal population with regards to that of its Autonomous Community.
For most municipalities, those with a population of less than 75,000 inhabitants (which are not capitals of province or AC), the distribution formula has been maintained, although some significant changes were introduced. The total amount of the transfer is increased according to the growth of ITE, the minimum funding is eliminated for municipalities with a population of less than 5,000 inhabitants, although the statu quo clause was kept, so the amount received by each municipality in the last year of the previous five-year period (2003) is guaranteed.
The calculation of the transfer in the base year (2004) was different for municipalities belonging to different models. Those included in the cession model increased their specific transfer according to ITE2004/2003 (3.39%). In contrast, in the variables model the
2003 overall transfer evolves in proportion to ITE to obtain the amount corresponding to 2004, which later is distributed among municipalities, taking into account the amount
guaranteed for each of them (the total amount obtained in 2003). In fact, this guarantee has had considerable impact in the results of the model as we will discuss later in the text.
Once the overall transfer for each year is established, it is divided in blocks, which are distributed based on a series of variables, which try to gather the municipal differences, in terms of spending needs, fiscal capacity and tax effort.
The population retains its weight in the general transfer (75%) and remains as the only variable representing spending needs. The weights assigned to population are adjusted according to what the regulation requires for additional services8. The so-called tax capacity increases its weight until it equals tax effort (with a 12.5%). Surprisingly, these variables were not defined in the original regulation (Law Decree 51/2002), although they did in various subsequent Budget Laws. The tax capacity is calculated using the tax base of the Property Tax (IBI for its Spanish Initials – Impuesto a los Bienes Inmuebles) as a reference, while the tax effort retains its definition as a ration between the real and potential revenue collection and refers only to the three existing compulsory taxes for local governments (Property, Economic Activity and Vehicles).
Besides these two systems, there is also a mixed model for the so-called “Tourist Municipalities”, those with a population greater than 20,000 inhabitants and whose number of holiday homes exceeds the number of regular housing9. For these municipalities the total amount to be received is divided into two components: a tax share of 2.0454% from the revenues collected (and not assigned to ACs) from taxes on Hydrocarbons and Tobacco Labors, which is distributed according to the same criterion explained for indirect taxes in the cession model and a transfer, which is obtained subtracting the previous quantity to the amount they would be entitled to receive, according to the formula applicable to the municipalities of the variables model, for whose determination, the statu quo guarantee is also taken into account.
8
Municipalities with a population between 50,000 and 75,000 inhabitants are weighted with a coefficient of 1.4, those between 20,000 and 50,000 with a 1.3, those between 5,000 and 20,000 with a 1.17 and those with a lower population with a 1.
Finally, as an addition to the local financing system, within the transfers we can find two different compensations granted to the local governments for the loss of revenue caused by the reform of the Economic Activity Tax. The first one, regulated in the tenth additional provision of Law Decree 51/2002, recognizes this loss since the first year of application (2004) and evolves according to ITE. The second one, established in the second additional provision of Law Decree 22/2005, was incorporated into the model in 2006 and evolves in the same terms as the ITE between this fiscal year and the corresponding year.
3.2 Assessment
In the assessment of the new model, we base our arguments on two fundamental elements described in section 2: the existence of adequate connections between the transfer and factors representing expenditure needs and fiscal capacity and the updating of the transfers by means of an appropriate evolution index.
The dual model described previously does not respond in the same way to these two basic elements. While the transfer of the cession model (CFF) evolves disconnected from the evolution of municipal need and relative capacity indicators, the one corresponding to the municipalities of the variables model does distribute the resources taking into account the relative evolution of those indicators, although with certain limitations.
On the other hand, the ITE rate has experienced considerable changes since 2004, which notably affect the grants received by local governments, since this rate is used to determine the evolution of the overall transfer in the variables model and the CFF (the main part) of each municipality in the cession model. Until 2007, coinciding with the period of economic expansion, it increased significantly. Since then and until 2009, last year for which we have available data about settlements, it decreased according to the profound economic crisis in which we are still immersed. Furthermore, it should be stressed that the procedure used to calculate this rate has made the fall of resources from both systems even greater than what the real evolution of the revenues that make up its
original base reflect10. This fact, along with optimistic government forecasts in their deposits, has caused the well-known negative settlements from the municipalities for the last two fiscal years whose total accumulated debt in 2008 and 2009 amounts to 3.730 millions11.
Another element with a considerable impact in the results of both models is the existence of a funding guarantee in the variables model. In fact, this guarantee in the form of a minimum funding equal to the transfer received in 2003 exists in the case of the variables model, but it was not taken into consideration in the cession model because it was considered irrelevant. Those municipalities were very optimistic, since they assumed that the CFF would increase according to the positive evolution of ITE and that the territorial tax shares would exceed even the growth of that index such that the resources transferred to each municipality belonging to this system would exceed each year the revenues obtained in the initial year. Actually, this hypothesis was confirmed in the years of economic expansion (until 2007) but then the evolution turned out with the consequences that we will point out later.
The following is a specific assessment of each one of these systems in light of the two elements indicated, using as a reference the data from the settlements of both systems during the period from 2004 – 2009.
3.2.1 Cession model
The analysis of this model can be approached both in static as well as in dynamic terms. From a static perspective, the main problem arises in the calculation of an adequate territorial tax share of indirect taxes (VAT and excise), because it is determined by a
10
This phenomena is a result of the incorrect forecasts made by the government for the determination of the advance payments on account for the Autonomous Communities and the inability to correct them through the settlement by means of the previously mentioned application of the cash-basis, since the payments made in 2009 do not refer to this fiscal year but rather to the two previous ones, when the effects of the crisis were not yet as obvious. The direct consequence is that the proportion of resources assigned to the Autonomous Communities suffered a considerable increase between 2008 and 2009, specially in the Personal Income Tax and the VAT, therefore the part not assigned decreased and ITE fell even more than central government revenues. In fact, it can be proved that the total tax revenue prior to the payment to the Autonomous Communities and Local Governments increased between 2004 and 2009, while the ITE rate fell almost 20% between these two years.
11
These debit balances will be compensated with charges to the deposits from the next five fiscal years, according to the regulations in article 99 of Law Decree 39/2010.
combination of relative regional consumption and the relative weight of the municipal population with regards to the autonomous community. From our viewpoint, this indirect method does not provide a good proxy of the municipal consumption, thus tax shares in these taxes lose their main advantages as an indicator of commercial dynamism. On the other hand, these shares, even when they are correctly calculated as it happens with those derived from the Personal Income Tax, still have the same nature as the other component of the of the PIE (CFF), i.e., they are also transfers.
The dynamic perspective has an added interest derived from the legislator’s intention of considering the new system as permanent, eliminating the traditional five-year revision, in a clear parallelism with the funding system of Autonomous Communities12. In light of the results of the model’s settlements, during the expansion stage the system consolidated the main defects of the previous model: the incorrect design of the distribution formula established until 2003 and the maintenance of a differentiated treatment in favor of certain municipalities.
With regards to the distribution formula, the problems affect all of its components. The main drawback comes from the excessive high coefficient assigned to the municipalities located in the section of the most population (2.8) which practically doubles the weight assigned to the inhabitants of municipalities in the next section (1.47). The justification for of these differences in the coefficients derive from political reasons, since the pressure that the large municipalities exerted in the negotiating process exceed economic reasons based on economies of scale. Actually, this criterion cannot be found in other municipal transfer systems around the world and it would not even endure an internal comparison with the regional transfer model (Pedraja, 2011). On one hand, there is no legal obligation to provide more services once the 50,000 inhabitants have been exceeded and, on the other hand, previous empirical studies applied to Spanish data detected diseconomies of scale for population levels much more reduced (Solé and Bosch, 2005). From an international comparative perspective, the greater weight of an inhabitant for populations greater than 500,000 inhabitants with regards to those of the immediately previous sector rarely exceeds 10% (e.g. Germany), when in the Spanish case it reaches 90%. Even in the regional context in our country the differences in
adjusted population between the extreme values of Autonomous Communities do not reach 12% in the last funding model approved in July 2009, in spite of considering typical services of the Welfare State (health, educational or social services) different from those traditionally provided by municipalities.
Another defect in the distribution formula was the use of a capacity factor which incorrectly identified this indicator with tax revenues, which among other reasons, has caused a distribution of the transfers contrary to the prescriptions of theory13. Finally, the calculation of the tax effort also presents significant shortcomings that lead us to propose its exclusion from the distributive formula as we will explain in detail later in the text.
Several municipalities (Madrid, Barcelona, Cadiz and Santa Coloma de Gramanet) benefited from the application of a differentiated treatment in the former distribution formula14, guaranteeing them a share per capita much greater to the average15. Given that the additional funds intended for these municipalities are subtracted from the general funding, they represent a clear source of inequity, since other particular needs of multiple municipalities are not recognized in the same manner.
The disconnection between the evolution of the transfers (CFF) and the indicators representing municipal expenditure needs and fiscal capacity also affects those inequalities and may cause the appearance of new ones. Actually, even accepting that there were no inequalities in the starting situation, the maintenance of horizontal equity over time would require that the expenditure needs as well as the tax capacities of all municipalities in the system must evolve at the same rate, which at the same time should coincide with the ITE rate. This hypothesis is difficult to sustain as much for the expansion stage (until 2007) as for the recession stage (until 2009). This lack of equity,
13
In the base year, 2004, the transfer had a low correlation (0.022) with an opposite sign to that expected (positive instead of negative) with regards to an authentic capacity variable represented by the tax base of the Property Tax.
14
The first two maintain the privileges of financing outside the system in the previous financing model, while the second ones, despite having a population of less than 500,000 inhabitants, have a coefficient of 2.8 assigned to their population in the formula to compensate them for the poor growth capacity as a result of their especial orography.
15
In 2007 the average PIE per capita of the group of municipalities included in the cession model was 228 Euros, whereas Cadiz and Santa Coloma de Gramanet received almost 400 Euros, Madrid 435 and Barcelona 580.
in a dynamic sense creates increasing concern in a model which eliminated the traditional five-year revision when the legislator considered the new system as permanent.
The data shown in Table 4 provides evidence to support that the evolution experienced in both periods by expenditure needs – represented by the population – and fiscal capacities – represented by territorial tax shares or the Personal Income Tax as a more refined measure16 – reflects important differences with regards to ITE. The latter increased in 36.5% during the first stage and decreased in 41.4% from 2007 to 2009. Obviously, if we focus on specific cases these differences can be even more significant as a result of the different rates of evolution experienced by multiple transfer components in each municipality and their different relative weights.
Table 4. Evolution of population and resources in the cession model during two
different periods (2004-2007 and 2007-2009)
2004-2007 Mean Max Min
Population 3.55% 24.46% -3.52%
Personal Income Tax 39.26% 72.03% 24.95%
Shared Taxes 26.51% 42.0% 15.7%
CFF (ITE) 36.49% - -
Total resources 34.61% 37.46% 30.46%
2007-2009 Mean Max Min
Population 2.73% 17.22% -1.39%
Personal Income Tax 5.22% 18.51% 13.4%
Shared Taxes -19.67% 7.31% -34.47%
CFF (ITE) -41.37% - -
Total resources -37.56% -32.19% -40.28%
Source: Self-elaborated using data from DGCFEL.
Besides the problems mentioned above about the calculation of the ITE, it is worth mentioning those caused by the application of the new cession percentages to the Autonomous Communities (50% of the Personal Income Tax, 50% of VAT and 58% of Excise Taxes) derived from the new regional funding model applied since 2009. These changes entail the reduction in the resources received by municipalities due to the evolution of ITE and minor tax shares. In this new scenario, the modification of the tax share percentages and the method used to calculate ITE are obligatory in order to avoid potential reduction of resources derived from discretionary decisions taken by the central government. In our opinion, this situation is a consequence of an underlying problem, the predominance of the regional over the municipal level, which causes the reforms introduced in the regional funding system to be approved without considering their effects on the municipal funding.
3.2.2 Variables model
This model has experienced some noteworthy advances with regards to the situation prior to the last reform. The main one was the introduction of an authentic indicator of tax capacity, although its determination is limited to the Property Tax. Another positive point is the adjustment made on the weightings of the population in order to adapt them to the legal framework regarding services provided and population size.
The main defect remains the use of the indicator of tax effort in the distribution formula. Despite having limited its determination to the mandatory taxes, it continues to have strange values which are a result of the incorrect expression it uses in the case of the Economic Activities Tax, the absence of data about the Vehicles Tax and the use of internal weightings for the final calculation of the index, which makes it manipulable. Given the strange results produced by this indicator, the regulation establishes some specific limits regarding its amount in order to reduce the potential distortions that it can cause in the distribution of resources. Taking into account all these reasons and the discrimination that entails the application of this flawed indicator only upon the municipalities of the variables system, we consider that the best option would be to eliminate it from the distribution formula.
The shortcomings described above may be relegated to second place when we analyze the results from the last available settlement of the system for 2009, a year in which the unfavorable evolution of the ITE should have considerably reduced the transfers received by the municipalities. Nevertheless, the existence of the financial guarantee and its generalized application to all the municipalities allowed them to avoid a huge decrease of their resources. The negative differences between the amount that each municipality should receive according to the criteria of the formula and the guarantee were compensated with the positive differences registered by some municipalities (a minority) and an additional contribution from the central government close to 500 million Euros17. Indeed, the amount of the transfer received by all the municipalities included in this system in 2009 equals the amount obtained in the last year of the previous five-year period (2003).
The application of the financial guarantee is, as anticipated, an advantage with regards to the municipalities included in the cession model. In fact, among the municipalities that went from one model to the other in 2008, after the first revision of the scope of application (El Ejido, Gandia, Orihuela, Pozuelo de Alarcon, Las Rozas de Madrid y Torrent), four of them would have obtained more resources if they had continued in the variables model18.
In this sense, it is interesting to compare the percentage distribution of the transfer and its value in per capita terms among the municipalities in different models in both the base year (2004) and the final year (2009) (Table 5). These data allow us to verify that the percentage gain of the municipalities of the variables model is three points19 and the difference in PIE per capita between the cession and variables models was reduced in 70 euros going from more than 100 euros in 2004 to less than 40 euros in 2009.
17
This additional injection of resources by the State remains unnoticed because all the municipalities included in this system of variables registered a negative settlement in the 2009 fiscal year as a consequence of the previously mentioned optimistic government forecasts in the determination of the deposits.
18
The losses to these four municipalities reached a combined amount of 3.2 million Euros, while the two municipalities that obtained a greater financing with the assignment model (El Ejido y Orihuela) only increased their overall financing in 225 thousand Euros.
19
The increase would be of 4% if the six municipalities that changed system in 2008 had remained in the variables model.
We should also bear in mind that since 2007 approximately 40% of the municipalities included in the variables model receive additional resources (outside of the model), from a special financing Fund in favor of municipalities with populations no greater than 20,000 inhabitants. This fund is financed by the Ministry of Public Administration with the purpose of bringing closer the per capita funding of the municipalities with fewer resources to the average of the rest20. Obviously, the arguments that supported the creation of this Fund, whose allocation has been declining in recent years21, are difficult to maintain in light of the previously mentioned results.
Table 5. Distribution of total resources across models (2004 y 2009)
2004 2009
Municipalities
Resources % PIE pc Resources % PIE pc
Cession 4,309 € 58.7 229.80 3,642 € 55.9 180.49
Variables 3,030 € 41.3 123.96 2,870 € 44.1 143.01
TOTAL 7,339 € 100.0 6,512 € 100.0
*Values represent million of euros.
Source: Self-elaborated using data from DGCFEL
Finally, the specific treatment given to tourist municipalities, justified again more due to political than economic reasons, unnecessarily complicates a system of general transfers that should not be used to address specific situations. The current regulation makes these municipalities be favored with regards to the group to which they belong to (variables model) if the evolution rate of their territorialized tax shares (taxes on Hydrocarbons and Tobacco) is higher than the ITE rate. The amount of the gain or loss in funding thus depends on the importance of the tax shares in the initial transfer of the base year (which did not reach the 5% average) and the differences in the aforementioned rates of evolution. The data reported in Table 1 of the Annex shows that these municipalities benefited in 2009, although the gains were very small (on average they did not reach 1% of the general transfer and represent only 1.12 Euros per capita). If we consider both the problems that the practical defining of this type of municipality
20
To be able to receive this additional allocation, it is a requirement that the coefficient of the average tax effort per capita to be greater than 1.
and the problems that the calculation of the municipal tax shares entail, the maintenance of this specific system in the current conditions could be reconsidered.
4. ALTERNATIVES AND PROPOSAL TO REFORM THE MODEL
Reforming the local funding model at this time amid a profound economic crisis and given the peculiarities of the Spanish local structure, would require a broad political consensus, if we pretend for the reform to be a lasting one. The main points that should be discussed are: 1) the relative importance of the two main funding instruments (the own fiscal space and the transfers); 2) the existence or not of differentiated models (unitary, for all municipalities, or dual, distinguishing between large and small municipalities); and 3) how the financing local system fits with the existing regional model.
Concerning the first of these matters, conflicting principles and incentives need to be combined adequately, such as the development of autonomy by means of establishing their own fiscal spaces on the basis of a few easy to manage local taxes with relevant tax collection capacity and respect towards the equity that must be obtained through the application of the transfers.
With regard to the second one, given the structure of the Spanish local governments, characterized by a large number of small municipalities (85% of the total has less than 5,000 inhabitants and the median do not reach 600 inhabitants), a dual model that divides municipalities according to their population size seems convenient. Actually, some of the main drawbacks of the reforms applied to local government have been originated due to their inability to adapt the changes to a heterogeneous reality which combines large with other very small municipalities. In this sense, it seems appropriate to propose a differentiated system of transfers between small and large municipalities22.
The third basis for consensus requires increasing the importance of the role played by the Autonomous Communities in organizing both the local map, providing additional funding and creating incentives for the development of municipal shares on regional
22
We base our proposal in the ideas developed by Suárez et al (2008) and Pedraja and Suárez (2008), although we include some innovations.
revenues (the so-called PICAs for its Spanish initials – Participación en los Ingresos de las Comunidades Autónomas)23. This instrument should be more respectful of the local autonomy than the conditioned subsidy programs that proliferate nowadays.
Below is the synopsis of a proposed differentiated or dual funding system for small municipalities, whose limit could be fixed for those with less than 20,000 inhabitants, and subsequently for municipalities of greater size.
In the case of small municipalities the responsibilities assumed would be restricted to the basic services and their funding would be carried out by means of a very simple tax system consisting of the current mandatory taxes and fees, as well as by a system of unconditioned transfers of fixed amounts per capita. In the absence of cost accounting, the determination of this transfer per capita could be obtained from several relevant indicators (e.g. current expenditures, tax revenues or savings) of a certain type of municipality, once the extreme values for this group of municipalities have been eliminated. Those transfers could be complemented with others such as explicit incentive mechanisms for cooperation in the provision of the services.
For the rest of the municipalities, the main idea that must prevail in the design of the reform is that the type of services provided determines the funding, i.e., the type of tax revenues, the scope of the transfers and even the relative importance of those components. This statement not only has a theoretical basis but can also be contrasted with comparative experiences24. Hence, the larger municipalities would also provide services related to personal affairs and even of a social nature, in addition to the basic ones, and all these services would be funded with the current taxes (conveniently reformed) and a system of tax shares on broad-based tax figures with the possibility of territorialization. This possibility of territorialization requires establishing another relevant critical size on which to establish the necessary fiscal connection points. In the case of the Personal Income Tax, the connection point seems relatively easy to determine using the fiscal address of the taxpayer and the local governments could even be granted a certain degree of regulating capacity which improves their levels of autonomy, e.g., granting them the possibility to establish a variable and limited
23 See Pedraja y Cordero (2011).
24
surcharge. In the case of indirect taxes, the tax share should be established only if an authentic territorialization is possible, which is not the case at present. In our opinion, the number of purely local tax figures does not need to be increased, since we still have enough bases which could generate considerable revenues with low management costs.
Finally, the transfer system should be based on a distribution formula which could eventually become an equalization formula in the case that municipalities assume new responsibilities. The population would be the main indicator of spending needs, although the weighting coefficients should be modified so that the existing differences between greater and smaller municipalities could be reduced in the future. On the other hand, an adequate indicator of fiscal capacity should be designed which incorporates, besides the bases of the local taxes, those corresponding to the new territorialized tax shares (specially, Personal Income Tax), and should grant greater resources to those with less capacity.
The reform of the general transfers system should be implemented in a manner and within a reasonable period so that its objectives can be achieved without guarantees during this transition, other than the statu quo rule.
With these guidelines, in the following lines we present a simulation exercise which assesses different reform alternatives from the model applicable to the municipalities with a population greater than 20,000 inhabitants25, which considers different scenarios and determines the cost of the statu quo in each of them. However, it must be noted that this rule has not always been incorporated into the system, as we described for the cession model.
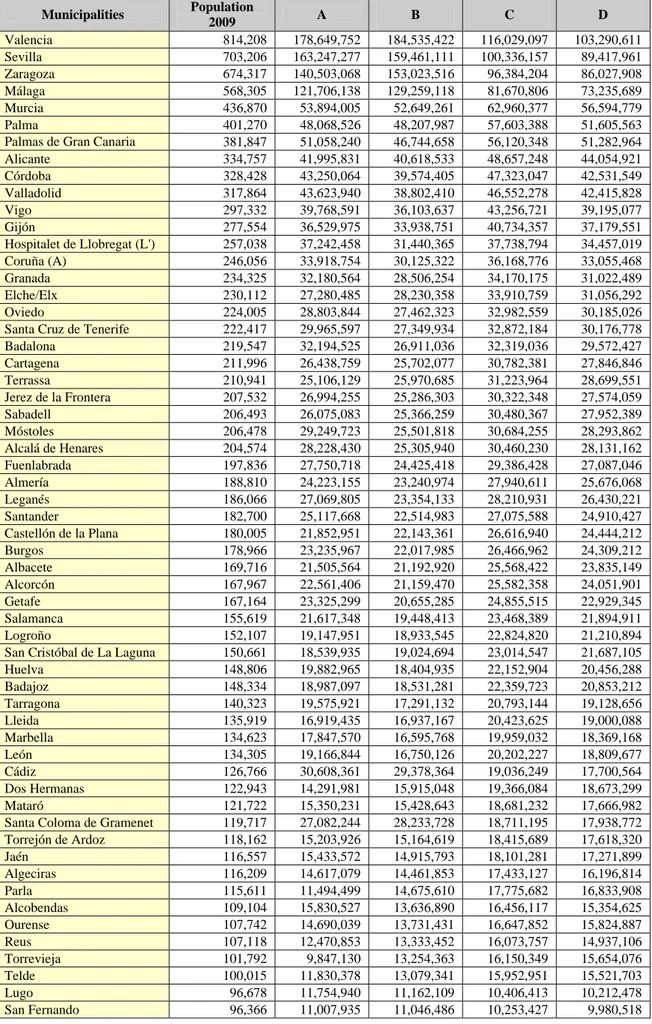
The reference in the comparison of the various alternatives is the current situation (A), which represents the amount obtained by the municipalities included within this group in the last fiscal year closed (2009), and which in total amounts to 3,503,106,399 Euros. We have excluded Madrid and Barcelona since they deserve a special attention in the model. Likewise, in order to use as a reference the real figures of the transfers, we have
included the funding guarantees from the variables model26. Finally, we have maintained the overall transfer for the municipalities with the purpose of evaluating the redistributive impact of the different alternatives proposed.
The options considered are three distribution formulas with two indicators representing spending needs and fiscal capacity, respectively. The former is the population of each municipality, to which we assigned different weightings depending on how radical is the option designed. The latter is a capacity index based on the Real Property Tax, although more refined than the one currently in force in the formula of the variables model. Specifically, we estimate the tax revenues per capita based on the taxable income per capita of the Real Property Tax by means of a regression analysis27. Finally, taking into account the shortcomings of the fiscal effort, we have eliminated this indicator in the proposed options.
• Proposal B: Population is used as a variable of need maintaining the coefficients in force during the previous period (1999-2003). The weights assigned to the indicators of need and capacity are the same, once we eliminated the effort in order to avoid potential distortions (the population is assigned a 90% and capacity a 10%28).
• Proposal C: It is different from the previous one in assigning some new weighting coefficients to the population with the aim of shortening the differences between the municipalities of greater size and the rest (1.5 for municipalities with a population greater than 100,000 inhabitants and 1 for the rest29).
26
The amounts corresponding to the municipalities of Almuñecar and Tacoronte have also been excluded since there was not available information for the calculation of the capacity indexes in 2009.
27
The results of the regression are the following: ITpc = 258,86 + 9,60*BLiqIBIpc
(20,2) (0,56) R2 = 0,43
28
If we eliminate the school units (2.5%) and the tax effort (14%) from the formula in force until 2003 we have an 83.5% remaining. Since the population had a weight of 75% and capacity a weight of 8.5%, the new weightings for these variables would be 89.82% (75/83.5) and 10.18% (8.5/83.5), respectively, or, by simplifying, 90% for the population and 10% for capacity.
29
The value of 1.5 was determined as a solution of commitment or mean between the extreme values of the weightings from the previous system for a population size legally considered as a large city.
• Proposal D: This option maintains the new weighting coefficients for population (1.5 and 1) and assumes a more balanced distribution of the transfer among the indexes of need and capacity assigning a 75% to the first and a 25% to the second. Obviously, the choice between these proposals would be determined by a political decision, although the technical issues are also relevant. On the one hand, some restrictions are obvious, such as the status quo rule (no one loses due to the change introduced in the system), as well as maintaining the cost of the new system within certain limits. Next we gather the cost of each proposal with regards to the initial situation, maintaining the status quo, as a percentage of the overall transfer received by this group of municipalities in the 2009 fiscal year (Table 6).
Table 6. Status quo cost for each alternative
B C D
4.7% 9.4% 10.6%
In view of the results, it is obvious that the alternatives that propose a more radical change in the weightings of the population are those which would entail greater differences in the distribution formula and, therefore, a greater cost for the government in the case of maintaining the status quo of the municipalities that would lose funding.
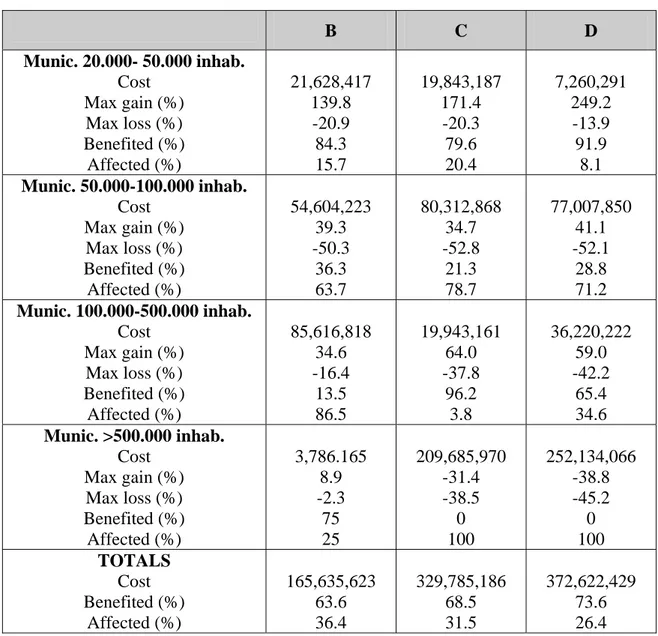
In addition of the cost, another important issue is the identification of municipalities mainly affected by the changes introduced in the distributive formula. For that purpose, the information shown in Table 2 of the Appendix is considerably useful (it shows the results of the simulations for each of the municipalities ordered according to their population size) and even more the content of Table 7, in which we can distinguish the municipalities that obtained gains or loses in resources as well as the cost of the status quo in terms of money, distinguishing four sections of population.
Table 7. Winners, losers and costs for different municipal sizes B C D Munic. 20.000- 50.000 inhab. Cost Max gain (%) Max loss (%) Benefited (%) Affected (%) 21,628,417 139.8 -20.9 84.3 15.7 19,843,187 171.4 -20.3 79.6 20.4 7,260,291 249.2 -13.9 91.9 8.1 Munic. 50.000-100.000 inhab. Cost Max gain (%) Max loss (%) Benefited (%) Affected (%) 54,604,223 39.3 -50.3 36.3 63.7 80,312,868 34.7 -52.8 21.3 78.7 77,007,850 41.1 -52.1 28.8 71.2 Munic. 100.000-500.000 inhab. Cost Max gain (%) Max loss (%) Benefited (%) Affected (%) 85,616,818 34.6 -16.4 13.5 86.5 19,943,161 64.0 -37.8 96.2 3.8 36,220,222 59.0 -42.2 65.4 34.6 Munic. >500.000 inhab. Cost Max gain (%) Max loss (%) Benefited (%) Affected (%) 3,786.165 8.9 -2.3 75 25 209,685,970 -31.4 -38.5 0 100 252,134,066 -38.8 -45.2 0 100 TOTALS Cost Benefited (%) Affected (%) 165,635,623 63.6 36.4 329,785,186 68.5 31.5 372,622,429 73.6 26.4 These results show that all the proposed formulas are beneficial for the vast majority of smaller municipalities (between 20,000 and 50,000 inhabitants), specially with the formula that grants lower weight to the need (D). In contrast, most municipalities located in the section between 50,000 and 100,000 inhabitants would lose resources with any distribution formula, although the most significant losses would arise when the weights assigned to the population are 1 and 1.5 (models C and D).
The municipalities located in the following section (100,000 – 500,000 inhabitants) are clearly benefitted from the implementation of the two most radical alternatives (Proposals C and D), in which their population receive a coefficient of 1.5. Finally, also as expected, the municipalities with greater size experience considerable losses when using the simple weighting coefficients (1 and 1.5), i.e., with options C and D.
Another relevant aspect that should be highlighted is that all the alternatives considered lead to establish a correct link between resources and variables representing capacity. This connection can be measured through the Spearman correlation coefficients between the transfer corresponding to each of the alternatives and the estimated capacity index (Table 8). According to the values reported in this table, the current transfer (Option A) has a low correlation and with an opposite sign than expected with regards to the tax capacity variable (IF): +0.065. Nevertheless, all the proposals present a correlation with the capacity with the appropriate sign (negative), which becomes greater as the weight of this factor is increased in the distribution formula, being even statistically significant in option D (-0.192).
Table 8. Correlation coefficients between different alternatives and the capacity index
Option A Option B Option C Option D Capacity Index Option A 1.000 Option B 0.975** 1.000 Option C 0.973** 0.996** 1.000 Option D 0.929** 0.975** 0.990** 1.000 Capacity Index 0.065 -0.029 -0.089 0.192** 1.000
** The correlation is significant at 1 per cent level.
In our opinion, the adjustment of the general transfer according to the various alternatives proposed would lead to an improvement in terms of equity for the allocation of resources. Moreover, they would also allow connecting the transfer assigned to the municipalities with the evolution of their corresponding relative spending needs and fiscal capacity, although they would imply a disconnection with the revenues collected in the municipality. However, this could be achieved by implementing tax shares on some specific taxes, which would entail a slight correction in the definition of those alternatives. This modification would be the division of the general transfer into two different components (in a similar manner to the current cession system):
• A group of territorialized tax shares on the Personal Income Tax and indirect taxes that should not exceed a specific percentage of the total transfer in order to avoid the existence of great divergences over time.
• A general fund resulting from subtracting the previous tax shares from the total transfer calculated for the base year.
The evolution of each of these components would be different. The territorialized tax shares would evolve according to the corresponding revenues collected in each municipality which will be different from each other, while the general fund should be associated to a general macroeconomic indicator (e.g., GDP) or to the revenues collected by the central government (ITE). In the case of opting for ITE, this index should be designed on a manner so that it could not be affected by potential changes that could be introduced in the regional funding system.
This approach has the advantage of connecting part of the transfer with the economic evolution of the municipality (via territorialized tax shares), but it would maintain the inconvenient that the evolution of the transfer calculated in the base year would be disconnected from the evolution of needs and relative capacities of the municipalities. To avoid this problem, the formula could be used for the overall calculation of the transfers in the base year and this total amount would evolve annually according to the ITE. Subsequently, the overall amount calculated for every year would be distributed according to indicators of needs and capacity using the option selected among the alternatives, which would also include among the factors of capacity the new territorialized tax shares. Furthermore, as a stabilizing element for the transfer systems, it should be reviewed after a short period.
Finally, if the municipalities assume new responsibilities due to changes in the allocation of competences across different levels of the government, the local funding system should be adjusted in order to strengthen the importance of the own revenues. This aims could be achieved allowing, e.g., the possibility to establish a variable and limited surcharge over the Personal Income Tax or designing a new equalization transfer scheme.
References
Ahmad, E. (1997), Financing decentralized expenditures, Studies in Fiscal Federalism and State-Local Finance, Egward Elgar.
Boadway, R. (2001), ‘Intergovernmental fiscal relations: The facilitator of fiscal decentralization’, Constitutional Political Economy, 12, 93-121.
Boadway, R., Shah, A. (eds.) (2007), Intergovernmental Fiscal Transfers: Principles and Practice, Public Sector Governance and Accountability Series, Washington: The World Bank.
Boex, J., Martínez-Vázquez, J. (2007), ‘Designing intergovernmental equalization transfers with imperfect data: concepts, practices and lessons’, in Martínez Vázquez, J. y Searle, B. (eds.), Challenges in the Design of Fiscal Equalization and Intergovernmental Transfers, Springer.
Borge, L.E. (2011), ‘Local Equalization Grants: Purpose, Efficiency Effects and Design’, in IEB´s World Report 2010 on Fiscal Federalism, Barcelona.
Buchanan, J. (1950), ‘Federalism and fiscal equity’, The American Economic Review, 40 (4), 583-599.
Gramlich, E.M. (1977), ‘Intergovernmental grants: A review of the empirical literature’, en Oates, W.E. (ed.): The political economy of Fiscal Federalism, Lexingto MA: Health Publishers.
Martínez Vázquez, J. and Searle, B. (eds.) (2007), Challenges in the Design of Fiscal Equalization and Intergovernmental Transfers, Springer.
McMillan, M.L. (2008), A local Perspective on Fiscal Federalism: Practices, Experiences, and Lessons from Industrial Countries, in Shah (ed.), Macro Federalism and Local Finance. Washington. World Bank.
Oates, W.E. (1972), Fiscal federalism, New York, Harcourt Bruce Jovanovich.
Pedraja, F. (2011), ‘Las subvenciones generales en la financiación local española’, Informe IEB sobre Federalismo Fiscal en España, Barcelona.
Pedraja, F. and Cordero, J.M. (2011), ‘Las participaciones locales en los tributos de las Comunidades Autónomas de régimen común’, in Lago, S. (coord.), Las transferencias intergubernamentales en España: análisis y propuestas de reforma, Instituto de Estudios Fiscales, en prensa.
Pedraja, F. and Suárez, J. (2002), ‘Subvenciones generales a los municipios: valoración y propuestas de reforma’, Papeles de Economía Española, 92, 120-129.
Pedraja, F. and Suárez, J. (2008), ‘Reformar la PIE, ¿misión imposible?’, Papeles de Economía Española, 115, 152-165.
Solé, A., Bosch, N. (2005), ‘On the Relationship between Local Authority Size and Expenditure: Lessons for the Design of Intergovernmental Transfers in Spain’, Public Finance Review, 33, 343-384.
Suárez, J., Bosch, N; Pedraja, F; Rubio, J.J. and Utrilla, A. (2008), La financiación local en España: Radiografía del presente y propuestas de futuro, Federación Española de Municipios y Provincias, Gráficas Verona.
Tannenwal, R. (2002), ‘Are state and local revenue systems becoming obsolete?’, National Tax Journal, 55 (3), 457-468.
Table 1. Resources of the touristic municipalities in 2009 settlements Population 2009 Total Guaranteed Resources 2009 PIE pc 2009 Hydrocarbons 2009 (1) Tobacco 2009 (2) Total 2009 (3)=(1)+(2) % Cession Cession 2004 Cession 2004 x ITE(0.8003) (4) Difference cession 2009-2004 (5)=(3)-(4) Extra funding % Extra funding pc Calpe/Calp 29,666 3,385,980.38 114.14 74,105.05 88,573.50 162,678.55 4.80% 166,812.24 133,499.84 29,178,71 0.86% 0.98 Campello (El) 26,511 3,319,930.11 125.23 66,223.92 54,388.57 120,612.49 3.63% 127,053.78 101,681.14 18,931,35 0.57% 0.71 Denia 44,464 5,758,538.16 129.51 111,070.14 119,777.91 230,848.05 4.01% 237,271.02 189,888.00 40,960,05 0.71% 0.92 Javea/Xabia 31,593 4,683,580.44 148.25 78,918.65 88,741.31 167,659.96 3.58% 177,069.20 141,708.48 25,951,48 0.55% 0.82 Santa Pola 31,760 3,977,809.09 125.25 79,335.81 89,839.23 169,175.04 4.25% 154,241.81 123,439.72 45,735,32 1.15% 1.44 Pilar de la Horadada 22,050 2,057,291.86 93.30 55,080.44 62,556.65 117,637.09 5.72% 120,067.70 96,090.18 21,546,91 1.05% 0.98 Calvia 51,774 8,061,449.82 155.70 157,946.87 472,874.93 630,821.80 7.83% 769,650.99 615,951.69 14,870,11 0.18% 0.29 Palafrugell 22,365 3,055,594.32 136.62 60,283.65 53,686.99 113,970.64 3.73% 108,633.36 86,939.28 27,031,36 0.88% 1.21 Almuñecar 27,696 3,928,264.93 141.84 67,547.40 71,420.71 138,968.11 3.54% 127,919.22 102,373.75 36,594,36 0.93% 1.32 Isla Cristina 21,324 2,690,199.71 126.16 52,006.82 46,047.90 98,054.72 3.64% 97,820.72 78,285.92 19,768,80 0.73% 0.93 Lepe 25,886 3,173,647.72 122.60 63,133.02 87,061.67 150,194.69 4.73% 127,278.43 101,860.93 48,333,76 1.52% 1.87 Nerja 21,811 2,451,743.26 112.41 53,194.56 83,445.88 136,640.44 5.57% 144,204.78 115,407.09 21,233,35 0.87% 0.97 Mazarron 35,221 3,537,799.59 100.45 112,785.44 83,798.27 196,583.71 5.56% 175,291.89 140,286.10 56,297,61 1.59% 1.60 San Javier 31,432 3,753,558.17 119.42 100,652.22 61,513.86 162,166.08 4.32% 146,687.53 117,394.03 44,772,05 1.19% 1.42 Castro-Urdiales 31,670 3,594,385.33 113.49 97,928.90 60,612.51 158,541.41 4.41% 142,866.34 114,335.93 44,205,48 1.23% 1.40 Calafell 24,265 2,880,238.51 118.70 65,405.00 65,618.67 131,023.67 4.55% 122,651.63 98,158.10 32,865,57 1.14% 1.35 Cambrils 31,720 3,640,946.88 114.78 85,499.55 93,578.87 179,078.42 4.92% 157,256.48 125,852.36 53,226,06 1.46% 1.68 Vendrell (El) 35,821 4,399,719.27 122.83 96,553.58 78,350.23 174,903.81 3.98% 159,141.16 127,360.67 47,543,14 1.08% 1.33 Salou 26,649 3,282,158.54 123.16 71,830.95 222,690.70 294,521.65 8.97% 347,461.58 278,073.50 16,448,15 0.50% 0.62 Cullera 24,121 3,600,574.91 149.27 60,253.75 56,959.97 117,213.72 3.26% 119,717.28 95,809.74 21,403,98 0.59% 0.89 Sueca 28,908 3,995,015.10 138.20 72,211.58 67,544.43 139,756.01 3.50% 144,160.43 115,371.59 24,384,42 0.61% 0.84