Università Politecnica delle Marche
Scuola di Dottorato di Ricerca in Scienze dell’Ingegneria Ingegneria Industriale Curriculum Meccanico
---
Development of a measurement
procedure for the assessment of carotid
blood pressure by means of Laser
Doppler Vibrometry
Ph.D. Dissertation of:
Luigi Casacanditella
Advisor:
Prof. Enrico Primo Tomasini
Università Politecnica delle Marche
Dipartimento di Ingegneria Industriale e Scienze Matematiche
Abstract
High blood pressure is a great risk factor for several physiological diseases, i.e. myocardial infarction, heart failure, stroke, renal failure, being the leading cause of death worldwide. Therefore, blood pressure measurement is a fundamental aspect of health monitoring. The aim of the present work is to validate a measurement procedure for the assessment of carotid blood pressure by means of Laser Doppler Vibrometry (LDV).
LDV is a non-contact technique with high sensitivity, able to detect the skin vibrations due to the cardiovascular activity.
It has been validated for the assessment of several physiological parameters, such as heart rate, respiration rate and muscle contraction.
In this study, LDV signal has been acquired from 28 healthy participants and it has been calibrated by means of an exponential mathematical model in order to obtain the carotid pressure waveform from the displacement of the vessel.
The results have been compared with two standard techniques for the assessment of blood pressure, sphygmomanometric method and arterial applanation tonometry.
The systolic peak of the calibrated waveform from LDV showed an average percentage deviation of 4% and 8% from the one assessed by means of sphygmomanometric cuff and arterial tonometer respectively.
The accuracy of the present measurement technique is discussed, considering the signal integration and the application of the calibration model as significant contributions to the total amount of uncertainty. An average percentage uncertainty of around 15 % has been obtained in the measure of carotid systolic pressure.
Moreover, other hemodynamic significant parameters, such as arterial stiffness and Left Ventricular Ejection Time, have been derived from LDV data, showing good correlation with the measures of the reference methods.
In conclusion, the proposed measurement technique, for the assessment of carotid blood pressure, shows good agreement with the reference techniques. Overall, some critical issues must be considered, such as the correct localization of the measurement point, the presence of movement artifacts and reflection phenomena not related to the pressure pulse in the investigated vessel.
Contents
Introduction ... 1
Chapter 1 Background ... 3
1.1 Blood Pressure measurements ... 3
1.1.1 Arterial Pressure catheters ... 4
1.1.2 Arterial tonometry ... 5
1.1.3 Indirect Blood Pressure Measurements ... 6
1.1.4 Non contact methods ... 8
1.1.5 Accuracy of blood pressure measurements ... 8
1.2 Laser Doppler Vibrometry principles and applications to
physiological activity ... 9
1.2.1 Cardiac related measurements ... 10
1.2.2 Respiration rate measurement ... 13
1.2.3 Muscle contraction measurements ... 14
Chapter 2 Arterial Pressure measurement by means of LDV ... 15
2.1 Mathematical Models: relationship between displacement of the
vessel and blood pressure ... 15
2.2 Application of the exponential model to LDV signal ... 17
2.3 Carotid location ... 17
2.4 Measurement setup ... 22
2.5 Signal processing ... 23
2.5.1 Preprocessing of LDV signal ... 23
2.5.2 Model implementation ... 26
2.5.3 Uncertainty of the proposed method ... 27
Chapter 3: Results ... 29
3.1 Pressure waveforms comparison ... 29
3.2 Stiffness evaluation ... 34
3.3 Left Ventricular Ejection Time computation ... 34
List of Figures
Figure 1: Physiological variation in pressure waveform throughout the
arterial tree
Figure 2: Invasive pressure measurement by means of a catheter
Figure 3: applanation tonometry over the radial artery
Figure 4: The principle of measurement of an applanation tonometer
Figure 5: example of pressure cuff
Figure 6: amplitude of the oscillations measured by means of the
oscillometric pressure meter
Figure 7: concept of a Laser Doppler Vibrometer
Figure 8: an example of main peak detection in ECG (above) and LDV
(below) signals on the carotid site
Figure 9: example of QT time interval in ECG signal (above) and V
1V
2time interval in LDV signal on the carotid site (below)
Figure 10: example of tacograms obtained by means of ECG (above)
and LDV (below)
Figure 11: measurement point localization by means of thermal camera
Figure 12: Thermal image (above) with a zoom on the carotid area
(below, with the bifurcation marked with a red dot)
Figure 13: representation of the measurement grid
Figure 14: averaged LDV signals of point 1 and point 3 (subject 1),
above, and 5x7 matrix with the peak to peak values, below.
Figure 15: resampled carotid map (subject 1)
Figure 16: Example of two different carotid path, participant 6 (left),
participant 16 (right)
Figure 17: the measurement grid,top, LDV traces of the fourth column
and zoom on the area related to the velocity peaks, bottom.
Figure 18: Setup scheme: ECG electrodes placed on the skin according
to the standard positioned scheme of the I-lead ECG; LDV spot
perpendicularly directed on the skin surface
Figure 19: flow chart of the signal preprocessing procedure
Figure 20:raw LDV signal, above, filtered signal, below.
Figure 21: Filtered LDV signal, above, integrated and detrended signal,
below.
Figure 22: individuation of onset and offset in single displacement
waveforms, green dots
Figure 23: an example of average LDV displacement signal
Figure 24: flowchart of the algorithm for the implementation of the
exponential model
Figure 25: example of LDV pressure waveform
Figure 26: comparison between reference systolic pressure and LDV
systolic pressure
Figure 27: average tonometric waveform (left), average LDV pressure
waveform (right)
Figure 28: alfa average value as a function of age
Figure 29: LVET computation from tonometer and LDV, left and right
respectively
Figure 30:scatter plot of LVET measured at carotid level by means of
LDV versus LVET measured at radial level by means of arterial
tonometer
Figure 31: Bland Altman plot as a comparison method for the
measurement of LVETbetween LDV and arterial tonometer
List of Tables
Table I: physical characteristics of the tested participants
Table II:Gender of the participants, Measured brachial systolic
pressure, Reference carotid systolic pressure calculated as
0.79*Brachial Systolic Pressure for male participants and as
0.85*Brachial Systolic Pressure for female participants, LDV Carotid
Systolic pressure, Percentage deviation between LDV systolic pressure
and reference systolic value
Table III: Gender of the participants, Measured radial systolic
pressure, LDV carotid systolic pressure, Reference carotid systolic
pressure computed as Measured radial systolic pressure +12 mmHg
and Measured radial systolic pressure +8 mmHg for male and female
participants respectively, percentage deviation between LDV and
reference systolic pressure
Table IV: uncertainty in the measurement of systolic peak, study 1, left,
study 2, right
Table V: average LVET measured by means of LDV and Radial
Tonometer
Introduction
Hypertension, the systemic condition accompanying high blood pressure [1], is a relevant risk factor for several physiological diseases, e.g. heart failure, stroke, kidney failure[2]. This condition can be asymptomatic [2], moreover many different situations, such as physical activity or acute stress, can normally raise blood pressure. These temporary increases cannot be considered pathological: a diagnosis of hypertension can be made only when the patient has multiple high blood pressure readings over a period of time [3]. Several studies, [4] [5] [6], demonstrate that high blood pressure has a wide prevalence in the world population.
In fact, the World Health Organization (WHO) has defined hypertension as the first cause of death worldwide [7].
Therefore, blood pressure should be checked regularly, in order to monitor the health status of the cardiovascular system.
The gold standard method for the determination of the blood pressure waveform involves its direct measure by means of invasive techniques; the installation of an indwelling pressure transducer on the measurement site is required [8]. The continuous assessment of blood pressure waveform can furnish several types of information about cardiovascular activity, i.e. heart rate or location of the dycrotic notch.
In comparison, conventional blood pressure sensors, such as cuff based devices, are able to provide only the maximum and the minimum pressure values in a heart period, systolic and diastolic pressure respectively.
Cuff based techniques are the most common approaches for blood pressure assessment, in particular within the home monitoring environment. However, these devices are affected by an high degree of uncertainty and they pose some issues for long term monitoring, because of the discomfort caused by the cuff [8].
Another common technique, which is able to provide the blood pressure waveform is the arterial applanation tonometry [9]. This technique is based on the use of a pressure transducer pressed against a blood vessel supported by a rigid structure, usually a bone. It can provide an accurate representation of the pressure waveform, but it requires the use of a calibration model [10]: this allows the waveform to be rescaled to its correct amplitude in typical units (e.g. mmHg). The application of such transfer function to the general population is subject to debate, and this represents one of the main limitations about the use of this technique [11]. Moreover, the correct installation of the pressure transducer is particularly challenging in obese patients, because of the significant presence of adipose tissue .
Other studies show the feasibility of alternative techniques to evaluate blood pressure non-invasively; in [12], intravascular magnetic resonance (MR) was used to assess the blood pressure waveform. A 1.5 Tesla [T] MR scanner was used, just above the sino-tubular junction, to evaluate the aortic area curves. This technique allows direct measurement of the variation of the vessel section during the cardiac cycle, but needs a calibration model to derive the pressure waveform from the aortic traversal area.
Pulse-Wave-based Ultrasound Manometry (PWUM) is another non-invasive method that combines Pulse Wave Imaging (PWI) and vessel diameter measurements for the
assessment of blood pressure[13]. It is based on the ultrasound scanning of the cross-section of the vessel, in order to measure its diameter variation during the cardiac cycle. The present work considers a method for non-contact measurements of the blood pressure waveform.
The proposed approach is based on the use of a Laser Doppler Vibrometer (LDV).
LDV allows measurement of the vibrations of the skin surface due to the movements of arterial walls with an high degree of accuracy [14]. Several studies [15] [16] have investigated the use of LDV to assess heart rate and other cardiovascular parameters. The LDV technique has a high sensitivity and presents the significant advantage of being non-contact.
Therefore, the aim of this study is to validate a non-contact measurement procedure for the assessment of carotid blood pressure by means of Laser Doppler Vibrometry.
The rational of this work has been developed according to the following steps: measurement of the mechanical vibration of carotid artery by means of LDV, calibration of the displacement curves from LDV for the calculation of carotid
blood pressure
discussion of the obtained results
The first step has required the development of a procedure for the localization of the correct measurement point over the investigated vessel, i.e. the carotid artery.
The finding show that an incorrect positioning of the Laser spot causes the incorrect measure of the carotid vibration amplitude as well as the measurement of velocity components which may not be related to the phenomenon of interest.
Two different approaches, based on the use of a thermal camera and a Laser Scanner system respectively, have been tested.
The calibration of acquired signals has been performed by means of a mathematical exponential model taken from scientific literature [10].
The results are discussed in terms of comparison between the calibrated LDV signals and standard reference techniques, e.g. cuff sphygmomanometry and arterial tonometry. In chapter 1, a short review of the most significant blood pressure measurement techniques is presented. In addition, the main biomedical applications of Laser Doppler Vibrometry, developed over the past years, are described.
Chapter 2 discusses the basic steps to achieve a blood pressure waveform from LDV signal. Therefore, the main calibration techniques of blood pressure are reported, with a particular focus on the mathematical model choosen in the present study.
Then, the approaches used for the correct location of the measurement point, the measurement setup are described.
In the last section of the chapter, the steps of LDV signal processing are shown in detail. Chapter 3 reports the results of this work, in terms of determination of the pressure waveform and achievement of parameters of physiological interest from the obtained signal, such as arterial stiffness and Left Ventricular Ejection Time.
Chapter 1
Background
1.1 Blood Pressure measurements
The study of the physical variables related to the movement of blood in the cardiovascular system is called hemodynamics.[17]. Fluid cannot move through a system unless some energy is applied to it, in fluid-dynamics this energy is expressed as a pressure gradient between two points of the system. In hemodynamics, blood pressure is the pressure exerted by the blood against the walls of a vessel. The peak pressure during contraction of the heart is the systolic pressure and it is tipically around 110-130 mmHg, whereas the minimum arterial pressure during relaxation of the heart is the diastolic pressure, usually around 70-90 mmHg [17]. The difference between the systolic and diastolic pressure is the pulse pressure [18]. Another important parameter of pressure waveform is the mean arterial pressure (MAP), the average arterial pressure during a cardiac cycle, calculated as follows:
Tp
t
dt
T
MAP
01
where p(t) is the pressure wave during a cardiac cycle and T is the cardiac period.
Several empirical formulas were developed to estimate MAP when it is not possible to assess the blood pressure waveform [19]. The most common one is reported below:
DBP
SBP
MAP
2
3
1
where DBP and SBP are diastolic and systolic blood pressure respectively.
As blood flows along the aorta and into the other arteries, it is possible to notice significant changes in the arterial pressure waveform: as the pressure pulse moves away from the heart, the systolic peak rises while the diastolic pressure remains fairly constant. It is not completely clear why the pressure wave changes shape, it may be related to factors such as decreased compliance of distal arteries, the presence of refleced waves which add a contribution to the pressure pulse [20]. Moreover MAP declines, but its reduction is quite small, limited to a few mmHg [11]. The figure below [21] shows the changes in shape from aorta to distal arteries.
Figure 1: Physiological variation in pressure waveform throughout the arterial tree [21]
In the following sections, a review of the most important techniques used to assess arterial pressure is reported.
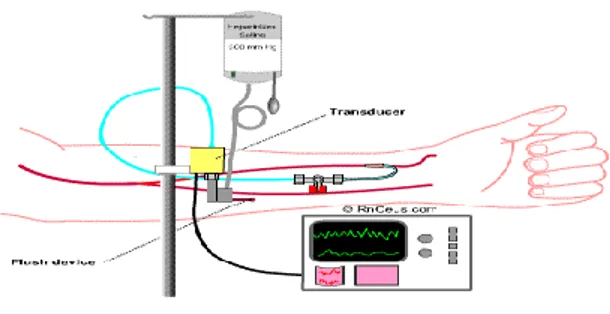
1.1.1 Arterial Pressure catheters
Direct measurement methods are the most accurate approaches for the assessment of intra-arterial blood pressure and they support measurement of the continuous pressure waveform [22]. They require an high level of specialization and they are associated with a higher degree of risk for the patient. These devices are based on the insertion of a pressure sensor in the measurement site by means of a catheter full of fluid in order to obtain a hydraulic coupling between the anatomic site and the pressure transducer.
Ideally, the fluid in the catheter should realize a perfect hydraulic coupling in order to transmit the pressure measured in the arterial site without introducing any error. In real conditions, the pressure transfer through a tube with a proper length, internal diameter and thickness generate an error due to the dynamic response of the system composed by blood, catheter and transducer. This is a typical dynamic response of a second order system. Another possible cause of error is the difference of height h between the pressure transducer and the catheter, this measurement uncertainty could be calculated as the product
ρgh, where ρ is the density of the fluid in the catheter and g is the gravitational acceleration
[22]. Moreover, if the fluid pressure can be considered as a constant in every direction in static conditions, in dynamic conditions, it is a function of kinetic energy ρv2/2.
This is a cause of error depending on the relative movement of the fluid with respect to the pressure transducer. A further factor of error could be the insertion of the instrument, this is a relevant issue in the vessels with a lumen comparable with the catheter diameter [23]. In these instances, the catheter insertion produces significant variations of pressure and velocity fields [22]. The insertion error can be computed from the ratio between vessel and catheter diameters.
1.1.2 Arterial tonometry
Arterial tonometry is a technique for blood pressure measurement in which one or more pressure sensors are pressed against the skin over an artery [24] The superficial artery is supported by rigid (e.g. a bone) structure, so that adequate applanation of the vessel can be achieved to obtain the pressure waveform. As tonometry can only provide the waveform, this signal has to be calibrated by means of an external method, for example a cuff technique giving peripheral blood pressure values [12]. This allows the waveform to be rescaled to its correct amplitude. Applanation tonometry is based on the Imbert-Fick principle [5].
Figure 3: applanation tonometry over the radial artery
The Imbert-Fick law states that the internal pressure (Pt) in a spherical body with an
infinitely thin, dry and elastic membrane wall, equals the force (W) exerted on this body divided by the applanation surface (A). Hence, in an applanated spherical body, the Imbert-Fick law can be written as Pt = W/A; if one can measure W and A, Pt can be derived. In
brief, a superficial artery (usually the radial one) is compressed and partially flattened against the underlying rigid structure. This flattened arterial surface acts as a "transducer" for intravascular pressures acting perpendicularly against the vessel wall. An array of piezoelectric crystals, positioned on the skin overlying this flattened portion of artery, senses arterial pressure changes and translates them into a continuous arterial pressure waveform.
1.1.3 Indirect Blood Pressure Measurements
The indirect techniques to measure arterial blood pressure were introduced in Italy at the end of the 19th century by an Italian physician, Riva-Rocci [26]. This methods use a device called sphygmomanometer, which is an inflatable bladder covered by a cloth sleeve and a column to measure the pressure. The cuff is applied to the arm or leg over a major artery, and the bladder is inflated in order to reach a pressure able to compress the underlying artery. The bladder is then gradually deflated, so the artery is decompressed.
Figure 5: example of pressure cuff
It is important that the compression of the artery produced by the inflatable bladder in the cuff is uniform, this produce more reproducible sounds or vibrations. The length of the bladder should be at least 80% of the circumference of the upper arm in order to achieve an uniform compression of the interested area . If the dimension of the bladder is too small, the pressure measurements will be affected by a relevant error [26].. The use of a cuff with inappropriate size is called miscuffing and it is considered the most common cause of errors in the indirect measurement of arterial blood pressure.
There are different blood pressure measurement techniques based on the use of a sphygmomanometer cuff. The main ones are reported below.
Palpatory Method:
This method allows the measurement of the systolic pressure value. It is based on the following principle:the blood pulse cannot be palpated until the cuff pressure drops below systolic value.
Therefore, the operator touches the artery just above the cuff and he registers the systolic value when he is able to perceive the blood pulse.
Auscultatory Method:
This method considers the measurement of the blood pressure by means of the determination of sounds , the Korotkoff sounds, generated by the artery when it begins to open. These sounds are produced by the vibration of the artery related to the turbulent flow over the occlusion. The Korotkoff sounds, KS, are characterized by a very low frequency, in the range 25-50 Hz, and so they are just above the human threshold for hearing, that is 16 Hz [26]. When the artery is completely occluded, it does not produce any sound. Then, the opening of the valve causes a decrease of the pressure over the vessel. The first sound corresponds to the systolic pressure, which can be read by means of a manometer.
The sounds produced by turbulent blood flow last so long as the vessel is still compressed. When the KS disappear, the artery has recovered its original lumen, and the diastolic pressure can be measured. The auscultatory method is characterized by a high level of uncertainty, depending on the operator hearing capability and his time reaction in associating the starting sound or the last one to the pressure read on the manometer. Therefore, it is very difficult to quantify the performances of this technique in terms of accuracy and precision [22].
Oscillometric Method:
This approach is used to detect pulsatile pressure changes, oscillations, over an artery using the principles of plethysmography [26]. The processing of these periodic changes in oscillations is electronically performed and it allows measurement of the diastolic, systolic and mean arterial pressure. The instrument consists of a pneumatic circuit connected to a sphygmomanometer cuff and an electronic circuit able to detect the pressure in the cuff by means of a pressure sensor. The measurement procedure starts with the occlusion of the artery, this produces a total reflection of the pressure wave, inducing a small pressure pulse in the cuff. Then, the pressure in the cuff is gradually reduced by steps of 5 mmHg. When two oscillations of the same amplitude are detected, the pressure is reduced again, in order to reduce movement artifacts. The micro-processor receives, at each step, the cuff pressure and the amplitude of the oscillations. The first two oscillations with higher amplitude furnish the systolic pressure value. When the pressure is equal to its mean value (MAP), the oscillations reach their maximum amplitude. The diastolic value is registered when the oscillations become constant again [22].
1.1.4 Non invasive methods
Different methods have been proposed in the past years to assess the pressure waveform non invasively. In [27] an approach based on the measurement of the distension wave of carotid artery by means of echo tracking has been shown. This technique requires the use of a calibration model [28] based on the assumption that the diastolic and mean arterial pressures are fairly constant through the arterial tree. The results of this work show reliable and reproducible results in comparing the approach with arterial tonometry. In [13] an ultrasound-based technique has been used to assess the local pulse pressure waveform without contact. Using raw radio frequency ultrasound signals at high frame rate the authors have measured the local distension waveforms. Moreover the local Pulse Wave Velocity (PWV) has been assessed, it gives significant information about the local stiffness of the vessel. The combination of PWV and distension waveforms has allowed the acquisition of a pulse pressure waveform strongly related to the one measured by applanation tonometry.
Another approach [12] consist of image processing techniques applied to cross-sections of the arteries obtained using magnetic resonance imaging. This technique is based on the fact that the relationship between pressure and arterial areas can be approximated by means of basic mathematic functions [10].
Therefore, the use of a mathematical model and the measurement of diastolic and mean arterial pressure allow a calibrated pressure waveform to be obtained.
In [12] three different mathematical models to derive the pressure waveform from the variation of the arterial section are compared, using an arctangent, a linear and an exponential function respectively. The results of this study show that arctangent and exponential methods are superior to the linear one in the assessment of the arterial pressure from the aorta.
1.1.5 Accuracy of blood pressure measurements
No matter which measurement device or method is used, blood pressure is an hemodynamic quantity, depending on many factors, including the circumstances of measurement itself.
In any case, it is important to underscore that an accurate device is fundamental to all blood pressure measurement [29]. In fact, attention to methodological details is not so relevant if the device is inaccurate [30].
The most accurate technique to measure blood pressure involves the use a pressure catheter. However, as reported in section 2.1.1, catheters too are affected by several causes of error: one of them is the blood kinetic energy which can produce what appear to be pressure variations. Therefore, the measured pressure depends on the orientation of the sensor with respect to the direction of blood flow.
In particular, in central districts, where systolic pressure is smaller, this could cause relevant errors. For instance, typical systolic pressure of the pulmonary artery is around 20 mmHg [18]; considering a blood velocity of 0.9 m/s, the dinamic contribution to blood pressure is 3 mmHg, and, therefore, the error is around 15 %.
With regard to cuff measurement devices, there are several sources of uncertainty, such as posture of the patient, arm support and position [30].
The American Association for the Advancement of Medical Instrumentation published a reference standard for sphygmomanometers for evaluating the accuracy of sensors[31]. In [32], several blood pressure measurement devices were tested in comparison to the reference standard. A mercury sphygmomanometer was used as the standard reference device, and the tested sensors were classified in dependence of the percentage of measurements inferior less than 5 mmHg, 10 mmHg and 15 mmHg with respect to the reference standard. None of the automated blood pressure measuring devices for self measurement at the upper arm were recommended. This confirms the high degree of uncertainty of the cuff sphygmomanometric devices. With regard to arterial tonometry, in [33] the accuracy of arterial tonometry was discussed in terms of comparison with an arterial catheter. Results showed that the tonometric waveform is almost equal to the intra-arterial waveform. Inevitably, however limitations surrounding the use of intra-arterial applanation tonometry refer to the application of a transfer function for the calibration of the pressure waveform. The validity of such transfer function to the general population is subject to debate [12]; this is due to the lack of studies validating the method versus invasive techniques in a general population. Moreover, the application of arterial tonometry is particularly challenging in obese subjects.[12].
1.2 Laser Doppler Vibrometry principles and applications to
physiological activity
Laser Doppler Vibrometry (LDV) is a non-contact measurement technique used to assess the vibration of a surface, it is based on the Doppler effect. It is a frequency shift that happens when source and observer move relative to each other. The Doppler Effect can be used with the principle of interferometry to accurately measure surface velocity or displacement. An interferometer is an optical instrument which measures the position of the waves which have propagated through different paths. The interferometer splits an electromagnetic wave in two different parts using a beamsplitter. Then the two beams are delayed by unequal distances, redirected and recombined and so the intensity of the waves is detected. A Laser Doppler Vibrometer is a special kind of optical interferometer. Within the LDV hardware, the laser beam is split in two beams (reference and measurement) by means of a beamsplitter. The measurement beam then passes through the Bragg cell, which adds a frequency shift. Without a Bragg Cell, the system would not be able to distinguish whether the detected movement is towards or away from the laser. This frequency shifted beam then is directed to the target and the vibration amplitude and frequency are extracted from the Doppler shift of the reflected laser beam frequency due to the motion of the surface, once it is reflected back and collected to the photodiode by a second beam splitter together with the reference beam. The output of an LDV is generally a continuous analog voltage that is directly proportional to the target velocity component along the direction of the laser beam [34].
Figure 7: concept of a Laser Doppler Vibrometer
The relationship between the Doppler frequency fd and the velocity v of the targeted
where λ is the wavelength of the Laser radiation.
Several studies, [14] [16] [15] [35] [36] have investigated the use of LDV to assess heart rate and other cardiovascular parameters. These studies show that this technique has a high sensitivity and presents the great advantage of operating without contact. Moreover, LDV has been also used to assess other physiological parameters such as respiration rate [37] [17] or muscle contraction [39], measuring the movements related to breathing or muscular activity respectively. A short review of the main biomedical applications of Laser Doppler Vibrometry is reported above
1.2.1 Cardiac related measurements
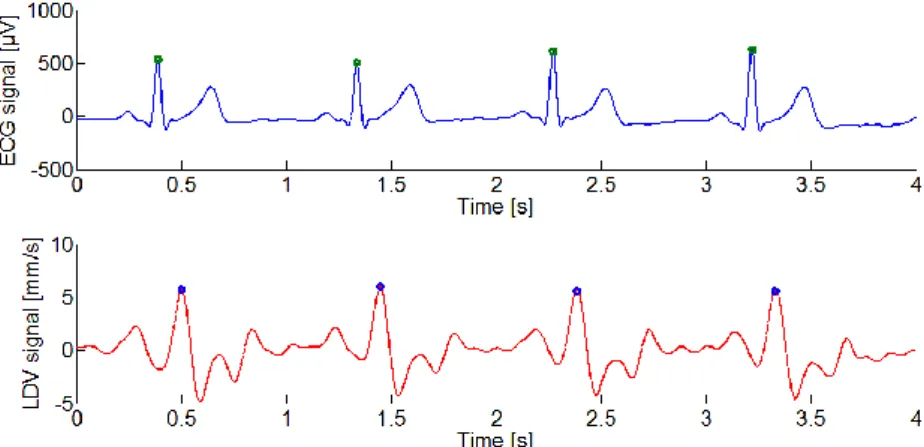
Several studies, [14] [16] [15] [35] [36], have investigated the applications of Laser Doppler Vibrometry to the monitoring of cardiovascular activity. One approach considers the measurement of the vibration activity over an artery, usually the common carotid artery. Therefore, the measurement point is, usually, fixed on the neck. In [16] a deep investigation of LDV signal over the carotid has been conducted. In particular LDV signal was studied at rest, and during and after rebreathing, a particular condition in which the participants were asked to raise upon cue an appropriately sized disposable surgical mask to their face and to hold it in that position with sufficient force to maintain a tight seal. The mask was connected to a anaesthetic bag, thus forcing the participants to rebreathe the same air. Vibration signals recorded with the LDV were studied both in terms of velocity, raw traces, and displacement, integrated signals. The rebreathing maneuver produced a relevant variation in the cardiovascular parameters such as Heart Rate, Blood Pressure and Pressure Pulse. Their variations were monitored by means of Electrocardiograph (ECG), arterial tonometer and Impedance Cardiogram (ICG). The focus of this study was to determine if the changes in cardiovascular conditions were mirrored in features of the LDV carotid pulse, suggesting that it can furnish significant information regarding cardiovascular function. Although considerable study remains, these findings suggest that the LDV method can be used as a surrogate for conventional measures. In [35] the movements of the chest wall were monitored by means of a single point Laser Doppler vibrometric system. A comparison has been performed with the gold standard method for the assessment of the cardiac activity, the electrocardiography (ECG). The measurement principle was based on the assumption that the peak in LDV signal is due to the muscle contraction triggered by the electrical signal measured by ECG. The main peak of the LDV signal, related to the R wave peak of the ECG, was identified following a procedure reported in [15]. All the results show an average bias in the measure of heart rate lower than 1 beat per minute (bpm).
Figure 8: an example of main peak detection in ECG (above) and LDV (below) signals on the carotid site
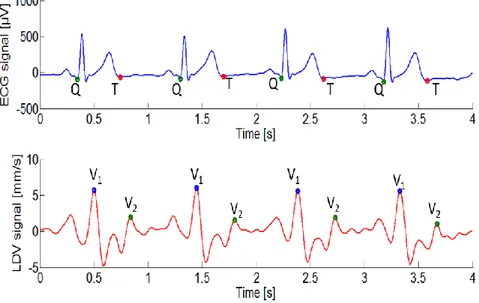
Moreover in [40] an LDV single point system (Polytech PDV 100) was tested for the HR measurement over the common carotid artery. The reliability of such an approach was discussed in terms of sensitivity and positive predictivity with reference to the gold standard method (ECG). The obtained indicators were very closed to 1 for both the considered sensors (LDV and ECG), which means very good agreement with the reference method. This is confirmed by the fact that the average deviation between the two sensors for the 8 tested subjects was of 1.5 bpm. In this study, LDV and ECG have been also compared in order to evaluate if it is possible to estimate the QT time interval, the duration of ventricular contraction [41], by means of Laser Doppler Vibrometry. According to the results, a common bias of nearly 100 ms is noticed in the QT time interval with respect to the time interval between the two main peaks of LDV signal (V1 and V2).
Figure 9: example of QT time interval in ECG signal (above) and V1V2 time interval in LDV signal on the
carotid site (below)
This is due to the fact that V2 is correlated to the T peak of the ECG signal, while the QT
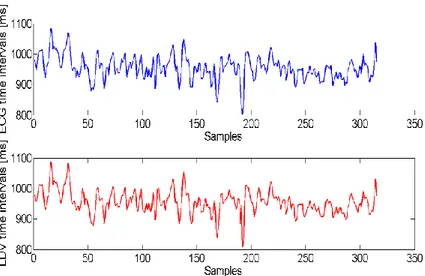
interval is computed by measuring the onset of QRS complex and the offset of T wave. The possibility of detecting a relevant feature, usually the main peak, in each cardiac cycle by means of LDV has permitted study of the Heart Rate Variability (HRV) without contact. HRV is the study of the physiological variability of the Heart Rate (HR), which is related to the health conditions of the subject. HRV is assessed measuring heart periods (HP) on a time window of >5 minutes [42].[22] In [35] a comparison between ECG and LDV was performed in time and frequency domain. The results showed no statistical difference between ECG and LDV in the studied HRV indices. In [36] LDV was compared with ECG and other devices for the cardiovascular monitoring (i.e. photoplethysmograph and phonocardiograph ) in terms of heart rate and heart rate variability measurements. This work confirms that it is possible to accurately measure HRV by means of LDV. In figure 10, there is an example of the tachograms, the series of time intervals between two main features in a cardiac-related signal, obtained from ECG and LDV.
Figure 10: example of tacograms obtained by means of ECG (above) and LDV (below)
1.2.2 Respiration rate measurement
LDV systems have also been applied to the monitoring of respiration activity. The measurement principle is always based on the possibility of determining the velocity of a moving surface in the direction of the Laser spot. In respiration monitoring, the measurement point is fixed on the subject thorax, in order to reveal the movements related to the breathing act.
In [44] the velocity traces obtained by means of LDV on 10 different points fixed on the thorax have been compared with the signal measured by means of the reference device, i.e. the spirometer. The optical head of the vibrometer has been placed at a distance of 1.5 m from the tested subjects. The experiment has been conducted on 33 healthy subjects. The investigated breathing parameter was the respiration rate (RR), calculated from the time interval measured in seconds between two expiration maxima: the measurement principle is based on the assumption that the displacement signal measured by LDV is a consequence of the mechanical movement of the chest resulting from the respiration activity. The results of this study show an average deviation between the respiration periods acquired by means of the two systems of around 14 ms, therefore the authors suggest the use of LDV for the RR assessment in those cases where the standard use of a spirometer is impossibile, e.g. with non-cooperative patients.
The same principle has been used in [38] for the assessment of Respiration Rate in pre-term infants. The main advantage of the proposed method was the possibility to measure a fundamental physiological parameter without contact with the patient and outside the incubator. Acquired data were compared with the ones obtained from the mechanical ventilators that assist the preterm infant. An uncertainty of ± 0.13 s in the RR assessment was revealed in this study.
1.2.3 Muscle contraction measurements
The LDV technique has been applied to the evaluation of muscular activity in [39] [45]. The aim of these studies was to assess isometric muscle contraction for two locomotor muscles by means of LDV, and to compare the results with the reference technique, the standard electromyography (EMG). The comparison between LDV and EMG has been performed in time and frequency domain. In the time domain, the timing of contraction, onset and offset of muscle contraction, and the amplitude of the signals have been discussed, while, in the frequency domain, the authors have focused their attention on the mean and median frequency of LDV and EMG spectral contents. EMG and LDV data were obtained from arm (flexor carpi ulnaris) and leg muscles (tibialis anterior), on both left and right sides, under two levels of instructed isometric force production. Overall, the times measured by the two techniques were in close agreement. The contraction onset times detected by the EMG and LDM methods were similar but larger differences were observed for measures of contraction offset times. The total contraction times were shorter for the LDV measures than for the EMG measures with a maximum standard deviation of 440 ms. The amplitude analysis was performed in terms of correlation between the Signal-Noise ratios (S/N) of LDV and EMG traces in the different measurement conditions: Pearson coefficient of 0.95 and 0.89 were obtained for flexor carpi ulnaris and tibialis anterior respectively. The frequency domain analysis showed similar Mean Power frequency (MPF) trends for the right and left flexor carpi ulnaris signals, for both the EMG and LDV signals. However, the MPF of the LDV signals were observed to be much lower than the MPF of the EMG signals. The authors suggest that this frequency difference between the LDV and EMG signals is related to the fundamental differences in origin and waveform of the mechanical and electrical muscle response components. LDV was also applied to facial myography to detect facial expression of emotion [46]. The study was assessed using simultaneously the LDV method, EMG and video recordings in order to describe the basic aspects of facial myography activity. The spatial distribution of the LDV muscle vibration patterns was consistent with the locations of the muscles engaged in the various expressions.
Chapter 2
Arterial Pressure measurement by means
of LDV
The focus of this PhD thesis is to develope a measurement technique for the indirect measurement of blood pressure waveform in a central district, such as the carotid artery, by means of Laser Doppler Vibrometry.
LDV is a non-contact technique able to detect the vibrations of the skin surface due to the movements of arterial walls.
The use of LDV for blood pressure measure requires the calibration of the vibrational signal by means of a mathematical model in order to relate the displacement of the vessel to the arterial pressure. Moreover, a fundamental aspect of this study has been the correct location of the measurement point over the investigated vessel.
This chapter will discuss the most significant mathematical models for the calibration of a pressure signal, the techniques used to correctly detect the measurement point, the measurement setup used for the assessment of LDV signal and the signal processing applied to LDV traces.
2.1 Mathematical Models: relationship between
displacement of the vessel and blood pressure
Most of the non-invasive techniques for the measurement of arterial pressure need a calibration model. It usually expresses the relationship between the arterial pressure and cross-sectional area of the blood vessel.
The application of these models starts from the assumption that diastolic and mean arterial pressure remain fairly constant throughout the whole length of the arterial tree [12]. This is an accettable approximation, even if diastolic pressure is characterised by a small fall in peripheral sites, few mmHg [47].
In [12] the aortic area waveforms were calibrated using three different models. They all include the following parameters, in order to express the relationship between arterial pressure p(t) and cross sectional area of the artery A(t):
pd : diastolic pressure, assumed constant through the arterial tree;
Ad, As: arterial diastolic and systolic areas, respectively;
α: a scaling factor; its expression differs from one model to another. The α parameter can be considered as an indicator of the arterial stiffness of the considered vessel. As reported in [8], the arterial stiffness can be expressed in diffent ways, which include the two expressions of α reported below.
Linear model
)
(
)
(
t
p
A
t
p
d
)
(
)
(
d s dA
A
p
BSP
where BSP is the systolic pressure measured at brachial level.
Exponential model
)
1
)
(
(
)
(
A
d
t
A
d
e
p
t
p
d
s
d
s
d
A
A
p
p
A
)
ln(
In [12] calibration of both the models has been performed iteratively reducing the scaling factor α in order to minimize the difference between the measured mean brachial pressure and the synthesized averaged pressure curve.
Arctangent model
2
1
1 0 mA
t
A
tg
P
P
t
p
where Am express the maximal distension of the investigated vessel, P0 is the pressure
corresponding to the maximum compliance of the vessel and P1 is the pressure at half of the
maximum compliance of the vessel.
In [12] MR slices of descending aorta have been calibrated by means of three methods showing good correlation with arterial tonometry; r2 =0.90, r2 =0.87, r2 =0.85 for arctangent, exponential and linear model respectively. Moreover the exponential model showed the best agreement in terms of estimation of the systolic pressure value (bias 0.6 mmHg). Therefore, the exponential model has been considered for the calibration of LDV signal in the present study, producing a satisfying shape for the pressure pulse and a good agreement in terms of estimation of the systolic peak.
2.2 Application of the exponential model to LDV signal
The application of the exponential model to the signal obtained by means of Laser Doppler Vibrometry requires three basic assumptions [48]:
the shape of the considered vessel, the common carotid artery, can be assumed as a symmetric cylinder;
the deformation of the carotid can be considered as a symmetric radial displacement;
the values of diastolic pressure and mean arterial pressure are fairly constant through the arterial tree, while systolic pressure changes its value depending on the distance from the heart
The assumption of cylindrical shape has been used to consider the cross section of the vessel A(t) as follows:
4
2t
d
t
A
where d(t) is the vessel diameter, which was considered as the sum of two terms, as reported below:
t
d
d
d
0
where d0 is the vessel diameter at rest; its value was taken from the literature [49] [50],
while Δd is the diameter variation measured by LDV.
2.3 Carotid location
One of the critical issues of the present study is the correct localization of the common carotid artery over the neck of tests participants.
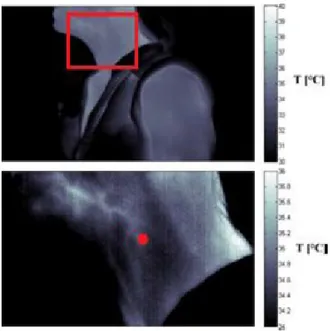
In fact, an incorrect localization of the measurement point causes an inaccurate assessment of the vessel vibration, and, consequently, the application of the calibration model to a signal which does not quantify accurately the vessel displacement. In a preliminary study, as reported in [40], a thermal camera (VarioCAM HD, InfraTec) was included in the test bench, in order to improve the identification of the optimal acquisition point. The inclusion of thermal imaging was based on the differential temperature distribution in the area of the carotid, supporting localization efforts.
Figure 11: measurement point localization by means of thermal camera
Thermal images were acquired asking the participants to sit quietly with the left side of the neck uncovered. An example of a thermal image, with a zoom on the carotid area, where it is possible to visualize the carotid bifurcation is reported below. The optimal LDV measurement point was located after a 20 s imaging period.
Figure 12: Thermal image (above) with a zoom on the carotid area (below, with the bifurcation marked with a red dot)
However, the differential temperature distribution did not always support correct detection of the measurement point, in fact when the blood pulse passes through the vessel, the heat spreads to the surrounding tissues, and it is not possible to identify the precise location of the carotid lumen.
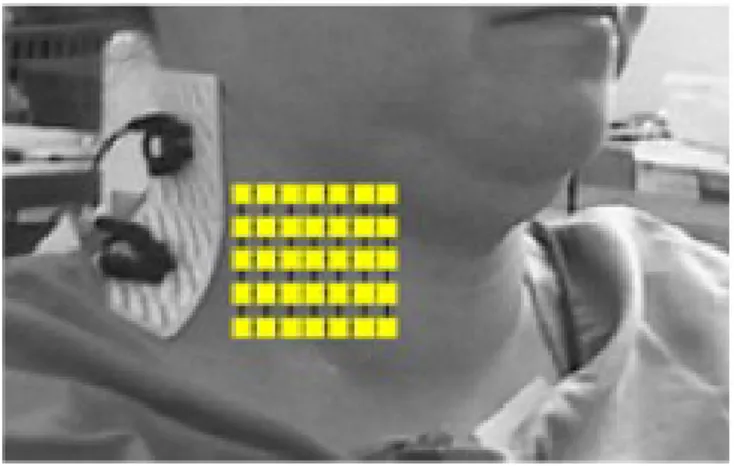
For this reason, a different approach has been proposed, as reported in [51]. Data measured by means of a scanning LDV system, Polytec PSV-300, were collected from 22 adult participants. Signals were obtained from a patch subtending 4.8 cm horizontally by 4.0 cm
vertically, which bounded 35 individual measurement points arranged in a 7 x 5 grid (horizontal spacing = 0.8 cm, vertical spacing = 1.0 cm).
Figure 13: representation of the measurement grid
Data were measured from each point for a 9 s period, starting at the upper left corner. After that, the Laser beam was advanced to consecutive points in a serpentine pattern. The LDV velocity pulses for all available beats within individual 9 s measurement periods were averaged, using the R wave in the ECG as reference for the synchronization. The basic idea was that the vibration amplitude related to the blood pulse over the carotid artery had to be greater with respect to the surrounding points. Therefore, the peak to peak amplitude was computed for each of the 35 averaged LDV waveforms.
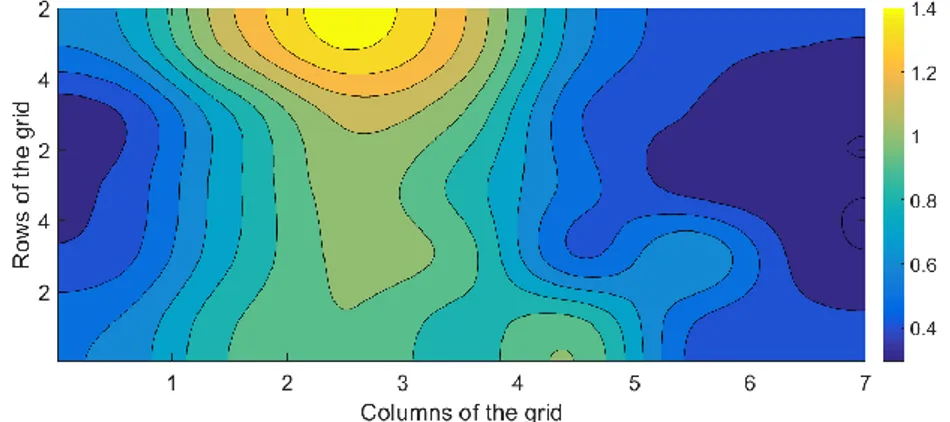
The 5x7 matrix with the peak to peak value was resampled in order to achieve the carotid maps.
Figure 14: averaged LDV signals of point 1 and point 3 (subject 1), above, and 5x7 matrix with the peak to peak values, below.
Figure 15: resampled carotid map (subject 1)
Most individuals showed a vertically oriented trace of maximum amplitude that is anatomically consistent with the location of the carotid.
There are, however, substantial individual differences in the path of the carotid. This suggests corresponding anatomical differences. The majority of participants showed maximum amplitude at the top locations. This is localized in a small zone in which the carotid is not overlaid with the sternocleidomastoid muscle, at the site of the bifurcation of the common carotid into the internal and external components. The level of variability is generally consistent with other reports based on imaging and anatomical methods [52]
[53].
Figure 16: Example of two different carotid path, participant 6 (left), participant 16 (right)
Vertical transmission of the pulse, revealed in most of the subjects, has been confirmed by the study of timing in the velocity peak measured by LDV.
Time delays in the velocity peak from bottom to top are consistent with the transmission of the pressure pulse over the carotid.
Figure 17 shows an example of LDV traces , participant 16, in a column of the measurement grid. It is possible to see the time delay in velocity peak from bottom to top.
Figure 17: the measurement grid,top, LDV traces of the fourth column and zoom on the area related to the velocity peaks, bottom.
2.4 Measurement setup
A first study,as reported in [48] [54] [55], has been conducted on 6 healthy participants. aged 26±3), whose characteristics are reported in the table below.
Height [m] Weight [kg] BMI [kg/m2] Subject 1 1.81 82 25.3 Subject 2 1.78 65 20.5 Subject 3 1.66 53 19.2 Subject 4 1.81 93 28.1 Subject 5 1.67 56 20.1 Subject 6 1.65 48 17.6
The experimental setup included the following instruments:
Laser Doppler Vibrometer (PDV 100, Polytec, sensitivity of 0.2V/(mm/s)); Electrocardiograph (ECG) (ADInstruments MLA2540 5 Lead Shielded Bio Amp Cable).
LDV and electrocardiographic (ECG) signals were acquired simultaneously using a proper A/D board (12-bit); a conventional oscillometric method was used to assess simultaneous blood pressure at the brachial level (accuracy: ± 3 mmHg).
The participants were asked to lie supine and stay relaxed.
The vibrometer was placed on a tripod at a distance of 50 cm from the subject and it was pointed perpendicularly to the skin of the participant, over the left common carotid artery. A sketch of the measurement setup is represented in the figure below.
Figure 18: Setup scheme: ECG electrodes placed on the skin according to the standard positioned scheme of the I-lead ECG; LDV spot perpendicularly directed on the skin surface
Three repeated 1-minute measurements were made on each participant. The experimental setup included also a blood pressure meter using a proper cuff positioned on the subject’s left arm. It was used to measure Diastolic Blood Pressure, DBP, and Systolic Blood Pressure. SBP. at the brachial level. The achieved values were used to estimate Mean Arterial Pressure (MAP), by means of the following empiric formula:
DBP
SBP
MAP
2
3
1
Before each acquisition, three consecutive measurements of brachial blood pressure were performed and the average value of DBP and MAP were considered in the application of the calibration model.
A second study has been conducted on data collected from 22 healthy participants at Washington University in Saint Louis.
LDV signals were acquired by means of the scanning Laser system, Polytec PSV-300, described in section 2.3. Moreover an electrocardiograph and a radial tonometer were included in the measurement setup.
2.5 Signal processing
2.5.2 Preprocessing of LDV signal
The data processing procedure is reported in figure 19.
Figure 19: flow chart of the signal preprocessing procedure
Signal filtering:
LDV and ECG signals were filtered by means of a 3rd orderButterworth bandpass filter with the following cutoff frequencies: 0.1 Hz (high pass filter) and 40 Hz (low pass filter) for ECG; 0.1 Hz (high pass filter) and 30 Hz (low pass filter) for LDV.
Figure 20:raw LDV signal, above, filtered signal, below.
Integration and detrending of LDV: The
LDV signal was integrated in order to obtain a displacement signal from the measured velocity data. An operation of detrending was performed on the displacement signal to achieve a mean value equal to zero.The detrenting was applied to the signal in order to remove the linear trend caused by the operation of integration applied to LDV signal (performed to obtain a displacement trace).' The detrending was performed in Matlab environment, computing the least-squares fit of a straight line to the data and subtracting the resulting function from the data.'
Figure 21: Filtered LDV signal, above, integrated and detrended signal, below.
Detection of the single beats:
The ECG signal was used to correctly detect every single heartbeat in the LDV signal.An algorithm based on the geometric shape of the signal [40] was applied to the LDV displacement signal in order to detect the onset and offset of the LDV pulses associated with single heart beats. This algorithm performs the computation two straight lines on a small subset of points, by means of a moving window. Then, the angle included between the two straight lines was computed. Detecting local maxima of the angle time it was possible to locate the onset and the offset of the single displacement waveforms.
Then, each LDV pulse was re-sampled according to the mean heart period detected from ECG signal.
Figure 22: individuation of onset and offset in single displacement waveforms, green dots
Computation of the average LDV waveform:
the re-sampling of the single heartbeat allowed to calculate the average displacement waveform for each acquired signal.Figure 23: an example of average LDV displacement signal
2.5.2 Model implementation
The exponential model described in section 3.1 was applied to the average displacement signal; in this way, the calibrated pressure waveform was obtained. The algorithm used for the model implementation is reported in the following flowchart.
Figure 24: flowchart of the algorithm for the implementation of the exponential model
An iterative procedure composed by 50 cycles was performed: the stiffness value α depends on the carotid systolic pressure, as reported in section 3.1, therefore, a different α was computed at each cycle, and, starting from it, a correspondent pressure waveform was obtained, applying the exponential model reported in 2.1. The calibration procedure was based on the minimization of the following cost function:
MAPmeas
MAPcar
ERR
where MAPcar is the Carotid Mean Arterial Pressure, computed from the calibrated LDV
data, as reported in the formula below, and MAPmeas is the Mean Arterial Pressure,
measured at brachial or radial level. This starts from the assumption that MAP is fairly constant through the arterial tree.
Tp
t
dt
T
MAPcar
01
where T is the mean cardiac period.
Therefore, the LDV pressure waveform was chosen, among the 50 calibrated waveforms, as the one which minimized the cost function ERR.
An example of LDV pressure wave is reported in the following figure.
Figure 25: example of LDV pressure waveform
In order to estimate the uncertainty of the proposed method, it should be considered that the present procedure is composed of three main steps: measurement of the velocity of carotid vibration by means of LDV, integration of the LDV signal and application of the exponential model. It is important to emphasize that each of these steps produce a contribution to the total uncertainty µ.
Velocity measurement: The adopted LDV device, Polytech PDV 100, has an accuracy of
±0.2% in the frequency range 0.05 Hz-22 kHz [56].
Considering the ideal condition in which the device is pointed perpendicularly to the skin of the participant, the measured velocity value has an accuracy of around ± 0.02 mm/s.
Integration: the integration of the digital velocity signal has been performed by means of
the trapezoidal rule; it is one of a family of formulas for numerical integration called Newton–Cotes formulas [57]. The trapezoidal rule approximate the region under the graph of the function f(x) as a trapezoid and calculating its area:
b
ab
f
a
f
a
b
dx
x
f
2
where a and b are the integration's extremes. For a domain divided into N equally spaced intervals, the approximation becomes:
b
a N i k kx
f
x
f
N
a
b
dx
x
f
11
2
The trapezoidal approximation improves when the number of considered intervals increases. The error of the composite trapezoidal rule is the difference between the value of the integral and the numerical result [58]. It can be demonstrated that there is a value ξ in the [a,b] interval for which the error is given by:
''
12
2 2h
f
N
a
b
err
whereN
a
b
h
.Therefore, the trapezoidal approach underestimates the integral when the function is concave down and it overestimates the integral when the fuction is concave up.
Implementation of the model: Beyond the error intrinsic to the process of integration, errors
associated with the implementation of the exponential model must also be considered. p(t) is related to the displacement d(t) by the relationship:
) 1 4 ) ( ( 2
)
(
Ad t d de
p
t
p
assuming cylindrical shape of the vessel, as reported in sections 3.1 and 3.2. This is a case of uncertainty propagation: the uncertainty Δx of a certain variable x is known, there is a functional relationship y=f(x) between x and y, and it is required to evaluate the uncertainty Δy of the y variable [59]. The uncertainty Δy, for a given value x0 of x variable, is:
x
dx
df
y
x x
0Therefore, in the present case, the uncertainty Δp is given by:
t
d
t
d
d
A
e
p
p
d d d A d d d
0 2'
2
1 4
where Δd is the uncertainty in the measurement of the displacement of the vessel, d0 is a
Chapter 3
Results
3.1 Pressure waveforms comparison
The signal processing provided the displacement waveforms by means of the integration of the original LDV signal (i.e. a velocity signal). Subsequently, the averaged waveform was obtained by resampling the LDV pulse for each heartbeat to the mean cardiac period computed from the ECG signal. By applying the calibration model, the pressure waveform was obtained; its maximum was considered as the Systolic Carotid Pressure value. Such a pressure value is expected to be lower than the peripheral one, because of the contribution of the reflected waves. In [60] a study of systolic pressure amplification from carotid to peripheral artery was conducted. It has revealed an average systolic pressure reduction of 79 % in a male population of 72473 subjects, and an average systolic pressure reduction of 85 % in a female population of 52714 subjects. These results were adopted here to compare the LDV data, measured at the carotid level with the peripheral pressure (radial and brachial pressure for the first and the second measurement setup respectively, as reported in section 2.5).
Results of the first study
A comparison between the systolic pressure measured by means of the oscillometric cuff at brachial level and the one obtained from the calibration of the LDV signal has been performed as reported below.
Gender Brachial Systolic Pressure [mmHg] Reference Carotid Systolic Pressure [mmHg] LDV Carotid Systolic Pressure [mmHg]| Percentage Deviation [%] Subject 1 Male 111 88 84 -4 Subject 2 Female 126 100 104 4 Subject 3 Female 117 99 100 1 Subject 4 Female 107 91 92 1 Subject 5 Male 98 77 85 10 Subject 6 Female 99 84 80 -5 Average
110 90 91 4
Table II:Gender of the participants, Measured brachial systolic pressure, Reference carotid systolic pressure calculated as 0.79*Brachial Systolic Pressure for male participants and as 0.85*Brachial Systolic Pressure for female participants, LDV Carotid Systolic pressure, Percentage deviation between LDV systolic pressure and reference systolic value
Figure 26: comparison between reference systolic pressure and LDV systolic pressure
Results show an average deviation between LDV systolic pressure and reference systolic pressure of 4 %, with a maximum deviation of 10 % in subject 5.
Results of the second study
In this study, the pressure waveforms calibrated from the LDV signal are compared with the signals acquired from the radial artery by means of an arterial tonometer in 22 healthy subjects.
An example of comparison between the average pressure waveform from LDV and arterial tonometer is illustrated in the figure below.
Figure 27: average tonometric waveform (left), average LDV pressure waveform (right)
The results are reported considering a correction of the systolic tonometric peak, based on the results of [61], of 12 mmHg and 8 mmHg for male and female participants respectively, in order to compensate the amplification of maximum blood pressure from carotid to radial artery. This value was considered as the reference systolic pressure and it is compared here with the systolic peak of the LDV calibrated signal.
![Figure 1: Physiological variation in pressure waveform throughout the arterial tree [21]](https://thumb-eu.123doks.com/thumbv2/123dokorg/2969559.27176/19.892.239.697.191.323/figure-physiological-variation-pressure-waveform-arterial-tree.webp)
![Figure 4: The principle of measurement of an applanation tonometer [25]](https://thumb-eu.123doks.com/thumbv2/123dokorg/2969559.27176/21.892.335.607.801.946/figure-principle-measurement-applanation-tonometer.webp)
![Figure 6: amplitude of the oscillations measured by means of the oscillometric pressure meter [22]](https://thumb-eu.123doks.com/thumbv2/123dokorg/2969559.27176/23.892.312.619.790.953/figure-amplitude-oscillations-measured-means-oscillometric-pressure-meter.webp)