i
i
To my Wife Anna
i
TABLE OF CONTENTS
Abstract 1
Introduction 2
CHAPTER 1 : SOLID PHASE MICROEXTRACTION (SPME)
Introduction 3
1.1 Basic Theory of Solid-Phase Microextraction 5
1.2 Extraction Modes 7
1.3 Fiber Types 9
1.4 Optimization of Extraction 11
1.4.1 Extraction Time and Temperature 11
1.4.2 Ionic Strength 12
1.4.3 pH 13
1.4.4 Agitation 13
1.4.5 Sample Volume 14
1.4.6 Desorption Time and Temperature 15
1.5 Application of SPME 15
1.5.1 Environmental Applications 16
1.5.2 Food Application 17
1.5.3 Biomedical Application 18
References 20
CHAPTER 2 : DERIVATIZATION IN GAS-CHROMATOGRAPHY
Introduction 28
2.1 Alkylation 30
2.2 Silylation 33
2.3 Acylation 35
2.4 Derivatization with Alkyl Chloroformates 37
2.4.1 Derivatization of Amino Groups 38
2.4.2 Derivatization of Carboxylic Acids 40
ii
CHAPTER 3: DESIGN OF EXPERIMENTS
Introduction 50
3.1 Fundamental Principles 52
3.2 General Approach in DOE 55
3.3 General Guidelines for Conducting DOE 56
3.4 Types of Statistical Design 58
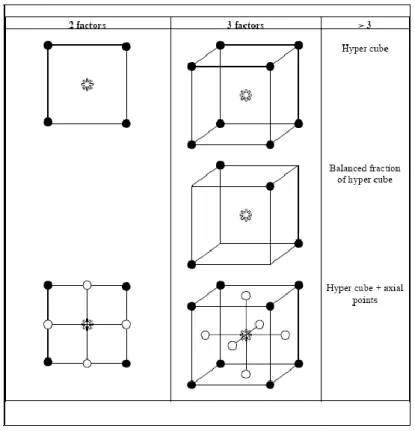
3.4.1 Factorial Design 59
3.4.2 Fractional Factorial Design 63
3.4.3 Central Composite Designs 66
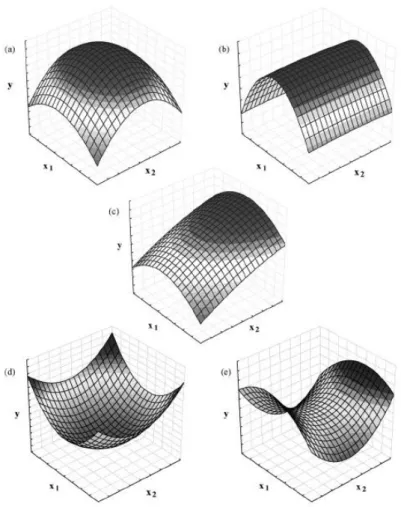
3.5 Response Surface Methodology (RSM) 68
References 70
CHAPTER 4 : RESULTS AND DISCUSSION
Introduction 71
4.1 Gas chromatography Triple Quadrupole (GC-QqQ-MS) 71
4.1.1 Detectors for Gaschromatography 72
4.1.2 Mass Spectrometer 72
4.1.3 Mass Analyzers: Triple Quadrupole 72
4.2 Development of Analytical Method for Clinical Diagnostics 75
4.3 Sarcosine as a Marker in Prostate Cancer Progression: A Rapid and Simple Method for its Quantification in Human Urine by Solid-Phase Microextraction–Gas Chromatography–Triple Quadrupole Mass Spectrometry
75
Introduction 75
4.3.1 Derivatization of Sarcosine 77
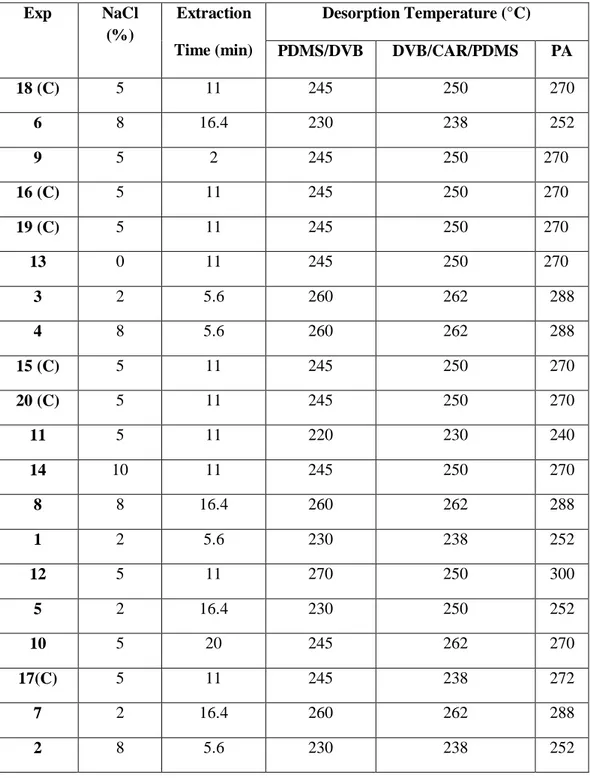
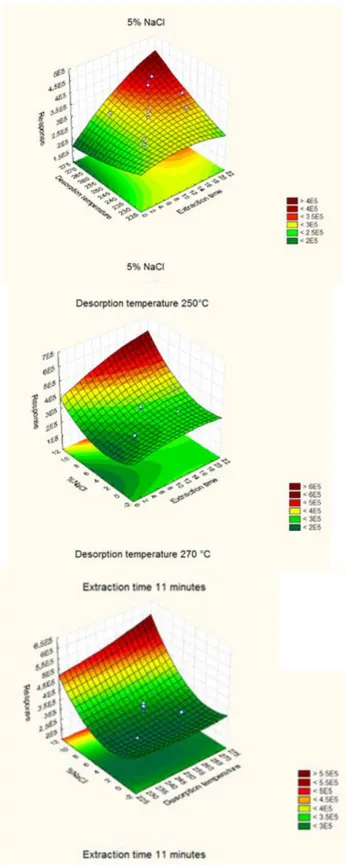
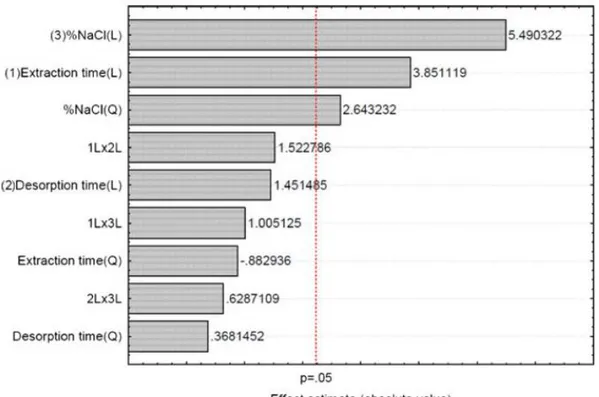
4.3.2 Optimization of SPME Conditions 78
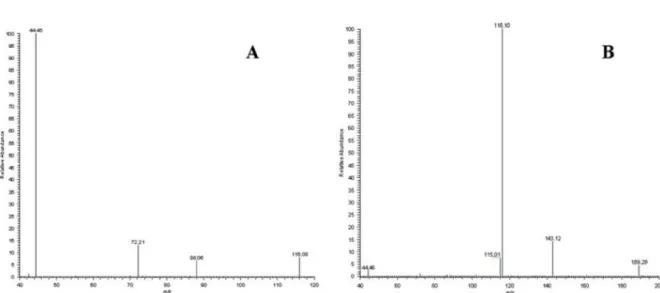
4.3.3 GC-QqQ-MS/MS Analysis 83
4.3.4 Analytical Performances 86
4.3.5 Application to Real Samples 87
4.3.6 Conclusion 87
4.4 A reliable and Simple Method for the Assay of Neuroendocrine Tumor Markers in Human Urine by Solid-Phase Microextraction Gas
Chromatography–Triple Quadrupole Mass Spectrometry
88
Introduction 88
4.4.1 Optimization of Solid Phase Microextraction Variables 89
iii
4.4.3 Analytical Performances 99
4.4.4 Application to Real Samples 100
4.4.5 Conclusions 102
4.5 Development of Analytical Method for Analysis of Pollutants in Aqueous Matrices
102
4.6 A Solid-Phase Microextraction-Gas Chromatographic Approach Combined with Triple Quadrupole Mass Spectrometry for the Assay of Carbamate Pesticides in Water Samples
103
Introduction 103
4.6.1 Optimization SPME and Gas Chromatographic Parameters 104
4.6.2 GC-QqQ-MS/MS Analysis 105
4.6.3 Analytical Performances 110
4.6.4 Application to Real Samples 112
4.6.5 Conclusions 114
4.7 A Rapid and Sensitive Assay of Perfluorocarboxylic Acids in Aqueous Matrices by Headspace Solid Phase Microextraction–Gas Chromatography– Triple Quadrupole Mass Spectrometry
114
Introduction 114
4.7.1 Derivatization of PFCAs 116
4.7.2 Optimization of SPME Variables 117
4.7.3 GC–QqQ–MS/MS Analysis 122
4.7.4 Analytical Performances 125
4.7.5 Application to Real Samples 127
4.7.6 Conclusions 129
References 131
CHAPTER 5 : EXPERIMENTAL SECTION 142
5.1 Sarcosine as a Marker in Prostate Cancer Progression: A Rapid and Simple Method for its Quantification in Human Urine by Solid-Phase Microextraction–Gas Chromatography–Triple Quadrupole Mass Spectrometry
142
5.1.1 Chemicals and Reagents 142
5.1.2 Instrumentation and Apparatus 142
5.1.3 Samples 143
iv
5.1.5 Optimization of SPME Variables 144
5.2 A reliable and Simple Method for the Assay of Neuroendocrine Tumor Markers in Human Urine by Solid-Phase Microextraction Gas
Chromatography-Triple Quadrupole Mass Spectrometry
144
5.2.1 Chemicals and Reagents 144
5.2.2 Instrumentation and Apparatus 145
5.2.3 Samples 146
5.2.4 Analytical Procedure 146
5.2.5 Optimization of SPME Variables 146
5.3 A Solid-Phase Microextraction-Gas Chromatographic Approach Combined with Triple Quadrupole Mass Spectrometry for the Assay of Carbamate Pesticides in Water Samples
146
5.3.1 Chemicals and Reagents 146
5.3.2 Instrumentation and Apparatus 147
5.3.3 Samples 148
5.3.4 Analytical Procedure 148
5.3.5 Optimization of SPME Variables 148
7 A Rapid and Sensitive Assay of Perfluorocarboxylic Acids in Aqueous Matrices by Headspace Solid Phase Microextraction–Gas Chromatography– Triple Quadrupole Mass Spectrometry
148
5.4.1 Chemicals and Reagents 148
5.4.2 Instrumentation and Apparatus 149
5.4.3 Samples 150
5.4.4 Analytical Procedure 150
5.4.5 Optimization of SPME Variables 151
List of Publications 152
- 1 -
Abstract
Il presente lavoro di tesi relativo all‘attività di ricerca svolta durante il triennio di dottorato ha riguardato la messa a punto di metodi analitici per la determinazione di analiti in due distinte aree di interesse. La prima di ambito clinico ed ha riguardato la quantificazione in urina di metaboliti riconosciuti come marker in diagnostica clinica. In particolare ci si occupati della sarcosina come biomarker del tumore alla prostata, e di tre acidi: acido omovanillico (HVA), acido vanilmandelico (VMA) ed acido 5-idrossindoloacetico (5-HIAA) come marker urinari del neuroblastoma. Il secondo ambito di lavoro ha riguardato la quantificazione di inquinanti in matrici acquose, vale a dire carbammati ed acidi perfluoroalchilici. In particolare gli analiti, previa derivatizzazione con alchilcloroformiati (eccetto i carbammati), sono stati estratti dalle matrici acquose (acqua e urina) tramite la tecnica della microestrazione in fase solida (SPME) e successivamente analizzati mediante un gascromatografo con analizzatore di massa a triplo quadrupolo (GC-QqQ-MS). Le variabili significative della microestrazione in fase solida in ciascun metodo sono state ottimizzate tramite l‘approccio multivariato dell‘ ― Experimental Design‖. L‘utilizzo della tecnica SPME ha consentito di poter estrarre gli analiti direttamente dal campione da analizzare minimizzando i tempi di preparazione dello stesso e riducendo l‘uso di solventi organici, ottenendo metodi poco costosi e basso impatto ambientale. L‘utilizzo dello spettrometro di massa triplo quadrupolo, ha consentito di raggiungere livelli di sensibilità molto elevati e, nel contempo, di identificare gli analiti con maggiore sicurezza. In tutti i metodi sviluppati, sono stati ottenuti ottimi risultati in termini di linearità accuratezza e precisione. Anche i valori dei limiti di rilevabilità (LOD) e dei limiti di quantificazione (LOQ) ottenuti in ciascun metodo possono essere considerati soddisfacenti.
- 2 -
Introduction
The development of new analytical methods is a very active field of research. Analytical methods involve various processes such as sampling, sample preparation, separation, detection and analysis of data. The most of analysis time is spent during the step of sampling and sample preparation such as extraction, concentration, fractionation, and isolation of analytes. Each additional step in analytical procedures, however, increases the possibility of loss of analyte, contamination of the sample and analytical error. Therefore, it is convenient to minimize the number of steps used in the preparation of the sample, but without lower the quality of the analysis. Often sample preparation involves various problems such as complicated operations, which require a lot of time, large amounts of sample and organic solvents organic.The latter ones cause environmental pollution, health hazards of the laboratory staff, as well as extra costs related to the disposal of these solvents.The possibility of improving each step of the analysis allows to obtaining protocols with as high performance reliability and sensitivity without increasing costs and working time. The purpose of this thesis is to develop analytical methods in which the analytes are extracted from aqueous matrices by SPME and analyzed using a gas chromatograph triple quadrupole (GC-QqQ-MS). The evaluation and optimization of the parameters affecting the methods were performed by the multivariate approach of the "experimental design". The application of the methods developed involves two specific areas of interest:clinical diagnostic and monitoring of pollutants.
- 3 -
CHAPTER 1
SOLID PHASE MICROEXTRACTION (SPME)
Introduction
The sampling is a crucial step in sample preparation. The objective of the sample preparation step is to isolate the components of interest from a sample matrix. Sample preparation involves extraction procedures and can also include ‗clean-up‘ procedures for very complex ‗dirty‘ samples. This step must also bring the analytes to a suitable concentration level for detection; therefore, sample preparation methods typically include enrichment.
Solid phase microextraction (SPME) was first introduced in 1990 by Pawliszyn and coworkers (1), and is a sampling technique wherein sample extraction and pre-concentration could be achieved in a single step.
The most widely used technique of sampling with solid phase microextraction consists of exposing a small amount of extracting phase (fiber coating) to the sample for a predetermined amount of time. The principle of SPME is based on the interactions of analytes between the sample matrix and the fiber coating via absorption or adsorption (depending on the nature of the coatings). The transport of analytes from the sample matrix to the fiber coating occurs immediately after contact between the two phases.
Commercial SPME devices consist of 2 major parts: a thin piece of fiber and a fiber holder. The fiber part is comprised of a tensioning spring, sealing septum, septum-piercing needle, fiber attachment needle, and fused-silica fiber, as shown in Figure 1
- 4 -
Figure 1. Commercial SPME Device Made by Supelco (2)
The fused-silica fiber, coated with a thin film of polymeric extraction phase, is mounted on the stainless-steel fiber attachment needle. It is protected by the septum-piercing needle. The septum-piercing needle is used for protecting the fiber during storage and carrying, and during the sampling procedure, the rigid stainless-steel material plays a dual rule by piercing the septum as well as protecting the fiber.
The fiber holder consists of a plunger, a barrel, a plunger retaining screw, a Z-lot, a hub viewing window, and an adjustable depth gauge. When sampling, the fiber is assembled into the holder, and the insertion depth (the length of fiber exposed during sampling or injection) is adjusted appropriately (2). SPME can be performed manually or by an autosampler. The fiber configuration of solid-phase microextraction (SPME) is best suited for
- 5 -
automation with gas chromatography (GC), due to its similarity to the traditional GC syringe for liquid injection. In principle, any autosampler that is able to perform syringe injection can be modified to be capable of automated SPME-GC.
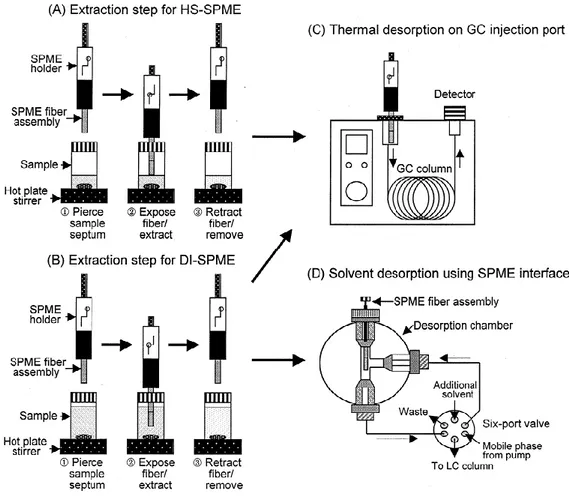
There are two typical SPME applications, sampling gases (headspace, HS) or sampling solutions (direct immersion, DI) In either case the SPME needle is inserted into the appropriate position the needle protecting the fiber is retracted and the fiber is exposed to the environment. The polymer coating acts like a sponge, concentrating the analytes by the absorption process After sampling, the fiber is retracted into the metal needle, and the next step is the transfer of the analyte from the fiber into the chromatography instrument. Gas chromatography (GC) is one of the preferred used techniques. In this case, thermal desorption of the analyte takes place in the hot GC injector. The main advantages of SPME extraction compared to solvent extraction are the reduction in solvent use, the combination of sampling and extraction into one step and the ability to examine smaller sample sizes.
1.1 Basic Theory of Solid-Phase Microextraction
Typically, SPME is considered to be complete when the analyte concentration has reached distribution equilibrium between the sample matrix and the fiber coating. Equilibrium extraction is the most frequently used quantification method for SPME. Equilibrium conditions in a two-phase system including extraction phase and aqueous matrix can be described according to the law of mass conservation (Equation 1.1)
C0sVs = C∞f Vf +C 0
s Vs Equation 1.1
Where C0s is the initial concentration of a given analyte in the sample, Vs is the sample volume, Vf is the fiber coating volume, and C
∞
f and C 0
- 6 -
equilibrium concentrations of the analyte in the fiber and the sample matrix, respectively. The fiber/sample matrix distribution coefficient Kfs is defined as: Kfs= C
∞ f / C
0
s Equation 1.2
Equations (1.1) and (1.2) can be combined and rearranged into :
Finally, the mass of the analyte absorbed by the fiber n = C∞f Vf can be described as
n= C0
Equation 1.4 indicates that the amount of analyte extracted onto the fiber coating is directly proportional to the analyte concentration in the sample. This is the analytical basis for quantification using SPME.
When the the volume of the sample is very large compared to the volume of the coating(Vs >> Kfs Vf ) the eqauation 1.4 becomes :
n = C0 Kfs Vf Equation 1.5
In Equation 1.5, the amount of extracted analyte is independent of the volume of the sample. Therefore, there is no need to collect a defined amount of sample prior to analysis. Thus, the fiber can be exposed directly to the ambient air, water, production stream, etc., and the amount of extracted analyte will correspond directly to its concentration in the matrix. This greatly accelerates the analytical process, while errors associated with the loss of
Kfs Vs Equation 1.3 Kfs Vf + Vs
C∞f = C0
Kfs Vf Vs Equation 1.4 Kfs Vf + Vs
- 7 -
analyte through decomposition or absorption onto sampling-container walls is prevented.When sample volume is very small, and the distribution coefficient of the analyte between the fiber coating and the sample matrix is very large (Vs << Kfs Vf ) as occurs when sampling of semivolatile organic compounds (semi-VOCs) in small volumes of a sample matrix, the equation 1.5 becomes:
n = Cs0Vs Equation 1.6
The equation 1.6 shows that all of the analytes in the sample matrix are extracted on to the fiber coating. Therefore, the analyte concentration in the sample can be easily calculated with the amount of analyte extracted by the fiber coating and the volume of the sample (3,4).
1.2 Extraction Modes
There are three basic modes of performing SPME-based on the position of the extraction fiber. They are: direct extraction (DI), headspace extraction (HS) and membrane protection extraction.
In the DI-SPME mode, the fiber is inserted into the sample medium and the analytes are transported directly to the extraction phase. For aqueous matrices, more efficient agitation techniques, such as fast sample flow, rapid fiber or vial movement, stirring or sonication are required. These actions are undertaken to reduce the effect caused by the ―depletion zone‖ which occurs close to the fiber as a result of fluid shielding and slow diffusion of analytes in the liquid media. In the headspace sampling mode, the analyte is transported through a layer of gas before reaching the coating. This protects the fiber coating from damage by high molecular weight substances and other non-volatile concomitants present in the liquid sample matrix,. The amount of analyte extracted at equilibrium using DI or HS sampling are identical as long as the sample and gaseous headspace volumes are the same. This is a result of
- 8 -
the equilibrium concentration being independent of the fiber location in the sample/headspace system. If the above condition is not satisfied, a significant sensitivity difference between the direct and headspace technique exists only for very volatile analytes.The extraction technique should be selected relative to the nature of the sample matrix. In general, DI-SPME is more sensitive than SPME for analytes predominantly present in a liquid. However, HS-SPME exhibits lower background than DI-HS-SPME, and is suitable for the extraction of more-volatile analytes in most gaseous, liquid and solid samples. In-tube SPME using an open tubular capillary column as the SPME device was developed to couple directing with HPLC or LC-MS With the in-tube SPME technique, organic compounds in aqueous samples are directly extracted from the sample into the internally coated stationary phase of a capillary column, and then desorbed by introducing a moving stream of mobile phase or static desorption solvent when the analytes are more strongly absorbed onto the capillary coating. The capillaries selected have coatings similar to those of commercially available SPME fibers.
- 9 -
Figure 2 : Extraction Process by HS-SPME and DI-SPME, and Desorption Systems for GC and HPLC Analyses (2)
1
.3 Fiber Types
Several types of coating fibers are currently available for the extraction of analytes. The fiber is coated with a thin polymeric film, which concentrates the organic analytes during absorption or adsorption from the sample matrix. The SPME coatings can be classified primarily into four categories: by the type of coating, by the coating thickness, by polarity and by whether the coating is an absorbent or an adsorbent. In the table 1 is shown a list of commercially available fibers.
- 10 -
Table 1 . Types of Commercially Available SPME Fibre Coatings
Type of Coating Extraction Mechanism Polarity
7µm PDMS Absorbent Non polar
30µm PDMS Absorbent Non polar
100µm PDMS Absorbent Non polar
85 µm PA Absorbent Polar
60µm PEG ( Carbowax) Absorbent Polar
15µm Carbopack Z-PDMS Absorbent Bipolar
65µm PDMS-DVB Absorbent Bipolar
55µm/30µm DVB/Carboxen-PDMS Absorbent Bipolar
85µm Carboxen-PDMS Absorbent Bipolar
CW - Carbowax DVB - Divinylbenzene PA - Polyacrylate
PDMS - Polydimethylsiloxane
The chemical structures of polymers commonly used as SPME coatings are shown in figure 3.
Figure 3 . Chemical structures of common polymers used as SPME coatings.
The polarity of the coating is determined by type of phase applied. Stationary phases are immobilized by non-bonding, partial linking or high cross-linking. Non-bonded phases are stable with some water-miscible organic
- 11 -
solvents (up to 20% organic content). Bonded phases are compatible with the majority of organic solvents except for some non-polar solvents (hexane, dichloromethane). Partially cross-linked phases are stable in most water-miscible solvents. Highly linked phases are equivalent to partially cross-linked phases, except that some bonding to the core has occurred. (5) Both PDMS and PA phases extract samples via the absorption of analytes, which dissolve and diffuse into the coating material. The remaining types (Carbowax–DVB, PDMS–Carboxen and PDMS–DVB) are mixed coatings and extract via adsorption of analytes staying on the surface (as a monolayer) of the fiber (6).The choise of appropriate fibre coating depending on the analyte polarity and volatility. The type of fibre used affects the selectivity of extraction: in general, polar fibers are used for polar analytes and non-polar fibers for non-polar analytes as with conventional GC stationary phase (5).
1.4
Optimization of Extraction
Several factors, in addition a fiber types influence the SPME efficiency and these are evaluated during method development. The primary parameters influencing analyte absorption into the stationary phase are extraction time and temperature, ionic strength, pH, sample volume and agitation. For SPME-GC, the analyte desorption is a function of time and temperature.
1.4.1 Extraction Time and Temperature
In the fiber SPME method, the amount of analyte extracted onto the fiber depends not only on the polarity and thickness of the stationary phase, but also on the extraction time and the concentration of analyte in the sample. An optimal approach to SPME analysis is to allow the analyte to reach equilibrium between the sample and the fiber coating. The equilibration time is defined as the time after which the amount of analyte extracted remains
- 12 -
constant and corresponds, within the limits of experimental error, to the amount extracted after an infinite time. Determination of the amount extracted at equilibrium allows calculation of the distribution constants. Extraction time is mainly determined by the agitation rate and the partition coefficient of of the analyte between the fiber coating and sample matrix. Although SPME has a maximum sensitivity at the equilibrium point, full equilibration is not necessary for accurate and precise analysis by SPME because of the linear relation ship between the amount of analyte adsorbed by the SPME fiber and its initial concentration in the sample matrix in non-equilibrium conditions (7). Extraction temperature is very important, especially for the extraction of semivolatile compounds.Temperature has a great influence on the vapor pressure of the analytes.Extraction temperature is closely related to equilibrium time because an increase of temperature results in an increase of Henry‟s Law constant and of the diffusion coefficient between the headspace and sample. This will lead to a decrease of the equilibrium time and will accelerate the analytical process considerably release of analytes from the sample matrix. An increase in extraction temperature causes an increase in extraction rate, and simultaneously a decrease in the distribution constant.
1.4.2 Ionic Strength
Typically, analyte solubility decreases as ionic strength increases. A decrease in analyte solubility improves sensitivity by promoting analyte partitioning into the stationary phase. This ―salting out‖ effect is compound-specific. The addition of salts is preferred for HS-SPME because the fiber coatings are prone to damage during agitation by DI-SPME. The effects of salt addition to enhance the extracted amount of an analyte by SPME have been studied in detail (8-10). Salting with the addition of sodium chloride is well known to improve extraction of organics from aqueous solution. Although salt addition
- 13 -
usually increases the amount extracted, the opposite behavior is also observed (11, 12). A high salt concentration in the sample matrix facilitates salt deposition on the fiber which decreases extraction efficiency over time by DI-SPME (13, 14). In general, the effects of salt addition increase with the polarity of the compound.
1.4.3 pH
Matrix pH can be adjusted to optimize the SPME of acidic and basic analytes. Extraction efficiency for acidic compounds increases as pH decreases. At low pH, the acid-base equilibria of acidic compounds are shifted towards the neutral form and analyte partitioning into the stationary phase is enhanced. Conversely, basic compounds shift towards the ionized from as pH decreases and extraction efficiency decreases. Generally, extraction is more effective if the compounds are kept undissociated, which is similar to the LLE and SPE procedures. In DI-SPME, contact of the fiber with high and low pH solution would increase damage to the coating.
1.4.4 Agitation
The analyte equilibrium between the sample matrix and the stationary phase depends on the rate of mass transfer of the analytes in the aqueous phase. So, agitation is required to facilitate mass transport between the bulk of the aqueous sample and the fiber. Although the equilibration time progressively decreases with increasing agitation rate, faster agitation tends to be uncontrollable and the rotational speed might cause a change in the equilibration time and poor measurement precision. Several agitation methods can be used in SPME, depending on the type of application: magnetic stirring, intrusive stirring, needle vibration, moving vial (vortex stirring), flow-through
- 14 -
stirring, sonication and orbital shaking. Table 2 summarizes the properties of several agitation methods which have been tested with SPME (15).
Table 2: Agitation methods in SPME
Method Advantages Disvantages
Static (no agitation)
Simple ,performs well for gsaseous phase
Limited to volatile analytes and HS-SPME Magnetic stirring Common equipement, good
performance
Requires stirring bar in the vial
Intrusive stirring Very good performance Difficult to seal the sample Vortex/moving
vial
Good performance, no need
for stirring bar in the vial Stress on needle and fiber Fiber moviment Good performance, no need
for a stirring bar in the vial
Stress on needle and fiber, limited to small volume Flow through Good agitation at rapid
flows
Potential for cross contamination, requie
constant flows Sonication Very short extraction times Noisy, heats up the sample
1.4.5 Sample Volume
The sensitivity achieved with SPME methodology is dependent solely on the number of moles of analyte extracted from the sample. When sample volume is large, the amount of analyte extracted is an insignificant portion of the total amount of analyte in the system. Therefore, analyte concentration in the sample remains constant during extraction, resulting in optimum sensitivity and better precision because the variation in sample volume does not affect the amount of analyte extracted. When sample volume is small, a substantial depletion of sample concentration occurs during extraction, resulting in loss of sensitivity and precision. In HS-SPME, the volume and sample/gas contact area affects the kinetics of the process, since the analytes need to be
- 15 -
transported through the interface and the headspace, in order to reach the fiber. The smaller the gas phase is with respect to the sample, the more rapid is the transport of analytes from the sample matrix to the fiber coating.
1.4.6 Desorption Time and Temperature
Efficient thermal desorption of an analyte in a GC injection port is dependent on the analyte volatility, the thickness of the fiber coating, injection depth, injector temperature and exposure time.
For a regular liquid sample injection in a split/splitless injector, the insert has to have a large volume (3-5 mm i.d.) because of the solvent expansion Since little or no solvent is present in the case of SPME, a narrow bore (0.75 mm i.d.) unpacked injection liner is required to ensure a high liner gas flow, to reduce desorption time and prevent peak broadening. Injections are carried out in the splitless mode to ensure complete transfer of analyte to increase sensitivity(4).Generally, the optimal desorption temperature is approximately equal to the boiling point of the least volatile analyte. To prevent peak broadening, the initial GC column temperature should be kept low, or even cooled. Thus, pre-concentration of analytes at the head of the column is achieved.The desorption time depends on the injector temperature and the linear flow rate around the fiber. For non-polar, volatile compounds, desorption is virtually complete in a few seconds, but the desorption should be continued for another one or two minutes to ascertain that no carryover occurs when a blank is inserted after a sample.
1.5 Application of SPME
The SPME technique has been widely used for analysis of different compound in several areas of interest. Many methods have been developed in the recent years in environmental, food and biological analysis. SPME is generally applied to analysis of
- 16 -
organic compound and can be applied for the extraction of various analytes from several types of matrices. SPME is often used for the analysis of environmental pollutants in air, water, soil and sediment samples, in biomedical analysis and food quality and safety control.
1.5.1 Environmental applications
SPME had been widely used for analysis of environmental pollutants in air, water, soil, and sediment samples, hundreds of papers addressing environmental analysis by SPME were published in recent years. The majority of applications have been developed for aqueous matrices in particular for analysis of BTEX, PAH (16-22), pesticides and herbicides (23-25). Derivatization techniques have been used for analysis of organometallic compounds (26-33), phenols (34) , aromatic amines (35,36) and other compounds (37,38) in aqueous samples. Aqueous sampling by SPME can be performed by direct immersion (DI), the headspace (HS) method. SPME is also used for the determination of trace contaminants in air (39-42). The analytes are extracted by the SPME fiber either by direct exposure or by use of the headspace method. Most applications involve the use of a commercial SPME fiber. Generally, the sensitivity of the HS-SPME procedure can be improved by manipulation of the matrix (e.g. addition of acetone–water (70: 30)) (43). Most SPME air sampling is performed on-site or in the laboratory by collecting the air sample in a bag or solid phase extraction (SPE) device; the analytes are extracted by the SPME fiber either by direct exposure or in the headspace (HS).
Sampling of soil and sediments by SPME is normally performed by the HS or DI methods. Different procedures have been described for quantitative analysis of solid samples such as soils sediments and sludges. HS-SPME is used for analysis of alkylbenzenes, aromatic amines,(44) chlorophenols,(45) phthalates,(46,47) PAHs and hexachlorobenzenes in soils, (48-50)
- 17 -
organometallics in sediments(51) and alkylphenol ethoxylate surfactants in sludges.(52) The analysis by DI-SPME is performed by immersion of the fibre in solid solution (50–52) or in an aqueous extract of the solid.(48, 49).
1.5.2 Food Application
Food analysis is important for the evaluation of nutritional value, for quality control of fresh and processed products and the monitoring of food additives and other toxic contaminants. There are many methods in the literature using the SPME for the analysis of various components and contaminants in food samples. Aroma and flavor are one of the most important quality criteria of fresh and processed foods, and both qualitative and quantitative information is desired for characterizing aroma producing compounds (2). In general, flavour is sensitive to compositional alterations. In the case of food (fruit, wine, etc.) flavours the volatile aromatic compounds are produced through metabolic pathways during ripening, harvest, post-harvest and storage, and their production depends on many factors related to the species, variety and type of technological treatment.(53,54). Foodstuffs are prone to deterioration by light, heat, oxidation and contamination from the container during storage. Extensive research is being focused on the early detection of microorganisms responsible for food contamination and spoilage, and thus, preventing the outbreak of food-borne calamities. SPME has been used for the extraction of volatiles due to the action of spoilage microorganisms in potatoes and cured ham (55), wheat grain (56, 57), milk (58), and pathogenic organisms (59-61). SPME can serve as a key tool in investigating the presence or absence of desired favor compounds in a particular food product and hence be of immense help in quality control. Some investigations on the use of SPME to extract volatiles from food additives and flavorings regard honeys (62) spices (63) virgin olive oil (64) cane and beet sugars (65) rapeseed oil (66).
- 18 -
HS-SPME is one of the most popular extraction techniques for the characterization of different alcoholic drinks based on their volatile composition (67-71) or to extract specific trace components from the HS (72,73). One of the most important and well-studied areas of the food analysis is the analysis pesticides, herbicides, fungicides and other agrochemical products in foods. Various pesticide and fungicide residues in vegetables and fruits have been analyzed by SPME coupled with GC/MS (74-77).
1.5.3 Biomedical Application
Biomedical analyses of drugs, metabolites, poisons, environmental and occupational pollutants, disease biomarkers and endogenous substances in body fluids and tissues are important in the development of new drugs, therapeutic monitoring, forensic toxicology, patient diagnosis, and biomonitoring of human exposure to hazardous chemicals. In these analyses, sample preparation is essential for isolation of desired components from complex biological matrices and greatly influences their reliable and accurate determination. Solid-phase microextraction is an effective sample preparation technique that has enabled miniaturization, automation and high-throughput performance. The use of SPME has reduced assay times, as well as the costs of solvents and disposal (78). Urine is a relatively simple biological fluid to collect and is frequently used for drug screening, forensic purposes, monitoring workplace exposure to chemicals and other investigations as it contains the target analytes together with diagnostic metabolites (5). A variety of drugs (amphetamines, amphetamines, antihistamines, tricyclic antidepressants, (79) corticosteroides (80), organometallics,(81-83) inorganic mercury,(84-85) pesticides and industrial chemicals (86-87) can be measured in urine by SPME techniques. Various SPME methods, also has been developed in blood analysis. A range of compounds can be extracted and analysed such as industrial solvent residues (88), insecticides,(89) pesticides,
- 19 -
(90) amphetamines, anaesthetics, diazepines (91) and different drug metabolites. Amphetamine and related compounds are one of the ‗favourite‘ target components in SPME blood analysis, similar to urine analysis. Endogenous substances such as neurotransmitters, hormones and various bioactive compounds are useful as diagnostic or prognostic biomarkers in disorders or healthcare, and are often analyzed during population screening, disease diagnosis, and biomonitoring. For this purpose most methods have been used to analyze blood (92-95), urine (96-99) saliva (100-102), skin (103,104) and breathe (105-107). Hair analysis is frequently used for the long-term monitoring of drug and alcohol users.HS-SPME as the advantage of producing a high purity of the extract with no interferences. It is a convenient one-step method for the measurement of many lipophilic basic drugs such as nicotine, amphetamine and related compounds, local anaesthetics, phencyclidine, ketamine, methadone, tricyclic antidepressants and phenothiazines (108-113). In summary, SPME has proved to be a very useful complement to the analytical equipment in a biomedical laboratory and should always be taken into consideration when a method for an analyte has to be updated or introduced.
- 20 -
References
1. Arthur C.L., Pawliszyn J. Anal. Chem. 62 (1990) 2145.
2. Kataoka H, Lord H.L. Pawliszyn J. J. Chromatogr. A 880 (2000) 35 –62
3. Zhang Z., & Pawliszyn, J. Anal. Chem 65 (1993) 1843–1852.
4. Pawliszyn J., Pawliszyn B., Pawliszyn M., Solid Phase
Microextraction SPME 1 / Vol . 2, N. 4 The Chemical Educator
5. Vas G., Vekey K., J. Mass Spectrom. 39 (2004) 233–254 6. Chen J., Pawliszyn J., Anal. Chem. 67 (1995) 2530
7. Ai J., Anal. Chem. 69 (1997) 1230.
8. Zambonin, C.G., Cilenti, A. , Palmisano F., J. Chromatogr. A. 967 (2002) 255-260.
9. Zuin,VG., Lopes, A.L., Yariwake, J.H., Augusto F. J. Chromatogr.
A 1056 (2004) 21-26.
10. Beltran J., Peruga, A., Pitarch, E., Lopez, F.J., Hernandez, F. Anal.
Bioanal. Chem. 376 (2003). 502-511
11. Magdic, S. and Boyd-Boland, A. J. Chromatogr. A 736 (1996) 219-228.
12. Scheyer A. Morville, S. Anal. Bioanal. Chem. 384 (2006) 475-487. 13. Jinno K. , Muramatsu, T. J. Chromatogr. A. 754 (1996) 137-144. 14. Berrada, H., Font, G., Molto, J.C. J. Chromatogr. A 890 (2000)
303-312.
15. Pawliszyn J., Handbook of Solid Phase Microextraction Elsevier
2012
16. Eisert R, Pawliszyn J. Anal. Chem. 69 (1997) 3140–3147
17. Gou Y., Eisert R., Pawliszyn J. J Chromatogr. A 873 (2000) 137– 147
- 21 -
18. Gou Y, Pawliszyn J. Anal. Chem. 72 (2000) 2774–2779
19. Gou Y., Tragas C., Lord H., Pawliszyn J. J Microcol. Sep. 12 (2000)125–134
20. Hirayama Y., Ohmichi M., Tatsumoto H. J. Health. Sci. 51(2005) 526–532
21. Takino M., Daishima S., Nakahara T. Analyst 126 (2001) 602–608 22. Kataoka H, Mitani K, Takino M Method Biotechnol 19
(2006)365–382
23. Penalver A., Pocurull E., Borull F., Marce R.M. J. Chromatogr. A 839 (1999) 253.
24. Natangelo M., Tavazzi S., Fanelli R., Benfenati E. J. Chromatogr.
A 859 (1999) 193.
25. Eisert R., Levsen K. J. Am. Soc. Mass Spectrom. 6 (1995) 1119 26. Le Gac M., Lespes G., Potin-Gautier M. J Chromatogr A 999
(2003)123–134
27. Arambarri I., Garcia R., Millan E. Chemosphere 51 (2003) 643– 649
28. Devos C., Vliegen M., Willaert B., David F., Moens L., Sandra P.
J. Chromatogr. A 1079 (2005) 408–414
29. Chou C.C., Lee M.R. J. Chromatogr. A 1064 (2005) 1–8
30. Centineo G., Blanco Gonzalez E., Sanz-Medel A. J. Chromatogr.
A 1034 (2004) 191–197
31. Parkinson D., Bruheim I., Christ I., Pawliszyn J. J. Chromatogr. A 1025 (2004) 77–84
32. Mishra S., Tripathi R.M., Bhalke S., Shukla V.K., Puranik V.D.
Anal. Chim. Acta 551 (2005) 192–198
33. Abranko L., Yang L., Sturgeon R.E., Fodor P., Mester Z. J. Anal.
- 22 -
34. Urbanczyk A., Staniewski J. Chem. Anal. (Warsaw) 50 (2005) 749–759
35. Herraez-Hernandez R., Chafer-Pericas C., Campins-Falco P. Anal.
Chim. Acta 513 (2004) 425–433
36. Zimmermann T, Ensinger WJ, Schmidt T.C. Anal. Chem. 76 (2004)1028–1038
37. Salgado-Petinal C., Alzaga R, Garcia-Jares C., Llompart M., Bayona J.M. Anal. Chem. 77 (2005) 6012–6018
38. Tsai S.W., Chang C.M. J. Chromatogr. A 1015 (2003)143–150 39. Svendsen MR, Glastrup J. Atmos. Environ. (2002) 36 3909.
40. De Angelis F., 21st Informal Meeting on Mass Spectrometry, May 11–15 (2003), Antwerp, Book of Abstracts. 69.
41. Hook G.L., Kim G.L., Hall T., Smith .PA. Trends Anal. Chem. 21 (2002) 534.
42. Tuduri L., Desauziers V., Fanlo J.L. J. Chromatogr. A 963 (2002) 49.
43. Sarrion M.N., Santos F.J., Galceran M.T. J. Chromatogr. A 819 (1998) 197.
44. Müller L., Fattore E., Benfenati E. J. Chromatogr. A 791 (1997) 221.
45. Ribeiro A., Neves M.H., Almeida M.F., Alves A., Santos L. J.
Chromatogr. A 975 (2002) 267.
46. Luks-Betlej K., Popp P., Janoszka B., Paschke H. J. Chromatogr.
A 938 (2001) 93.
47. Penalver A., Pocurull E., Borrull F., Marce R.M. J. Chromatogr. A 872 (2000) 191.
48. Pino V., Ayala J.H., Afonso A.M., Gonzalez V. Anal. Chim. Acta 477 (2003) 81.
- 23 -
49. Popp P., Kalbitz K., Oppermann G. J. Chromatogr. A 687 (1994) 133.
50. Boyd-Boland A.A., Magdic S., Pawliszyn J. Analyst 121 (1996) 929.
51. Tutschku S., Mothes S., Wennrich R., Fresenius J. Anal. Chem. 354 (1996)587.
52. BoydBoland A.A., Pawliszyn J. Anal. Chem. 68 (1996) 1521. 53. Vas G., Lorincz G. Acta Aliment. 28 (1999) 95.
54. Vas G., Koteleky K., Farkas M., Dobo A., Vekey K. Am. J. Enol.
Vitic. 49 (1998) 100.
55. Jones, P.R.H., Ewen, R.J., Ratcliffe, N.M. J. Food Comp. Anal. 11 (1998) 274–279.
56. Jelen H.H., Majcher M., Zawirska-Wojtasiak R., Wiewiorowska M., Wasowicz E. J. Agric. Food Chem. 51 (2003) 7079–7085. 57. Turner N.W., Subrahmanyam, S., Piletsky S.A. Anal. Chim. Acta,
632 (2009) 168–180.
58. Marsili R.T. J. Agric. Food Chem. 47 (1999) 648–654.
59. Senecal A.G., Magnone J., Yeomans W., Powers, E.M., (2002).
Proceedings of the SPIE, Edited by Jensen J. L. and Burggraf L.
W., 4575, 121–131
60. Syhre M., Chambers S.T. Tuberculosis 88 (2008) 317–323.
61. Schilling, M.W., Yoon Y., Tokarskyy O., Pham A.J., Williams, R.C., Marshall D.L.. Meat Science, 85 (2009) 705–710.
62. Perez R. A., Brunete C.S., Calvo, R.M., Tadeo J.L. J. Agric. Food
Chem. 50 (2002) 2633–2637.
63. Maroto M.C.D., Coello M.S.P., Cabezudo, M.D. Chromatographia 55(11/12) (2002) 723–728.
- 24 -
64. Vichi S., Castellote A. I., Pizzale L., Conte L.S., Buxaderas S., Tamames, E.L. J.. Chrom. 983 (2003) 19 33.
65. Batista, R.B., Grimm, C.C., Godshall, M.A. J. Chrom. Sci, 40 (2002)127–132.
66. Jelen H.H., Mildner-Szkudlarz S., Jasinska I., Wasowicz E. J. Am.Oil Chem. Soc. 84(6) (2007) 509–517.
67. Vas G., Koteleky K., Farkas M., Dobo A., Vekey K., Am. J. Enol.
Vitic. 49 (1998) 100.
68. Jelen H.H., Wlazly K., Wasowicz E., Kaminski E. J. Agric. Food
Chem. 1998; 46: 1469.
69. Pino J., Marti M.P., Mestres M., Perez J., Busto O., Guasch J. J.
Chromatogr. A 954 (2002) 51.
70. Vas G.. Supelco Rep. 16(4) (1997) 7. 71. Ebeler S.E. Food Rev. Int. 17 (2001) 45.
72. Evans T.J., Butzke C.E., Ebeler S.E. J. Chromatogr. A; 786 (1997) 293.
73. Luan T., Li G., Zhang Z. Anal. Chim. Acta 424 (2000) 19.
74. Navalon A., Prieto A., Araujo L., Vilchez J.L. J. Chromatogr. A, 975 (2002) 355.
75. Ahmed E.F. Trends Anal. Chem. 20 (2001) 649.
76. Wu J., Tragas C., Lord H., Pawliszyn J. J. Chromatogr. A 976 (2002)357.
77. Hu R.W., Hennion B., Urruty L., Montury M. Food Addit. Contam. 16 (1999) 111.
78. Kataoka H., Saito K., J. Pharm. Biomed. Anal. 54 (2011) 926– 950
79. Imaizumi M., Saito Y., Hayashida M., Takeichi T., Wada H., Jinno K. J. Pharm. Biomed. Anal. 30 (2003) 1801.
- 25 -
80. Volmer D.A, Hui J.P.M. Rapid Commun. Mass Spectrom.; 11(1997) 1926.
81. Wooten J.V., Ashley D.L., Calafat A.M. J. Chromatogr. B; 772 (2002) 147.
82. Mester Z., Pawliszyn J. J. Chromatogr. A 873 (2000) 129.
83. Rodil R., Carro A.M., Lorenzo R.A., Abuin M., Cela R. J.
Chromatogr. A 963 (2002) 313.
84. Dunemann L., Hajimiragha H., Begerow J. Fresenius‘ J. Anal.
Chem.; 363 (1999) 466.
85. Guidotti M., Vitali M. J. High Resolut. Chromatogr. 21 (1998) 665.
86. Fustinoni S., Giampiccolo R., Pulvirenti S., Buratti M.,Colombi A.
J. Chromatogr. B 723 (1999) 105.
87. Bergamaschi E., Brustolin A., De Palma G.,Manini P.,Mozzoni P., Andreoli R., Cavazzini S., Mutti A. Toxicol. Lett. 108 (1999) 241. 88. Liu J.T., Hara K., Kashimura S., Hamanaka T., Tomojiri S.,
Tanaka K. J. Chromatogr. A; 731 (1999) 217.
89. Namera A., Yashiki M., Nagasawa N., Iwasaki Y., Kojima T.
Forensic Sci. Int.; 88 (1997) 125.
90. Kusakabe T., Saito T., Takeichi S. J. Chromatogr. B 761 (2001) 93.
91. Mullett W.M., Levsen K., Lubda D., Pawliszyn J. J. Chromatogr.
A 963 (2002) 325.
92. Musteata F.M., Musteata M.L., Pawliszyn J., Clin. Chem. 52 (2006) 708–715.
93. Es-haghi A., Zhang X., Musteata F.M., Bagheri H., Pawliszyn J.,
- 26 -
94. Zhang X., Es-haghi A., Musteata F.M., Ouyang G., Pawliszyn J.,
Anal. Chem. 79 (2007) 4507–4513.
95. Wen Y., Fan Y., Zhang M., Feng Y.Q., Anal. Bioanal. Chem. 382 (2005) 204–210.
96. Oliveira A.F., Maia P.P., Paiva. M.J., Siqueira, M.E., J. Anal.
Toxicol. 33 (2009) 223–228.
97. Poli D., Manini P., Andreoli R., Franchini I., Mutti A., J.
Chromatogr. B 820 (2005) 95–102.
98. Salgado-Petinal C., Lamas J.P., Garcia-Jares C., Llompart M., Cela R., Anal. Bioanal. Chem. 382 (2005) 1351–1359.
99. Saito K., Yagi K., Ishizaki A., Kataoka H., J. Pharm. Biomed.
Anal. 52 (2010) 727–733
100. Djozan D., Baheri T., J. Chromatogr. Sci. 48 (2010) 224–228. 101. Cha D., Cheng D., Liu M., Zeng Z., Hu X., Guan W., J.
Chromatogr. A 1216 (2009) 1450– 1457.
102. Kataoka H., Inoue R., Yagi K., Saito K., J. Pharm. Biomed. Anal. 49 (2009) 108–114.
103. Zhang Z.-M., Cai J.-J., Ruan G.-H. Li G.-K, J. Chromatogr. B 822 (2005) 244–252.
104. Schulz K., Schlenz K., Malt S., Metasch R., Römhild W., Dressler J., Lachenmeier D.W., J. Chromatogr. A 1211 (2008) 113–119.
105. Fuchs P., Loeseken C., Schubert J.K, Miekisch W., Int. J. Cancer 126 (2010) 2663–2670.
106. Ligor M., Ligor T., Bajtarevic A., Ager C., Pienz M., Klieber M., Denz H.,.Fiegl M, Hilbe W., Weiss W., Lukas P., Jamnig H., Hackl M., Buszewski B., Miekisch W., Schubert J., Amann A.,
- 27 -
107. Buszewski B., Ulanowska A., Ligor T., Denderz N., Amann A.,
Biomed. Chromatogr. 23 (2009) 551–556.
108. Sporkert F., Pragst F., Forensic Sci. Int. 107 (2000) 129.
109. Gentili S, Torresi A, Marsili R, Chiarotti M, Macchia T. J.
Chromatogr. B 780 (2002) 183.
110. Liu J.T., Hara K., Kashimura S., Kashiwagi M., Kageura M., J.
Chromatogr. B 758 (2001) 95.
111. Sporkert F., Pragst F., J. Chromatogr. B 746 (2000) 255.
112. Pragst F, Spiegel K, Sporkert F, Bohnenkamp M., Forensic Sci.
Int. 107 (2000) 201.
113. Hartwig S., Auwarter V., Pragst F., Forensic Sci. Int. 131 (2003) 90.
- 28 -
CHAPTER 2
DERIVATIZATION IN GAS-CHROMATOGRAPHY
Introduction
Derivatization in gas chromatography (GC) is necessary when the compounds to be analyzed are not quite volatile. For example conversion of analytes into volatile derivatives allows to separate and analyze by GC amino acids, sugars , ecc. The presence of different polar groups in molecules is one the principal problem in GC. Groups with active hydrogen such as SH, OH, NH and -COOH capable to form hydrogen bonds are responsible both for the low volatility of the compounds and for other phenomena that make direct GC either difficult or impossible, e.g., strong adsorption on the support of the stationary phase and asymmetry of peaks eluted from it, and thermal and chemical instability of the compounds, which cause losses of the sample compounds in the chromatographic system, i.e., their non-quantitative elution or the elution of decomposition products (1). Since GC is used to separate volatile organic compounds, modification of the functional group of a molecule by derivatization enables the analysis of compounds that otherwise can not be readily monitored by GC. With the derivatization important aspects of GC as suitability, efficiency and detectability can be improved. Suitability is the form of compounds that is amenable to the analytical technique, for GC, it is a requirement that the compound to be analyzed should be volatile to gas chromatographic analysis conditions.
Efficiency is the ability of the compound of interest to produce good peak resolution and symmetry for easy identification and practicability in GC analysis. Interactions between the compounds themselves or between the
- 29 -
compounds and the GC column may reduce the separation efficiency of many compounds s and mixtures. Derivatization of analyte molecules can reduce these interactions that interfere with analysis. Detectability is the outcome signal that emanates from the interaction between the analyte and the GC detector. Increasing the amounts of materials will impact the range at which they can be detected in Gas chromatography. This can be achieved either by increasing the bulk of the compound or by introducing onto the analyte compound, atoms or functional groups that interact strongly with the detector and hence improve signal identification. Detectability is the outcome signal that emanates from the interaction between the analyte and the GC detector. Increasing the amounts of materials will impact the range at which they can be detected in Gas chromatography. This can be achieved either by increasing the bulk of the compound or by introducing onto the analyte compound, atoms or functional groups that interact strongly with the detector and hence improve signal identification (2). Derivatizations in GC sample preparation are micro-scale synthetic reactions that commonly replace active hydrogens in functional groups with less polar and thermally stable groups. Chemical reactions that are frequently employed to achieve this include silylation, alkylation, acylation and various condensation reactions. Several functional groups may be affected by a single reaction, such as silylation occurring on carboxyl, hydroxyl, and amine functionalities. Alkylation can form ethers, esters and enol ethers from hydroxyls, carboxyls and carbonyls respectively. The type of derivatizing reagent utilized and the selection of reaction conditions determine the reactivity toward a specific functional group. The main requirement for a successful derivatization reaction are: a single derivative should be formed for each compound; the derivatization reaction should be simple and rapid, and should occur under mild condition; the derivative should be formed with a high and reproducible yield and should be
- 30 -
stable in the reaction medium; in quantitative analyses, the calibration curve should be linear (3).
Derivatization reactions used in gas chromatography can be classified in three general reaction types; Alkylation of which the general process is esterification, Silylation and Acylation.
2.1 Alkylation
Alkyl derivatives are formed by the replacement of active hydrogen with an alkyl or aryl group to form esters and ethers. The main functional group subjected to alkylation reactions are carboxylic acid, phenols, alcohols and thiols. Ammines, amides and sulfonylamides may be also alkylated, but are considered better targets for silylation or acylation reactions. The most common reagents in alkylation reactions are low molecular weight alkyl halides (e.g. iodomethane, iodoethane, iodopropane etc.), followed by benzyl-and substituited benzyl bromides (e.g. pentafluorobenzyl bromide, PFBBr). Most of the alkylation reactions using these reagents take place in the presence of a catalyst such a dry potassium carbonate, sodium hydride, silver oxide etc. alkyl derivatives show good chromatographic performance an due to the possible selection of relatively small alkyl groups can derivatize sterically hindered groups.(4-7). Alkylation of carboxylic acids can also be achieved by esterification with alcohols. Methanol or ethanol containing an acidic catalyst, such as hydro chloric acid, sulfuric acid or boron trichloride, have been used to form methyl or ethyl esters (8-9). Diazoalkanes have been used to alkylate moderately acidic functional groups, such as carboxylic and sulfonic acids, phenols and enols. Lewis acids, such as boron trifluoride etherate, have been used as catalysts to promote the alkylation of less reactive hydrogens, such as aliphatic alcohols, but their use is not recommended for extremely acid-labile compounds.
- 31 -
The range of possible reaction is extensive; the possibility of side reactions during alkylation of new compounds with diazoalkanes should be interpreted with care. Diazomethane is the diazoalkane most frequently used (10-12). Diazomethane (N2CH2) is the quickest and cleanest method available for the
preparation of analytical quantities of methyl esters. The reaction of diazomethane with a carboxylic acid is quantitative and essentially instantaneous in ether solutions. In the presence of methanol as catalyst, diazomethane reacts rapidly with fatty acids, forming methyl esters. The derivatization reaction of carboxylic acids to methyl esters with diazomethane can be represented as follows:
RCOOH + -CH2N+N→ RCOOCH3 + N2
Pentafluorobenzyl bromide (C7H2F5Br) and also
Pentafluorobenzyl-hydroxylamine hydrochloride can be used to esterify phenols, thiols, and carboxylic acids. The general scheme of the reaction for C7H2F5Br is as
follows:
R`OR + C7H2F5Br → R`OC7H2F5 + RBr
When using benzyl bromide as a derivatizing, it reacts with the acid part of an alkyl acid to form an ester, and therefore increase the volatility of the analyte of interest. Benzyl bromide is used for the determination of long chain perfluorinated acids (13)
The following equation shows the chemical reactions of acetylation of perfluorooctanoic acid to the respective ester.
- 32 -
N,N-Dimethylformamide dialkyl acetals react with carboxylic acids, phenols and thiols to form the corresponding alkyl derivatives. The reagents are sensitive to moisture and the reaction must be performed under dry conditions. Dialkylacetals have a wider applicability for the derivatization of a number of functional groups containing reactive hydrogens. Because the principal reaction product is dialkylacetals (DMF), the isolation of the derivative is not required and the reaction mixture can be injected directly into the gas chromatograph (14)
The reaction between N, N-dimethylformamide dimethylacetal and Carboxylic acid is as follows:
CH3CH3NCHOROR + R`COOH → R`COOR + ROH + CH3CH3NCHO
Although carboxylic acids, phenols, and thiols react quickly with DMF, to give the corresponding alkyl derivatives, hydroxyl groups are not readily methylated.
Acidic compound can be derivatized in the anionic form, such as ionized carboxylic acids and sulfonamides (15-17) using extractive alkylation. The acidic substance is extracted as an ion pair with a quaternary ammonium hydroxide into an appropriate immiscible organic solvent. The alkylation reaction involving nucleophilic displacement with an alkyl halide occurs in the organic phase. Alkylation of acidic compounds can be carried out by thermal decomposition of quaternary alkylammonium salts of the acid in the heated injector port of the gas chromatograph. Tetramethylammonium droxide, trimethylanilinium hydroxide or phenyl tri methylammonium hydroxide are usually used to prepare methyl derivatives (18-21). The injector temperature should be set to 250–300°C.
- 33 -
2.2 Silylation
Silylation is probably the most widely used derivatization technique for GC– MS analyses (22-24). Silylation is the introduction of a silyl group into a molecule, usually in substitution for active hydrogen such as dimethylsilyl [SiH(CH3)2], t-butyldimethylsilyl [Si(CH3)2C(CH3)3] and
chloromethyldimethylsilyl [SiCH2Cl(CH3)2]. Replacement of active hydrogen
by a silyl group reduces the polarity of the compound and reduces hydrogen bonding. The silylated derivatives are more volatile and more stable and thus yielding narrow and symmetrical peaks (25). The silylation reaction is driven by a good leaving group, which means a leaving group with a low basicity, ability to stabilize a negative charge in the transitional state, and little or no back bonding between the leaving group and silicon atom (22). The mechanism involves the replacement of the active hydrogens (in OH, -COOH, -NH, -NH2, and –SH groups) with a trimethylsilyl group. Silylation then occurs through nucleophilic attack (SN2), where the better the leaving
group, the better the siliylation. The general reaction of silylation is shown figure 4.
Figure 4. General scheme reaction of silylation
Nearly all protic functional groups present in organic compounds can be converted to silyl ethers or esters. The ability of various functional groups to form silyl derivatives is as follows: alcohols > phenols > carboxylic acids > amines > amides.
The most common silylation procedure is trimethylsilylation. Higher alkyl homologous or halogen containing analogous have been used to increase
- 34 -
hydrolytic stability of the derivative, to improve detectability with some particular detectors, to improve resolution or to obtain mass spectra of higher diagnostic value (24,26).
The advantage of these derivatives is evident with compounds that have different functional groups in the molecule: all groups are converted into the derivative in a one-step reaction. However, it should be noted that silyl derivatives have not always been successful and are not such ideal derivatives as was originally expected (1)
Many methods for the preparation of TMS derivatives have been developed. Commercial reagents prepared for immediate use are available. Mixtures of reagents with solvents are supplied for methods elaborated for individual substrates.
Individual types of reagents can be classified into four groups
(i) trimethylchlorodisilane, pure or with an acceptor of the acid or with a catalyst;
(ii) hexamethylsilazane (HMDS), mostly with addition of
trimethylchlorosilane (TMCS) as a catalyst;
(iii) silylamines, such as trimethylsilyldiethylamine and
trimethylsilylimidazole;
(iv) silylamides and others; N,O-bis(trimethylsilyl)acetamide (BSA), N,Obis(trimethylsily1)-trifluoroacetamide (BSTFA), and N-methyl-trimethylsilyltrifluoroacetamide, (MSTFA) are often used.(1)
HMDS is a mild reagent. It is used with the addition of TMCS, for the silylation of hydroxyl groups (27). Stronger reagents such as BSA (28) and BSTFA (29) are used for the silylation of less reactive groups (-NH2, -NH-) and of sterically hindered groups. N-methyl-trimethylsilyltrifluoroacetamide (MSTFA) is the most volatile of the trimethylsilyl acetamides. It is most useful for the analysis of volatile trace materials where the derivatives may be
- 35 -
near the reagent or by-product peak. The addition of a catalyst has been used to increase the silylating power of these reagents to derivatize sterically hindered functions or to enhance reaction rates. Trimethylchlorosilane (TMCS), trimethylsilylimidazole (TMSIm), trimethyliodosilane (TMSI), or potassium acetate have been used as catalysts (30). BSTFA with 1% TMCS as a catalyst has been widely used to analyze drugs of abuse and their metabolites (31-34). Pyridine or another solvent with a large solvation capacity (acetonitrile, dimethylformamide) are mostly used as solvents in the silylation reactions. Pyridine provides on some phases a broad tailing peak and can overlap lower components. In silylation derivatisation, anhydrous conditions are essential because the derivatives are decomposed by traces of water (1).
2.3 Acylation
Acylation is another widely used derivatization method in GC–MS. It consists of the introduction of an acyl group in a molecule holding reactive atom of hydrogen. Compounds that contain active hydrogens (e.g., OH, SH and -NH) can be converted into esters, thioesters and amides, respectively, through acylation (35). Acylation reactions can be performed using three main types of reagents: acyl halides, acid anhydrides or reactive acyl derivatives such as acylated imidazoles. The general reaction of acylation is shown in figure 5:
Figura 5 General scheme reaction of acylation
R-Y-H + R' X O R' Y O R + HX
- 36 -
Acyl halides are highly reactive and are very useful in case of compounds that are difficult to acetylate. When acyl halides are used, a basic acceptor for halides acid produced in the reaction is required. The elimination of the excess acylating reagent is preferable prior to GC analysis to prevent deterioration of the column. The use of acetic anhydride (AA), generally in the presence of pyridine as acidic acceptor may be preferred because the excess reagent is easier to remove. The strongly acidic conditions of the reaction medium when used acyl halides are and anhydrides can lead to undesirable side reactions (dehydration, enolization, etc.). Acylation of acid sensitive compound can be performed using reagents that have a high acylation reactivity, such as acylimidazoles, and in which the by-product of the reaction is a basic leaving group. Haloalkylacyl derivatives are the most common acyl derivatives.
Perfluoroacyl derivatives such as trifluoroacetyl (TFA), pentafluoropropionyl (PFP) and heptafluorobutyryl (HFB), are the most widely used in practice (3). The preparation of perfluoroacyl derivatives can be performed by re action with the appropriate acid anhydrides sometimes in the presence of a basic catalyst (36-40) or by reaction with perfluoroacylimidazoles. Alcohol and primary and secondary amines can be acetylated by imidazole reagents. These reagents are very sensitive to moisture and undergo hydrolysis, whereby when the derivatization products are stable enough, the excess reagent can be removed, by using a wash with an aqueous solution. N-methyl bis(trifluoroacetamide (BSTFA) or bis(trifluoroacetamide) (BSTFA) can be used for trifluoroacetylation, also under mild condition, of amine, hydroxyl and thiol groups (41) . These reagents are highly volatile and do not interfere in the GC analysis, and the reaction mixture can be directly analyzed with no adverse effects on GC column. Phenolalkylamines, hydroxy amines and
- 37 -
amino acids can be selectively derivatized as N-TFA-O-TMS (42-49) using MSTFA as trimethylsilylating reagent followed by MBTFA as trifluoroacylating agent. Also the extractive acylation was performed using different reagents. TFA derivatives of primary and secondary amines can be obtained using a mixture of ether and MBTFA at alkaline pH (50). Amines and phenols can be also derivatizated by extractive acylation using acetic anhydride or pentafluorobenzoyl chloride (51)
2.4 Derivatization with Alkyl Chloroformates
Alkyl chloroformates (figure 6) are compound known as rapid esterification agents. The chloroformates commonly used are those with simple alkyls, i.e. methyl, ethyl propyl or isobutyl.
R: methyl, ethyl propyl or isobutyl.
Figure 6. Alkyl chloroformate
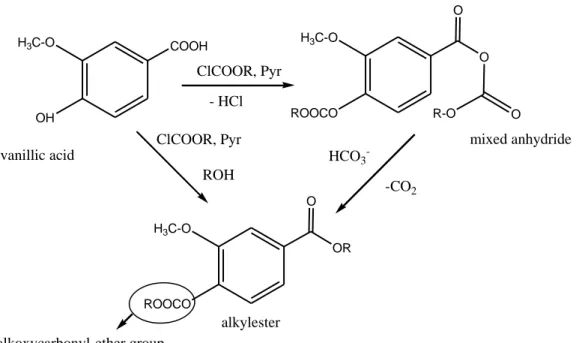
The alkyl chloroformate has been used for several years for trating ammino groups in GC, and later proved to be excellent for treating. Esterification of carboxylic acids, catalyzed by pyridine in the analytical microscale gives excellent results, in contrast to the poor results obtained with with chloroformate-mediated ester formation in organic chemistry.In addition of the catalizer an alcohol should also be present in the medium. Most derivatization reactions use apolar reagents contrary to that, chloroformates have been widely used for derivatization in aqueous media (52).
O O
R
O Cl
- 38 -
Optimizing the reaction conditions for various classes of carboxylic acids is possible to obtain a unique rapid derivatization of amino acids in aqueous medium. This allows the treatment of several analytes as acidic metabolites, or the simultaneous analysis of amino and fatty acids or of amines and their acidic catabolytes directly in the aqueous matrix.
2.4.1 Derivatization of Amino Groups
Chloroformates have been widely used to convert amines into carbamates in buffered aqueous media.
R’’: methyl, propyl , ethyl or isobutyl
Methylchloroformate (MCF) and ethylchloroformate (ECF) have been used in the early 80s for derivatize biogenic amines (53-55).
Many derivatization of amines have been performed using
isobuthylchloroformate (IBCF) because it represent the best compromise between a derivative of higher mass and one of greater stability. Urinary aliphatic amines (56) and 57 amines in aqueous samples (52) can be derivatized by extractive alkylation with IBCF in organic solvent and the analytes in basified water. Alkyl chloroformates can derivatize both the phenolic and the amino groups. In the latter‘ case the yeald of derivatization is pH- dependent. Some authors (57) reported maximal yields in the pH range 7–8.5, others introduced a pH shift from 7.5 to 9 or more to provide for phenolic hydroxyl and to improve reaction of the amine functions (58,59), or treated the amines at pH 12 (60). Another important application of chloroformate is the derivatization of amino acids. The first applications were
R' N H R + R''COOCl R' N R COOR''