https://doi.org/10.1038/s41391-021-00345-0 A R T I C L E
Clinical Research
Changes in body composition and lipid pro
file in prostate cancer
patients without bone metastases given Degarelix treatment: the
BLADE prospective cohort study
Carlotta Palumbo 1,2●Alessandro Antonelli2,3●Luca Triggiani4●Alberto Dalla Volta 5●Filippo Maffezzoni6● Stefania Zamboni2●Paolo Borghetti 4●Luca Rinaudo7●Francesca Valcamonico5●Roberto Maroldi 6● Stefano Maria Magrini4●Claudio Simeone2●Alfredo Berruti5●Collaborators
Received: 8 November 2020 / Revised: 8 February 2021 / Accepted: 22 February 2021 © The Author(s), under exclusive licence to Springer Nature Limited 2021
Abstract
Background Luteinizing hormone-releasing hormone (LHRH)-agonists in prostate cancer (PCa) patients induce sarcopenic obesity. The effect of LHRH-antagonist on body composition has never been explored. We evaluated changes in fat (FBM) and lean body mass (LBM) in PCa patients undergoing Degarelix.
Methods This is a single-center prospective study, enrolling 29 non-metastatic PCa patients eligible to LHRH-antagonist from 2017 to 2019. All patients received monthly subcutaneous injection of Degarelix for 12 months. Changes in FBM and LBM between baseline and 12-month Degarelix, as measured by dual-energy x-ray absorptiometry, were the co-primary endpoints. Secondary endpoints were changes in serum lipids, glucose profile and follicle-stimulating hormone (FSH). Appendicular lean mass index (ALMI) and ALMI/FBM ratio were assessed as post-hoc analyses. Linear mixed models with random intercept tested for estimated least squared means differences (EMD).
Results FBM significantly increased after 12 months (EMD +2920.7, +13.8%, p < 0.001), whereas LBM remained stable (EMD−187.1, −0.3%, p = 0.8). No differences occurred in lipid profile. Glycated hemoglobin significantly increased and serum FSH significantly decreased. A significant inverse relationship was found between serum FSH and ALMI/FBM ratio after 12 month (r = −0.44, p = 0.02).
Conclusions The BLADE study prospectively evaluated changes in body composition after antagonist. LHRH-antagonist therapy is associated to an increased risk of obesity and diabetes, but lean body mass and serum lipids are not affected. This may represent an additional evidence supporting the reduced cardiovascular risk associated with LHRH-antagonist. The role of FSH in influencing sarcopenic obesity in PCa after androgen deprivation deserves to be further explored.
Introduction
Androgen deprivation therapy (ADT) with luteinizing hormone-releasing hormone (LHRH) agonists is the stan-dard of care in advanced prostate cancer (PCa) since Collaborators are listed below Funding.
* Alfredo Berruti
1 Urology Unit, Maggiore della Carità Hospital, Novara, Italy 2 Urology Unit, Department of Medical & Surgical Specialties,
Radiological Sciences & Public Health, University of Brescia, Brescia, Italy
3 Urology Unit, AUOI Verona, Department of Surgery, Dentistry,
Pediatrics and Gynecology, University of Verona, Verona, Italy
4 Radiation Oncology Unit, Department of Medical & Surgical
Specialties, Radiological Sciences & Public Health, University of Brescia, Brescia, Italy
5 Medical Oncology Unit, Department of Medical & Surgical
Specialties, Radiological Sciences & Public Health, University of Brescia, Brescia, Italy
6 Radiology Unit, Department of Medical & Surgical Specialties,
Radiological Sciences and Public Health, University of Brescia, Brescia, Italy
7 TECHNOLOGIC S.r.l. Hologic Italia, Turin, Italy
Supplementary information The online version contains supplementary material available at
https://doi.org/10.1038/s41391-021-00345-0.
123456789
0();,:
123456789
decades [1]. Despite its benefit on patient outcomes and cancer-related symptoms, LHRH-agonist administration is associated to increased risk of incident diabetes and cardi-ovascular disease (CVD) [2, 3]. More recently, LHRH antagonists such as Degarelix have been introduced in clinics [4] and an additional orally administered compound —Relugolix—will become available soon [5]. Randomized clinical trials have demonstrated that LHRH antagonists have a lesser effect on CVD than LHRH agonists [5–7]. The underlying mechanism is multifactorial and not yet fully elucidated [8], but these data are relevant since CVD is the principal non-cancer-related cause of death in PCa patients [9,10].
It is well known that LHRH-agonist therapy induces an increased fat body mass (FBM) and decreased lean body mass (LBM), these changes in body composition lead to a condition of sarcopenic obesity [11], which play a major role in favoring dyslipidemia, insulin resistance, metabolic syndrome, and increased risk of CVD [12]. Dual-energy x-ray absorptiometry (DXA) represents a reference method for the assessment of human body composition in the researchfield [13].
To the best of our knowledge, no studies have pro-spectively evaluated the change in body composition induced by LHRH antagonists in PCa patients. The BLADE study (Bone mineraL mAss Dexa dEgarelix) is a phase IV study, designed to obtain explorative information on DXA measurement changes in LBM and FBM in patients with non-metastatic PCa treated with Degarelix. Serum lipid and glucose profiles and serum follicle-stimulating hormone (FSH) were also concomitantly eval-uated. This paper presents the first results after 12-month treatment.
Patients and methods
Trial design and study population
BLADE is a single-center, prospective, interventional phase IV cohort study (clinicalTrials.gov NCT03202381, EudraCT Number 2016-004210-10) conducted at the PCa unit of the Azienda Socio Sanitaria Territoriale degli Spe-dali Civili and Università degli Studi of Brescia. The study was carried out in accordance with the Declaration of Helsinki Principles and Good Clinical Practices and was approved by the Ethics Committee of Brescia (approval number NP2540). All patients provided a written informed consent. Male patients with histologically confirmed PCa without bone metastasis at bone scintigraphy, judged eli-gible to ADT according to current guidelines recommen-dations after a multisciplinary discussion [14, 15], were enrolled. Exclusion criteria consisted of absolute or relative
contraindication to Degarelix, prior ADT treatment, prior or concomitant treatment with bisphosphonates or other drugs known to affect bone metabolism, concomitant bone metabolic disease, such as Paget’s disease, primary hyper-parathyroidism or chronic hypercortisolism.
Degarelix was administered as a subcutaneous injection with a starting dose of 240 mg, followed by a maintenance dose of 80 mg every 28 days. After 12 months, treatment with Degarelix was continued as clinically indicated.
Endpoints and assessment
The co-primary endpoints were to assess changes in FBM and LBM after 12 months of Degarelix administration. Secondary endpoints were to assess changes in body mass index (BMI), serum lipid profile, serum glucose profile and serum FSH.
At enrollment, eligibility checklist history, full medical history and complete physical examination were completed. Body mass index and blood test parameters [serum glucose, glycated hemoglobin (HbA1c), serum total, high-density lipoproteins (HDL) and low-density lipoproteins (LDL) cholesterol, triglycerides, and FSH were assessed at base-line, 6 and 12 months. DXA measurements (FBM, LBM) were performed at baseline and 12 months, using Hologic QDR-4500W instrumentation (Hologic Corporation, Wal-tham, Massachusetts, software version 9.03). Data were analyzed by a dedicated Endocrinologist.
In a post-hoc analysis, appendicular lean mass index (ALMI), which is a common metric used as an approx-imation of muscle mass in sarcopenia, was calculated as the sum of lean tissue in the arms and legs and then scaled to height squared (ALMI kg/m2). The ALMI/FBM ratio was calculated as a measure of sarcopenic obesity. ALMI and ALMI/FBM ratio were calculated at baseline and after 12 months of Degarelix therapy.
Adverse events (AEs), serious AEs (SAEs), and sus-pected unexsus-pected serious adverse reactions, occurring from the starting time of trial treatment until 28 days post ces-sation of trial treatment, were managed according to Eur-opean legislation.
Statistical analysis
To calculate sample size, we relied on a previous spective cohort study, where body composition was pro-spectively assessed in non-metastatic PCa patients treated with LHRH agonists [16]. In order to detect an increase of FBM from 18 kg at baseline to a maximum of 21 kg at 12 months (with a SD of 4.5), with an alpha error of 0.05 and a beta error of 0.10 (which allows for 90% power), a sample size of 35 patients was estimated. This accounted for an anticipated dropout of 10%.
Repeated measures pairedt-test and ANOVA test tested for mean differences between baseline vs. 12 months for DXA scan results and between baseline vs. 6 months vs. 12 months for BMI and blood test parameters. Then, linear mixed models with random intercept to account for multiple measurements within each patient were used to estimate differences. Percent changes were calculated as well. The estimated least squared means differences between baseline vs. 12 months for DXA scan results and between baseline vs. 6 months vs. 12 months for BMI and blood test parameters, as well as the measurements of each patient, were graphically depicted for each endpoint. As regards the post-hoc analyses, the differences in ALMI and ALMI/ FBM between baseline and 12 months were estimated through linear mixed models and graphically depicted. In addition, Spearman rank coefficient evaluated correlations between FBM, ALMI and ALM/FBM ration, and FSH at both baseline and 12 months.
All statistical tests were two-sided with a level of sig-nificance set at p < 0.05. Analyses were performed using the R software environment for statistical computing and gra-phics (version 3.4.1;http://www.r-project.org/).
Results
Baseline characteristics of study population
As per-protocol, 35 non-metastatic PCa patients with indi-cation to ADT were enrolled from June 2017 to March 2019. Out of the 37 patients screened for eligibility, two patients were excluded because they have been previously treated with ADT (both with LHRH-agonist Leuprolide). Indication to enrollment was as follows: 19 patients (54.3%) received ADT as adjuvant treatment after RP, 10 patients (28.6%) received ADT as salvage treatment after either RP
or RT due to biochemical recurrence, 4 patients (13.7%) received ADT as primary treatment, and 2 (3.4%) patients received ADT in combination to primary RT. After enrollment, six patients dropped out from the study: three experienced disease progression with bone metastases, one withdrawn his consent and two did not complete the 12-month visit because of SARS-CoV-2 emergency in North-ern Italy. The final cohort consisted of 29 patients (Sup-plementary Fig. 1).
Supplementary Table 1 summarizes baseline character-istics of the 29 patients included in the analyses. Median age was 71 (interquartile range [IQR] 63–79) and median baseline PSA was 3.8 ng/mL (IQR 1.1–11.8). Diabetes and hypercholesterolemia were present in respectively 2 (6.9%) and 7 (24.1%) patients. Nineteen (65.5%) patients had T3-4 stage, 16 (55.2%) had nodal involvement and 18 (62.1%) had Gleason grade group IV-V. As primary treatment, 20 patients (69.0%) received RP, 5 patients (17.2%) RT and 4 patients (13.8%) ADT alone. None of the patients started new therapies with either hypoglycemic or lipid-lowering drugs during the 12-month treatment.
Changes in body composition and blood test
parameters
Tables 1 and 2 summarize results. Mean FBM sig-nificantly increased after 12 months of Degarelix treat-ment (21130.96 ± 7731.12 at baseline vs. 24051.7 ± 8135.73 at 12 months). Estimate mean difference between baseline vs. 12 months was 2920.7, which corresponded to an increase of 13.8% (p < 0.001). Conversely, stable LBM values were shown before and after therapy (esti-mate mean difference −187.1, change −0.3%, p = 0.8). The graphical depiction with the comparison of individual patterns, showed a large variation within the study cohort (Fig. 1). Body mass index showed a modest albeit Table 1 Mean values (±
standard deviation) at baseline, 6 months and 12 months of treatment.
Baseline 6 months 12 months
Fat body mass (g) 21,130.96 (7731.12) – 24,051.7 (8135.73) Lean body mass (g) 59,254.28 (9092.13) – 59,067.17 (8092.4)
BMI (kg/m2) 26.5 (4.1) 27.1 (4.3) 27.3 (4.1) Total cholesterol (mg/dL) 190.5 (31.3) 194.6 (28.2) 186.5 (32.6) HDL (mg/dL) 55.6 (16.6) 58.1 (17.3) 55.1 (15.1) LDL (mg/dL) 109.7 (26.9) 108.4 (26.4) 107.2 (26.8) Triglycerides (mg/dL) 110.0 (42.9) 131.9 (85.9) 119.6 (53.5) Glucose (mg/dL) 102.5 (18.2) 105.5 (24.5) 104.2 (21.2) HbA1c (mmol/mol) 39.5 (5.3) 42.3 (7.3) 43.1 (7.3) FSH (UI/L) 11.7 (11.1) 1.4 (1.1) 2.3 (2.6) PSA (ng/mL) 12.7 (33.6) 0.3 (1.0) 0.2 (0.4)
BMI body mass index, HDL high-density lipoprotein, LDL low-density lipoprotein, HbA1c glycated hemoglobin,FSH follicle-stimulating hormone, PSA prostate specific antigen.
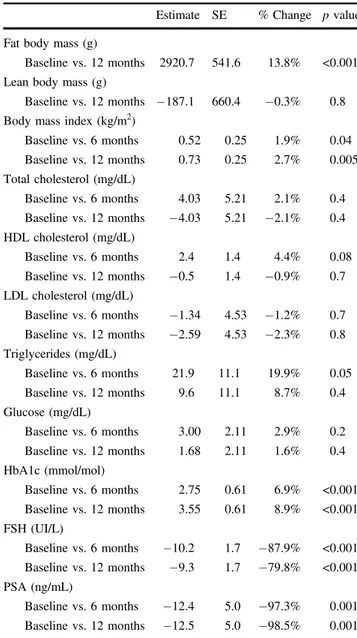
significant increase after 6 months (estimate mean dif-ference 0.52, change 1.9%, p = 0.04) and 12 months (estimate mean difference 0.73, change 2.7%,p = 0.005), relative to baseline (Supplementary Fig. 2).
As regards post-hoc analyses, linear mixed models ana-lyses showed stable ALMI values before and after therapy (from 8.01 ± 1.08 to 7.91 ± 0.95, estimate mean difference −0.1, change −5.7%, p = 0.3), while the ALMI/FBM ratio showed a modest but significant decrease after 12 months (from 0.42 ± 0.15 to 0.36 ± 0.13, estimate mean difference −0.06, change −24.7%, p < 0.001) (Fig.2).
No significant differences at either 6 months or 12 months, with respect to baseline, were recorded for total, HDL and LDL cholesterol, as well as triglycerides. Serum glucose did not significantly change at either 6 months or 12 months, whereas HbA1c showed a significant increase at both 6 months (estimate mean difference 2.75, change 6.9%, p < 0.001) and 12 months (estimate mean difference 3.55, change 8.9%,p < 0.001), relative to baseline. FSH showed a significant decline at 6 months (estimate mean difference −10.2, change −87.9%, p < 0.001) and 12 months (estimate mean difference −9.33, change −79.8%, p < 0.001). Graphical depictions of all these endpoints showed individual heterogeneous variations (Supplementary Fig. 2). A non-significant correlation was observed between serum FSH and LBM either at baseline (Spearmanr = 0.27, p = 0.1), or after 12 months (r = −0.07, p = 0.7) (data not shown).
As post-hoc analyses, there was no significant relation-ship between serum FSH and ALMI both at baseline (r = 0.29, p = 0.1) and after 12 months (r = −0.25, p = 0.2). The ALMI/FBM ratio did not correlate with FSH levels at baseline (r = −0.15, p = 0.4) but a significant relationship between the 2 parameters was found after 12 months of Degarelix therapy (r = −0.44, p = 0.02) (Fig.3). Sensitivity analyses were performed after excluding two outlier observations among the 12-month FSH determinations. The results virtually replicated those of the main post-hoc analysis.
Table 2 Estimate mean differences at baseline, 6 months and 12 months after treatment.
Estimate SE % Change p value Fat body mass (g)
Baseline vs. 12 months 2920.7 541.6 13.8% <0.001 Lean body mass (g)
Baseline vs. 12 months −187.1 660.4 −0.3% 0.8 Body mass index (kg/m2)
Baseline vs. 6 months 0.52 0.25 1.9% 0.04 Baseline vs. 12 months 0.73 0.25 2.7% 0.005 Total cholesterol (mg/dL) Baseline vs. 6 months 4.03 5.21 2.1% 0.4 Baseline vs. 12 months −4.03 5.21 −2.1% 0.4 HDL cholesterol (mg/dL) Baseline vs. 6 months 2.4 1.4 4.4% 0.08 Baseline vs. 12 months −0.5 1.4 −0.9% 0.7 LDL cholesterol (mg/dL) Baseline vs. 6 months −1.34 4.53 −1.2% 0.7 Baseline vs. 12 months −2.59 4.53 −2.3% 0.8 Triglycerides (mg/dL) Baseline vs. 6 months 21.9 11.1 19.9% 0.05 Baseline vs. 12 months 9.6 11.1 8.7% 0.4 Glucose (mg/dL) Baseline vs. 6 months 3.00 2.11 2.9% 0.2 Baseline vs. 12 months 1.68 2.11 1.6% 0.4 HbA1c (mmol/mol) Baseline vs. 6 months 2.75 0.61 6.9% <0.001 Baseline vs. 12 months 3.55 0.61 8.9% <0.001 FSH (UI/L) Baseline vs. 6 months −10.2 1.7 −87.9% <0.001 Baseline vs. 12 months −9.3 1.7 −79.8% <0.001 PSA (ng/mL) Baseline vs. 6 months −12.4 5.0 −97.3% 0.001 Baseline vs. 12 months −12.5 5.0 −98.5% 0.001 SE standard error, BMI body mass index, HDL high-density lipoprotein,LDL low-density lipoprotein, HbA1c glycated hemoglo-bin,FSH follicle-stimulating hormone, PSA prostate specific antigen.
Fig. 1 Estimate difference between baseline and 12-month in fat body mass and lean body mass. Solid line represents estimate least squared mean difference and dashed lines represent each patient measurements.
Adverse events
No major AEs were recorded. All the patients reported erythema and pain in the site of subcutaneous injection, which lasted between one and three days and were self-limiting. Nine patients (31.0%) and ten patients (34.5%) reportedflushing at 6- and 12-month visit, respectively.
Discussion
This paper presents the effects of the LHRH-antagonist Degarelix on body composition parameters in non-metastatic PCa patients. After 12 months of Degarelix therapy, FBM significantly increased with a percentage change of 13.8%. This FBM increase did not differ much in Fig. 2 Estimate difference
between baseline and 12-month in appendicular lean mass index and appendicular lean mass index/fat body mass ratio. Solid line represents estimate least squared mean difference and dashed lines represent each patient measurements.
Fig. 3 Scatter plots. The plots illustrate the correlations between FSH and lean body mass, appendicular lean mass index and appendicular lean mass index/fat body mass ratio, respectively.
comparison with that reported in LHRH agonists studies [16–19]. Body mass index showed a non-significant 2.7% increase and this observation confirms the superiority of DXA scan over BMI in assessing FBM changes [20]. Interestingly, LBM did not differ before and after Degarelix administration and this observation is in contrast with results of LHRH-agonist studies [16–19], which reported a significant decrease of LBM [21]. On the basis of these results, the LHRH antagonists seem to induce a similar risk of obesity but a lower risk of sarcopenia with respect to LHRH agonists. The ALMI is a more reliable parameter of skeletal muscle mass than LBM since it is less influenced by the mass of skin, internal organs, tendons, and other com-ponents [22]. In addition the ALMI/FBM ratio has been reported as a more sensitive parameter to measure the low lean mass relative to adiposity [23]. To better investigate this phenomenon, we performed post-hoc analyses intro-ducing these two parameters. The results showed that ALMI did not change before and after Degarelix paralleling the LBM pattern. These finding reinforce the notion that Degarelix administration may have a limited effect on the sarcopenic risk. The slight although significant decrease in ALMI/FBM ratio in our series is mainly attributed the increase of FBM. These results are of potential clinical interest. The role of obesity as a risk factor for CVD and mortality in adult populations has been recently questioned [12, 24]. Recent studies even reported an inverse associa-tion between obesity and risk of CVD [25]. This phenom-enon, named the obesity paradox, seems to be particularly relevant in the elderly people [26], such as most patients with PCa. Conversely, sarcopenia has latterly been asso-ciated with increased risks of metabolic impairment, cardi-ovascular risk factors, and mortality [27]. Sarcopenia and obesity therefore negatively interact in older adults and the state of sarcopenic obesity has a greater role in promoting CVD, ultimately increasing the mortality risk, than sarco-penia or obesity alone [28].
The lower CVD risk associated to LHRH antagonists compared to LHRH agonists has been at least in part attributed to the greater reduction in FSH levels, in terms of magnitude and duration, induced by the former compared to the latter compounds. It has been shown that during long-term LHRH-agonist therapy, FSH can promote develop-ment and progression of atherosclerotic plaques, metabolic syndrome and insulin resistance these mechanisms could account for the observed increased CVD risk [29]. Our results indeed showed a steep decline in FSH levels at 6-month after Degarelix administration, confirming pub-lished data [29]. A recent Korean study has shown that ALMI measured across menopause stages in a series of women was inversely correlated to FSH but not to estradiol [30]. These data suggest that FSH may negatively influence muscle mass and favor sarcopenia. We therefore
investigated the potential correlation between FSH and LBM, ALMI and ALMI/FBM ratio at baseline and at 12 months. Ourfindings showed no correlations at baseline. Nonetheless, an inverse correlation was found between FSH and LBM, ALMI and ALMI/FBM ratio at 12 months, the latter attaining the statistical significance. These data con-firm that FSH serum levels negatively influence the LBM, at least in the condition of castrated serum testosterone levels, and may favor sarcopenic obesity. Thesefindings suggest a further mechanism of induction of sarcopenic obesity of ADT and that the administration of LHRH antagonists may be associated with a lower risk of sarcopenic obesity and CVD risk than LHRH agonists through the lower levels of FSH [4]. The relationship between FSH and sarcopenia and sarcopenic obesity in PCa patients submitted to ADT deserves to be further studied.
As regard metabolic effects, Degarelix administration was associated with glucose impairment and increased risk of diabetes, as demonstrated by the progressive increase of circulating HBA1c, whose magnitude was greater at 6 months, although glucose serum levels did not sig-nificantly change. Our data are consistent with previously published papers with LHRH agonists [31, 32], showing increases in both glycated hemoglobin levels and need for diabetes medications. However, no significant changes were recorded in total cholesterol, HDL cholesterol, LDL cho-lesterol, and triglycerides after 6- and 12-month treatment with Degarelix. These data are in contrast with a pooled data analysis of three randomized trials [31] showing that leuprolide significantly increased serum levels of triglycer-ides and total cholesterol and are consistent with preclinical studies on a mouse model, which reported a more favorable serum lipid profile associated with LHRH-antagonist ther-apy, as opposed to LHRH agonists [33]. The favorable effect of LHRH-antagonist on lipid concentrations could contribute to the observed CVD protection induced by these drugs.
The present study has limitations that should be acknowledged. First, since the study power was calculated on FBM changes, many of the non-significant findings among secondary endpoints may be due to the low sta-tistical power rather than evidence of these variables not being predictive of the clinical outcomes assessed. Sec-ond, the study did not have a validation group. Third, indication to ADT was heterogeneous among our cohort. Finally, the short follow-up prevented us to obtain infor-mation on the long-term effect of Degarelix on body composition.
In summary, 12-month Degarelix administration was associated with a FBM increase comparable to LHRH agonists. However, while LHRH-agonist administration notoriously leads to a decrease in LBM [16, 18, 19], this parameter did not change after Degarelix administration and
also ALMI, a more reliable measure of muscle mass, showed a substantial stability. These data suggest that patients treated with LHRH antagonists could have a lower risk to develop sarcopenic obesity than those receiving LHRH agonists. Our data also showed that FSH serum levels assessed after Degarelix therapy had an inverse cor-relation with the ALM/FBM ratio whose low values are expression of sarcopenic obesity [34]. This suggests a pathogenic role of FSH with regard to this unwanted phy-sical and metabolic condition. So the greater reduction in serum FSH after LHRH antagonists compared to agonists [29,30] provides a possible mechanism of reduction in the risk of sarcopenic obesity associated with the administration of the former drugs as compared to the latter. These data, if confirmed, are relevant in view of the increasing impact of obesity and sarcopenia on the CVD risk in long surviving patients with PCa. In conclusion, the reduced risk of sar-copenic obesity alongside the lack of changes on lipid profile observed in the PCa patients submitted to Degarelix in this study, provide further evidence in favor of reduced cardiovascular events associated with LHRH antagonists as opposed to LHRH agonists.
Funding This research was partially funded by Ferring Pharmaceu-ticals. The funder had no role in design and conduct of the study, in collection, management, analysis, and interpretation of the data and in preparation, review, or approval of the manuscript.
Collaborators Simone Francavilla2, Maria Furlan2, Alberto Gheza2, Alessandro Veccia2, Andrea Guerini4.
Compliance with ethical standards
Conflict of interest The authors declare no competing interests. Publisher’s note Springer Nature remains neutral with regard to jurisdictional claims in published maps and institutional affiliations.
References
1. Gillessen S, Attard G, Beer TM, Beltran H, Bjartell A, Bossi A, et al. Management of patients with advanced prostate cancer: report of the advanced prostate cancer consensus conference 2019. Eur Urol. 2020;77:508–47.
2. O’Farrell S, Garmo H, Holmberg L, Adolfsson J, Stattin P, Van Hemelrijck M. Risk and timing of cardiovascular disease after androgen-deprivation therapy in men with prostate cancer. J Clin Oncol. 2015;33:1243–51.
3. Bosco C, Bosnyak Z, Malmberg A, Adolfsson J, Keating NL, Van Hemelrijck M. Quantifying observational evidence for risk of fatal and nonfatal cardiovascular disease following androgen depriva-tion therapy for prostate cancer: a meta-analysis. Eur Urol. 2015;68:386–96.
4. Klotz L, Boccon-Gibod L, Shore ND, Andreou C, Persson B-E, Cantor P, et al. The efficacy and safety of degarelix: a 12-month, comparative, randomized, open-label, parallel-group phase III study in patients with prostate cancer. BJU Int. 2008;102:1531–8.
5. Shore ND, Saad F, Cookson MS, George DJ, Saltzstein DR, Tutrone R, et al. Oral relugolix for androgen-deprivation therapy in advanced prostate cancer. N Engl J Med. 2020;382:2187–96. 6. Margel D, Peer A, Ber Y, Shavit-Grievink L, Tabachnik T, Sela S,
et al. Cardiovascular morbidity in a randomized trial comparing GnRH agonist and GnRH antagonist among patients with advanced prostate cancer and preexisting cardiovascular disease. J Urol. 2019;202:1199–208.
7. Abufaraj M, Iwata T, Kimura S, Haddad A, Al-Ani H, Abusubaih L, et al. Differential impact of gonadotropin-releasing hormone antagonist versus agonist on clinical safety and oncologic out-comes on patients with metastatic prostate cancer: a meta-analysis of randomized controlled trials. Eur Urol. 2021;79:44–53. 8. Klotz L. Pharmacokinetic and pharmacodynamic profile of
degarelix for prostate cancer. Expert Opin Drug Metab Toxicol. 2015;11:1795–802.
9. Sturgeon KM, Deng L, Bluethmann SM, Zhou S, Trifiletti DM, Jiang C, et al. A population-based study of cardiovascular disease mortality risk in US cancer patients. Eur Heart J. 2019;40:3889–97.
10. Leong DP, Fradet V, Shayegan B, Duceppe E, Siemens R, Niazi T, et al. Cardiovascular risk in men with prostate cancer: insights from the RADICAL PC study. J Urol. 2020;203:1109–16. 11. Dalla Volta A, Mazziotti G, Maffezzoni F, Grisanti S, Palumbo C,
Pedersini R, et al. Bone mineral density and FRAX score may not predict fracture risk in patients with cancer undergoing hormone deprivation therapies. J Clin Oncol. 2020;38:3363–6.
12. Atkins JL, Wannamathee SG. Sarcopenic obesity in ageing: cardiovascular outcomes and mortality. Br J Nutr. 2020; 124:1102–13.
13. Ponti F, Santoro A, Mercatelli D, Gasperini C, Conte M, Martucci M, et al. Aging and imaging assessment of body composition: from fat to facts. Front Endocrinol. 2019;10:861.
14. Cornford P, Bellmunt J, Bolla M, Briers E, De Santis M, Gross T, et al. EAU-ESTRO-SIOG guidelines on prostate cancer. Part II: treatment of relapsing, metastatic, and castration-resistant prostate cancer. Eur Urol. 2017;71:630–42.
15. Mottet N, Bellmunt J, Bolla M, Briers E, Cumberbatch MG, De Santis M, et al. EAU-ESTRO-SIOG guidelines on prostate cancer. Part 1: screening, diagnosis, and local treatment with curative intent. Eur Urol. 2017;71:618–29.
16. Berruti A, Dogliotti L, Terrone C, Cerutti S, Isaia G, Tarabuzzi R, et al. Changes in bone mineral density, lean body mass and fat content as measured by dual energy x-ray absorptiometry in patients with prostate cancer without apparent bone metastases given androgen deprivation therapy. J Urol. 2002;167:2361–7. 17. Buttigliero C, Vana F, Bertaglia V, Vignani F, Fiori C, Osella G,
et al. The fat body mass increase after adjuvant androgen depri-vation therapy is predictive of prostate cancer outcome. Endo-crine. 2015;50:223–30.
18. Smith MR. Changes in fat and lean body mass during androgen-deprivation therapy for prostate cancer. Urology. 2004;63:742–5. 19. Smith MR. Osteoporosis and other adverse body composition changes during androgen deprivation therapy for prostate cancer. Cancer Metastasis Rev. 2002;21:159–66.
20. Kendler DL, Borges JLC, Fielding RA, Itabashi A, Krueger D, Mulligan K, et al. The official positions of the International Society for Clinical Densitometry: indications of use and reporting of DXA foR Body Composition. J Clin Densitom. 2013;16:496–507.
21. Haseen F, Murray LJ, Cardwell CR, O’Sullivan JM, Cantwell MM. The effect of androgen deprivation therapy on body com-position in men with prostate cancer: systematic review and meta-analysis. J Cancer Surviv. 2010;4:128–39.
22. Weber D, Long J, Leonard MB, Zemel B, Baker JF. Development of novel methods to define deficits in appendicular lean mass relative to fat mass. PLoS ONE. 2016;11:e0164385.
23. Baker JF, Harris T, Rapoport A, Ziolkowski SL, Leonard MB, Long J, et al. Validation of a description of sarcopenic obesity defined as excess adiposity and low lean mass relative to adip-osity. J Cachexia Sarcopenia Muscle. 2020. https://doi.org/10.
1002/jcsm.12613.
24. Motamed N, Ajdarkosh H, Darkahian M, Zamani F, Rabiee B, Faraji AH, et al. 10-year risk of cardiovascular disease and body mass index in association with the obesity paradox. ARYA Atheroscler. 2020;16:16–23.
25. Lavie CJ, McAuley PA, Church TS, Milani RV, Blair SN. Obesity and cardiovascular diseases: implications regarding fitness, fat-ness, and severity in the obesity paradox. J Am Coll Cardiol. 2014;63:1345–54.
26. Winter JE, MacInnis RJ, Nowson CA. The influence of age the BMI and all-cause mortality association: a meta-analysis. J Nutr Health Aging. 2017;21:1254–8.
27. Barbalho SM, Flato UAP, Tofano RJ, Goulart R de A, Guiguer EL, Detregiachi CRP, et al. Physical exercise and myokines: relationships with sarcopenia and cardiovascular complications. Int J Mol Sci. 2020;21.https://doi.org/10.3390/ijms21103607.
28. Roh E, Choi KM. Health consequences of sarcopenic obesity: a narrative review. Front Endocrinol. 2020;11:332.
29. Crawford ED, Tombal B, Keane T, Boccardo F, Miller K, Shore N, et al. FSH suppression and tumour control in patients with prostate cancer during androgen deprivation with a GnRH agonist or antagonist. Scand J Urol. 2018;52:349–57.
30. Park Y-M, Jankowski CM, Ozemek C, Hildreth KL, Kohrt WM, Moreau KL. Appendicular lean mass is lower in late compared with early perimenopausal women: potential role of FSH. J Appl Physiol. 2020;128:1373–80.
31. Yannucci J, Manola J, Garnick MB, Bhat G, Bubley GJ. The effect of androgen deprivation therapy on fasting serum lipid and glucose parameters. J Urol. 2006;176:520–5.
32. Keating NL, Liu P-H, O’Malley AJ, Freedland SJ, Smith MR. Androgen deprivation therapy and diabetes control among dia-betic men with prostate cancer. Eur Urol. 2014;65:816–24. 33. Hopmans SN, Duivenvoorden WCM, Werstuck GH, Klotz L,
Pinthus JH. GnRH antagonist associates with less adiposity and reduced characteristics of metabolic syndrome and atherosclerosis compared with orchiectomy and GnRH agonist in a preclinical mouse model. Urol Oncol Semin Orig Investig. 2014;32:1126–34. 34. Woo J, Leung J. Sarcopenic obesity revisited: insights from the Mr and Ms Os cohort. J Am Med Dir Assoc. 2018;19:679–684.e2.