DURABILITY STUDY
OF PVD - CATALYSED CATHODE
FOR POLYMER ELECTROLYTE
FUEL CELLS
A. POZIO
Dipartimento Tecnologie Energetiche Divisione Produzione,Conversione e Uso Efficientidell’Energia Laboratorio Sviluppo ProcessiChimicie Termofluidodinamiciper l’Energia Centro Ricerche Casaccia,Roma M. ALVISI, L. PILLONI Dipartimento Sostenibilità dei sistemi p
Dipartimento Sostenibilità dei sistemi produttivi e territoriali Divisione Tecnologie e processi dei materiali per la sostenibilità
Laboratorio Materiali e processi chimico-fisici Centro Ricerche Casaccia, Roma
D. VALERINI
Dipartimento Sostenibilità dei sistemi produttivi e territoriali Supporto TecnicoStrategico
Centro Ricerche Casaccia, Roma L. GIORGI
Scienza dei Materiali & Elettrochimica V
Via Mantova, 11 00042, Roma
RT/2016/6/ENEA
ITALIAN NATIONAL AGENCY FOR NEW TECHNOLOGIES, ENERGY AND SUSTAINABLE ECONOMIC DEVELOPMENT
A. POZIO
Dipartimento Tecnologie Energetiche Divisione Produzione, Conversione e Uso Efficienti dell’Energia Laboratorio Sviluppo Processi Chimici e Termofluidodinamici per l’Energia Centro Ricerche Casaccia, Roma
M. ALVISI, L. PILLONI
Dipartimento Sostenibilità dei sistemi produttivi e territoriali Divisione Tecnologie e processi dei materiali per la sostenibilità Laboratorio Materiali e processi chimico-fisici Centro Ricerche Casaccia, Roma
DURABILITY STUDY
OF PVD - CATALYSED CATHODE
FOR POLYMER ELECTROLYTE
FUEL CELLS
D. VALERINI
Dipartimento Sostenibilità dei sistemi produttivi e territoriali Supporto TecnicoStrategico
Centro Ricerche Casaccia, Roma
L. GIORGI
Scienza dei Materiali & Elettrochimica Via Mantova, 11
00042, Roma
RT/2016/6/ENEA
ITALIAN NATIONAL AGENCY FOR NEW TECHNOLOGIES, ENERGY AND SUSTAINABLE ECONOMIC DEVELOPMENT
I rapporti tecnici sono scaricabili in formato pdf dal sito web ENEA alla pagina http://www.enea.it/it/produzione-scientifica/rapporti-tecnici
I contenuti tecnico-scientifici dei rapporti tecnici dell’ENEA rispecchiano l’opinione degli autori e non necessariamente quella dell’Agenzia
The technical and scientific contents of these reports express the opinion of the authors but not necessarily the opinion of ENEA.
DURABILITY STUDY OF PVD - CATALYSED CATHODE FOR POLYMER ELECTROLYTE FUEL CELLS
A. Pozio, M. Alvisi, D. Valerini, L. Pilloni, L. Giorgi
Riassunto
Questo lavoro riporta uno studio sulla comprensione delle prestazioni dei catodi per celle a combu-stibile a elettrolita polimerico, ottenute mediante deposizione PVD del catalizzatore di platino. Per indagare la durata di questo tipo di elettrodo, sono stati effettuati test in celle a combustibile lungati. I risultati hanno evidenziato una diminuzione del rendimento durante il funzionamento pro-lungato dell'elettrodo a causa di una diminuzione della zona di reazione nello strato catalitico.
Parole chiave: celle a combustibile ad elettolita polimerico, PVD, catodo, catalizzatore Pt
Abstract
This paper reports a study on the understanding of the performance of cathodes for polymer elec-trolyte fuel cells, obtained by means of PVD deposition of the platinum catalyst. To investigate the durability of this kind of electrode, prolonged fuel cell tests have been carried out. The results evi-denced a decrease of performance during the prolonged working of the electrode due to a de-crease of the reaction zone in the catalytic layer.
1. Introduction 2. Experimental
2.1 Materials and electrode preparation
2.2. Sputtering preparation of catalysed PVD platinum cathode on GDE 2.3 Physicochemical characterisation
3. Results and discussion 4. Conclusion References 7 8 8 9 10 12 20 22 INDEX
7
1. Introduction
The polymer electrolyte fuel cells (PEFCs) are considered a leading candidate to replace the traditional power sources like the internal combustion engines. They find applications in the stationary cogeneration power systems, automotive and portable applications (e.g. consumer electronics, etc.). In the cell, fuel (hydrogen) is oxidized at the anode, oxygen (or air) is reduced to water at the cathode and electrical energy is delivered with very high yield in a production process having near-zero emissions. In order to make the PEFCs a commercial reality, a great development work has been aimed on the performance improvement of electrode materials and electrocatalysts [1]. One important goal of the current research is to lower the overall fuel cell cost through several approaches, such as reducing loadings and/or increasing utilization of the electrocatalyst or simplifying the cell design and the manufacturing process.
In the past, several authors have examined the sputter deposition technique as a means to reduce the cell costs by achieving ultra-low levels of catalyst loading and minimizing the loss of precious catalysts [2,3,4,5,6]. Efforts directed to improve the utilization efficiency of the Pt catalyst have been focused on finding an optimal material configuration that fulfil the requirement of a minimum Pt loading while maintaining the access of protons and the electronics continuity. In the past, Alvisi et al [7] focused their investigation to achieve high electrode performance with thin Pt layers sputter-deposited on the un-catalyzed gas diffusion electrodes. In their experiment thin Pt layers (1-6 nm) electrodes were characterised in a three electrodes electrochemical cell for methanol oxidation showing an increase of performance compared to commercial catalyst. Among the characteristics of such electrodes were: (a) localization of the electrocatalyst on the uppermost surface; (b) thin active layer. More recently, Shafiei et al. [8] analysed the improvement of platinum adhesion to carbon surfaces using PVD in order to enhance the Pt catalyst durability in PEMFCs.
8
Unfortunately, none of the above authors evaluate the performance of these electrodes for prolonged times. Individual tests were carried out only short-lived. Therefore completely missing an analysis of any degradation in the short to medium term. We need to understand whether this technique should be refined or is already sufficient for the technological application.
In this work, thicker Pt-layers sputter deposited (50-150 nm) were studied as cathodes in a complete PEFCs fed with hydrogen and oxygen in order to evaluate the influence of thickness on the membrane electrode assemblies (MEAs) performance. In addition, more prolonged test were achieved using the same kind of electrode as cathode in a MEA for about 300 hours in order to evaluate its short term durability. The best performance was confirmed for Pt layer of 100 nm but also a constant degradation was observed due probably to a weak adhesion of the Pt onto the electrode.
2. Experimental
2.1. Materials and electrode preparation
Commercially available 20 wt.% and 30 wt.% Pt/C catalyst powders on carbon black (Vulcan XC72) were purchased from E-Tek Inc. Two-layer (substrate/diffusive layer) gas diffusion electrodes (GDEs) were prepared using a spray technique described in detail in previous work [9,10]. The substrate was carbon paper (Toray TGPH090). The weight composition of the diffusion layer was 90 wt.% of carbon and 10 wt.% of PTFE, with carbon loading of about 1.2 mg cm−2. These GDEs were used as substrate for the sputtering preparation of PVD platinum cathode. As references, three-layer cathodes were prepared adding on the same above diffusive layer a catalyst layer. They were prepared by mixing appropriate amounts of carbon-supported catalyst (20 wt.%) with 5 wt.% and without Nafion® ionomer solution from Aldrich. The platinum loading in this
9
Three-layer (substrate/diffusive layer/catalyst layer) gas diffusion anodes were prepared using the same technique described above for cathodes using the same carbon paper substrates. In this case, the weight composition of the diffusion layer was 50 wt.% of carbon and 50 wt.% of PTFE, with carbon loading of about 2.5 mg cm−2. The catalyst layer was prepared by mixing appropriate amounts of carbon-supported catalyst (30 wt.%) and 5 wt.% Nafion® ionomer solution from
Aldrich. The platinum loading in all anodes was kept constant at 0.54 mg cm−2 together with a Nafion® amount of 0.9 mg cm−2.
The MEAs were prepared using Nafion® 112 as membrane electrolyte. The membranes were used
after purification treatment in 5% (w/v) H2O2 solution at 80 ºC for 1 h, followed by a second
treatment in 1M H2SO4. The MEAs were formed by hot pressing the electrodes (5 cm2) onto the
membrane at 130 °C for 1–5 min and 50–100 kg cm−2.
2.2. Sputtering preparation of catalysed PVD platinum cathode on GDE
Before insertion into the PVD chamber the GDEs substrates were only gently flushed in pure nitrogen. The Pt films were deposited on GDE substrates at room temperature by using a commercial RF magnetron sputtering system (DDC 300). The distance between the target and the substrate was 5.0 cm. The sputtering deposition system used for the experiments consists of a stainless steel chamber, which was evacuated down to 8×10⁻⁵ Pa with a turbomolecular pump
backed up by a rotary pump. Before sputtering deposition, the Pt target (60 mm diameter, purity 99.95%) was sputter cleaned in pure Ar. The Ar working pressure (2.2 Pa), the power supply (36 W) and the deposition rate were kept constant throughout these investigations. By varying the deposition time we have deposited samples with different equivalent film thickness (50÷150 nm). The equivalent thickness was deduced by measuring the deposition rate on thicker film by
10
profilometry and the Pt loading was calculated by overestimation using the Pt density and the equivalent thickness [7].
Table 1 – Calculated Pt loading for the Pt-PVD electrodes. Cathode type [Pt] mg cm-2 Pt-PVD-50 nm 0.11 Pt-PVD-75 nm 0.16 Pt-PVD-100 nm 0.21 Pt-PVD-125 nm 0.27 Pt-PVD-150 nm 0.32 2.3 Physicochemical characterisation
Some galvanostatic polarisation were carried out in a conventional three-electrode cell (anode/counter electrode/reference electrode) containing a 1 M H2SO4 solution at 25 °C [11]. The
working electrode disc was inserted in a Teflon holder with an exposed area of 1 cm2, gas diffusion
electrode was placed inside a Teflon holder provided with a platinum-ring current collector and gas back-feeding. A stream of 10 ml min-1 of O2 was used in all the experiments of oxygen reduction. A
large-area platinum flat electrode was used as a counter electrode and an Hg/HgSO4 reference
electrode was connected to the cell through a Luggin capillary. The potential values quoted are reported with respect to the reference hydrogen electrode (RHE). The electrochemical cell was connected to a Solartron mod. 1287 potentiostat/galvanostat interfaced with a GPIB card to a personal computer.
Full cell electrochemical tests have been tested at 50°C in a 5 cm2 active area single cell. The cell was inserted in a Globe Tech Inc. mod. 850C station equipped with an integrated frequency resistance analyzer (FRA) for high frequency resistance (HFR) and an electrochemical impedance
11
spectroscopy (EIS) equipment. The cell was fed with humidified H2 at 250 ml min-1 (R.H. 152%)
and O2 at 200 ml min-1 (R.H. 64%) under a pressure of 2 abs bar. The MEAs were submitted to
galvanostatic polarization by means of a programmable power supply interfaced with a computer for data acquisition. All the measurements were performed in the same operative conditions. The total cell resistance was also measured continuously by the periodic current pulse transient. In this kind of measurement, the cell current is rapidly removed and the cell voltage sampled after a time delay of 20 μs. [12,13]
Prolonged tests were carried out on the same cell with Pt-100-nm cathode at 70 °C and 140 mA cm
-2 in H
2/O2 flux at 100 and 200 ml min-1 and R.H (152 and 64%), respectively. In order to simulate
periodic start-ups, the cell was switched off and left in air at room temperature overnight or sometimes for an entire weekend. Cell voltage vs. time plots were recorded continuously and impedance spectra were periodically acquired in the galvanostatic mode with a DC current of 0.5 A and 0.7 A and AC 10%DC between 15 kHz and 1 Hz frequency. Electrochemical impedance spectroscopy (EIS) was used to characterize the electrodes using an impedance model already well described elsewhere [12]. Periodically, polarization curves were performed in order to evaluate changes in the whole cell performance.
Water samples were collected periodically at the exhausts using plastic containers and stored for analysis and their conductivity was measured by means of a Crison mod. 525 conductivity meter. Images of the Pt cathode with different thicknesses were acquired with a FE-SEM (field emission scanning electron microscope) LEO mod.1530, equipped with a high-resolution secondary electrons detector (in-lens detector).
12
3. Results and discussion
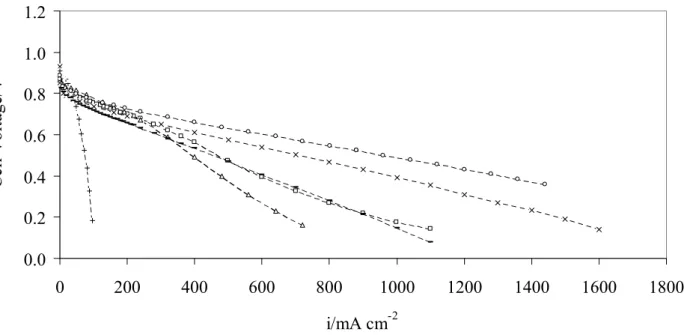
Figure 1 shows the polarization plots for the MEAs with different Pt-PVD cathodes. Particularly, the best performance is obtained with the Pt-100-nm cathode, while an increase or a decrease of the thickness brings a performance reduction.
0.0 0.2 0.4 0.6 0.8 1.0 1.2 0 200 400 600 800 1000 1200 1400 1600 1800 i/mA cm-2 C ell V ol tag e/ V
Figure 1 - Cell voltage vs. current density plot of MEAs with different PVD-cathode thickness. Pt-50-nm (-∆-), Pt-75-nm (-□-), Pt-100-nm (-○-), Pt-125-nm (-▬-), Pt-150-nm (-+-) and reference E-tek (-×-) at 50°C.
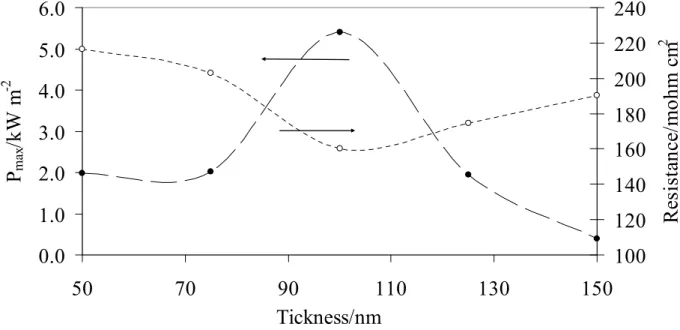
The figure 2 reports the total cell resistance (R) and the maximum power density (Pmax) for the MEAs as a function of the Pt equivalent thickness used on the cathode. A maximum of Pmax which corresponds to the minimum in total resistance is evidenced. The bad performances of 50 and Pt-75 can be ascribed to the low Pt loading. On the other hand, the decrease of performance for Pt-125 and mainly for Pt-150 seem to be related to a limitation in the oxygen diffusion inside the cathode at too high catalyst load.
13
0.0
1.0
2.0
3.0
4.0
5.0
6.0
50
70
90
110
130
150
P
max/kW m
-2100
120
140
160
180
200
220
240
Tickness/nm
Res
is
tan
ce/
mo
hm
cm
2Figure 2 - Maximum power density and total cell resistance of MEAs as a function of the different PVD-cathode thickness.
The Pmax trend plot reflect that obtained by Gruber et al. [14] at 21°C on other kinds of GDEs. These authors explained that in thicker Pt layers, only pores of large diameter are kept open for the gases supply. In addition, these thicker sputtered layers become more dense. This structure limits the water transport in the only few pores remained. That results in a higher resistance and in a lower electrochemically active surface of the sputtered catalyst. In addition a reduced activity in a thicker catalyst layer widens the gap between proton-conducting membrane and gas supply. This may also decrease cell voltage at higher current densities.
These assumptions were confirmed by our SEM images on three Pt cathodes with different thickness that show a more dense structure with the increase of thickness (Fig. 3).
14
Figure 3 – FE-SEM images of Pt cathode thickness Pt-50-nm (A), Pt-100-nm (B), Pt-125-nm (C).
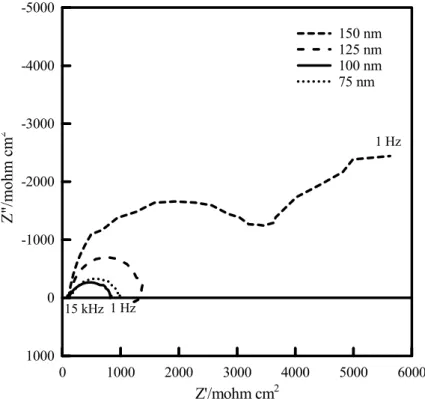
The Nyquist plot (Fig. 4) for the MEAs with different Pt-PVD cathodes confirms these hypothesis. Impedance data are characterised by a single loop at high frequency that is a fairly good indicator of the properties of the cathode, such as the catalyst surface area, catalyst loading and catalyst
A
B
15
utilization [12]. In particular, the increase of the high frequency circle’s diameter, implies an increase of charge transfer resistance Rct related to the oxygen reaction. Thus, the decrease of the Pt
layer under 100 nm produce a decrease of active area of the catalyst's load. On the other side, the increase in Pt thickness produces also a typical second low frequency arc in the Nyquist plot, that is related to slow mass transport phenomena and it can be described by the finite-length Warburg impedance [12]. This effect begin to be evident for the Pt-125 nm cathode that shows a small hump at low frequency and it appears clearly for the Pt-150 nm. It is important to observe that the thickness increase over a certain limit (>100 nm), also decreases the active area (higher Rct) because
it limits the contact of the three boundary zone (gas, membrane, catalyst).
15 kHz 1 Hz 1 Hz 0 1000 2000 3000 4000 5000 6000 -5000 -4000 -3000 -2000 -1000 0 1000 Z'/mohm cm2 Z "/ mo hm cm 2 150 nm 125 nm 100 nm 75 nm
Figure 4 - Nyqvist plot of MEAs with different Pt cathode thickness. Pt-75-nm (⋅⋅⋅), Pt-100-nm (), Pt-125-nm (-⋅-). Pt-150-nm (---) at 0.5 A DC and 0.05 A AC and 50°C.
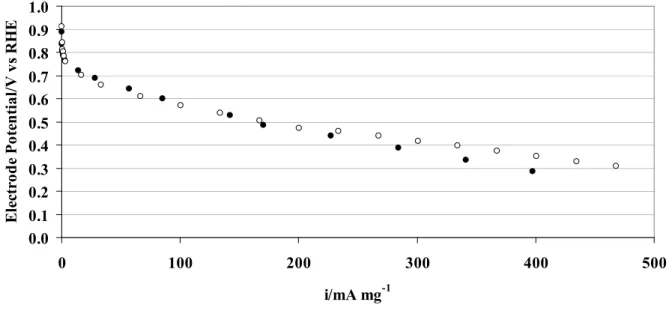
The half-cell measurements on the Pt-100 nm cathode and E-tek (0.20 mg cm-2) were performed in order to compare the electrodes at the same Pt load. In this case, the load amount on Pt-100 nm was exactly measured by UV-Vis spectrometry in 0.17 mg cm-2 [15]. Figure 5 shows the galvanostatic
16
polarisation in oxygen evidencing similar performance of Pt-100-nm with respect to the commercial reference catalyst (0.20 mgPt cm-2). Thus, in a short time working, the two preparative methods
seem comparable. 0.0 0.1 0.2 0.3 0.4 0.5 0.6 0.7 0.8 0.9 1.0 0 100 200 300 400 500 i/mA mg-1 E lect ro d e P ot en ti al /V v s R H E
Figure 5 – Electrode potential vs. current density plot of Pt-100-nm (○) and reference E-tek (●) at 25°C.
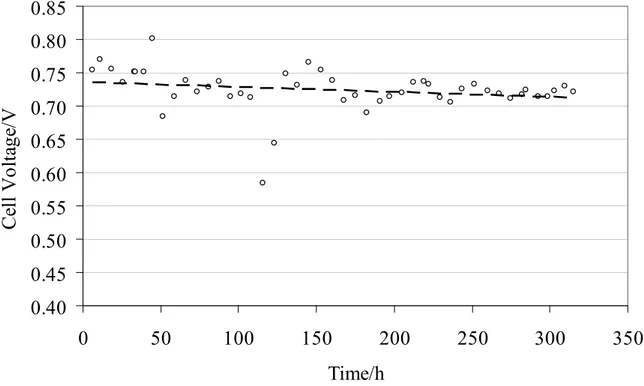
In contrast, figure 6 depicts the cell voltage vs. time curve of MEA prepared with Pt-100-nm cathode. The MEA performance at 70 °C and current density of 140 mA cm−2 decreases at a rate of −75 μV h−1 after 315 h with an average voltage of 0.72±0.03 V. In previous work [12], we have obtained, in similar condition a decrease of only −2.3 μVh−1 for a 2,000-h long-term test on a cell
17
0.40 0.45 0.50 0.55 0.60 0.65 0.70 0.75 0.80 0.85 0 50 100 150 200 250 300 350 Time/h C ell V olta ge /VFigure 6 - Cell voltage vs. time plot of MEA with Pt-100-nm (-○-) cathode thickness at 140 mA cm−2 and 70°C.
Figure 7 show the polarization graph, of the MEA with the Pt-100 nm cathode at 6 and at 150 hours with a well distinguished decrease of performance.
0.0 0.2 0.4 0.6 0.8 1.0 1.2 0 200 400 600 800 1000 Current Density/mA cm-2 C ell V olta ge /V
Figure 7 - Cell voltage vs. current density plot of MEA with Pt-100-nm cathode after 6 (○) and 150 (●) hours at 70°C.
18
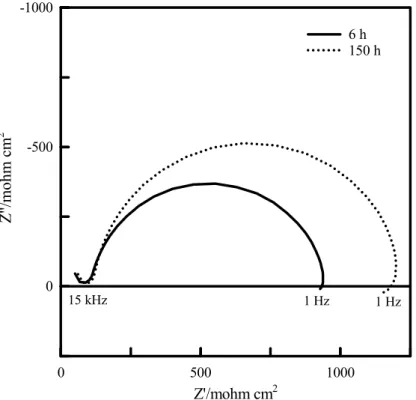
In order to better evaluate the degradation mechanism that acts on the cell, impedance data were collected during the time. As example, the figure 8 shows the Nyquist plot of the cell after 6 and 150 hours. The ohmic resistance, that can be obtained as the intersection of the impedance spectrum with the real axis at 15 kHZ is constant [12]. This resistance is due mainly to the proton transport resistance of the membrane and the resistance of the current collector plates. On the opposite, the charge transfer resistance (Rct), that can be obtained as the circle diameter amongst 15 kHz and 1
Hz, clearly grows. In a PEFC, the Rct of the cathode is much larger than that of the anode; therefore,
this resistance must be referred mainly to the cathode and is a measurement of the charge transfer resistance of the oxygen reduction reaction (ORR).
15 kHz 1 Hz 1 Hz 0 500 1000 -1000 -500 0 Z'/mohm cm2 Z ''/ mo hm cm 2 6 h 150 h
Figure 8 - Nyquist plot of MEAs with Pt-100-nm cathode after 6 () and 150 (---) hours at 0.7 A DC and 0.07 A AC and 70°C.
Figure 9 shows the charge transfer resistance and the ohmic one obtained by the Nyqvist plot executed periodically on the cell. As above observed, the performance loss is not due to an increase in the membrane cell resistance, but to a growth of the Rct. This increase indicates a degradation
19
mechanism due to a decrease of cathode active area during the time. The reduction of the reaction zone can be ascribed to the growth of platinum particles onto the cathode surface or to desegregation of catalytic layer, as has been demonstrated extensively by many authors [16]. The water conductivity measured in the exhaust-collected water at the cathode and anode were very low, respectively 6±1 and 7±1 μS cm-1. As showed in previous works [12,13,17], this parameter is
strictly related to the release of fluoride by the membrane and, in this case confirmed the absence of membrane degradation.
0
200
400
600
800
1000
1200
1400
1600
1800
2000
0
50
100
150
200
250
300
350
Time/h
R
es
is
tan
ce
/m
oh
m cm
2Figure 9 – Ohmic (-○-) and charge transfer (-●-) resistance vs. time of MEA with Pt-100-nm cathode thickness at 140 mA cm−2 and 70°C.
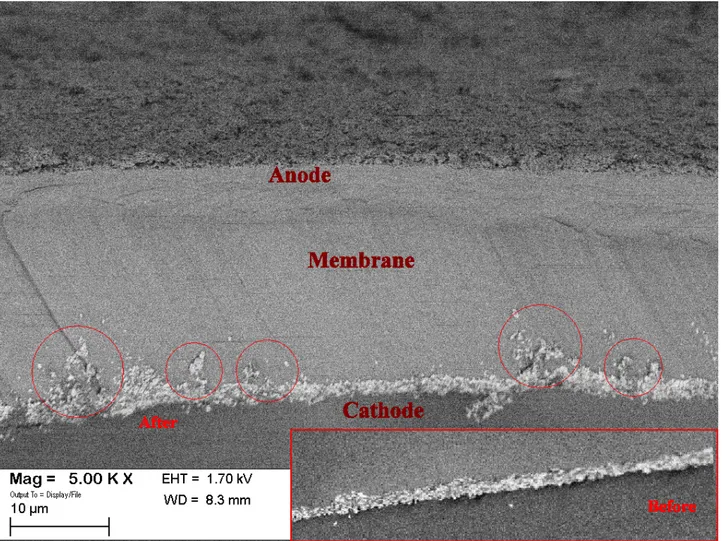
To have a more understanding on the reason of the performances reduction, an investigation by means of FE-SEM was carried out. The figure 10 shows the cross-section of MEA after the prolonged test. These post mortem image highlight a partial spread of the cathode platinum catalyst inside the electrolyte membrane with respect the same interface before. The breaking up of this catalytic layer leads to formation of islands inside the membrane. Thus, the catalyst fragmentation
20
reduce the platinum loading and consequently the catalytic surface available for the electrochemical reaction.
Figure 10 – FE-SEM images of MEA after the prolonged stability test. The red circular areas evidence the fragmentation of Pt-100 nm catalytic layer. In the insert the MEA cathode/membrane interface before the test.
4. Conclusion
This paper has evaluated the performance of cathodes for polymer electrolyte fuel cells, obtained by means of platinum PVD deposition and their durability. Fuel cell tests confirmed: 1) an optimal thickness for the platinum layer of about 100 nm; showed 2) an electrochemical performance of the Pt-sputtered cathode similar with respect to the commercial reference catalyst, for the same Pt load
;
21
decrease of the reaction zone in the catalytic layer. Further studies are needed in order to produce more stable Pt-PVD electrodes with improved Pt adhesion and an higher durability.
22
References
1 A. Bonnefont, P. Ruvinskiy, M. Rouhet, A. Orfanidi, S .Neophytides, E. Savinova, “Advanced catalytic layer architectures for polymer electrolyte membrane fuel cells, WIREs: Energy and
Environnment, vol. 3, pp. 505-521, 2014.
2 S. Hirano, J. Kim, S. Srinivasan, “High performance proton exchange membrane fuel cells with sputter-deposited Pt layer electrodes”, Electrochimica Acta, vol. 42, pp. 1587-1593, 1997
3 S.Y. Cha, W.M. Lee, “Performance of Proton Exchange Membrane Fuel Cell Electrodes Prepared by Direct Deposition of Ultrathin Platinum on the Membrane Surface” J. Electrochem. Soc., vol. 146, pp. 4055-4060, 1999
4 C.K. Wtha, W. Chun, T.I. Valdez, S.R. Narayanan, “Performance of Direct Methanol Fuel Cells with Sputter-Deposited Anode Catalyst Layers”, Electrochem. Solid-State Lett., vol. 3, pp. 497-500, 2000.
5 R. O’Hayre, S.J. Lee, S.W. Cha, F.B. Prinz, “A sharp peak in the performance of sputtered platinum fuel cells at ultra-low platinum loading”, J. Power Sources, vol. 109, pp. 483-493, 2002. 6 P. Brault, A. Caillard, A.L. Thomann, J. Matias, C. Charles, R.W. Boswell, S. Escribano, J. Durand, T. Sauvage, “Plasma sputtering deposition of platinum into porous fuel cell electrodes”, J.
Phys. D: Appl. Phys., vol. 37, pp. 3419-3423, 2004.
7 M. Alvisi, G. Galtieri, L. Giorgi, R. Giorgi, E. Serra, M.A. Signore, “Sputter deposition of Pt nanoclusters and thin films on PEM fuel cell electrodes”, Surface & Coatings Technology, vol. 200 pp. 1325-1329, 2005.
8 M. Shafiei, A.R. Riahi, F.G. Sen, A.T. Alpas, “Improvement of platinum adhesion to carbon surfaces using PVD coatings”, Surface & Coatings Technology, vol. 205, pp. 306–311, 2010.
9 E. Antolini, L. Giorgi, A. Pozio, E. Passalacqua, “Influence of Nafion loading in the catalyst layer of gas-diffusion electrodes for PEFC”, J. Power Sources, vol. 77, pp. 136-142, 1999.
10 L. Giorgi, E. Antolini, A. Pozio, E. Passalacqua, "Influence of PTFE content in the diffusion layer of low-Pt loading electrodes for polymer electrolyte fuel cells", Electrochim. Acta, vol. 43, pp.3675-3680, 1988.
11 R. F. Silva, M. De Francesco, L. Giorgi, M. C. Campa, F. Cardellini, A. Pozio, “Highly stable Pt-Ru/C as an anode catalyst for use in polymer electrolyte fuel cells”, J Solid State Eletrochem., vol. 8, pp. 544–549, 2004.
23
12 A. Pozio, A. Cemmi. F. Mura, A. Masci, E. Serra, R.F. Silva, “Long-term durability study of perfluoropolymers membranes in low humidification conditions”, J Solid State Electrochem, vol. 15, pp. 1209–1216, 2011.
13 A. Pozio, A. Cemmi, F. Mura, A. Masci, and R. F. Silva, “Study on the Durability of Recast NafionTM/Montmorillonite Composite Membranes in Low Humidification Conditions,
International Journal of Electrochemistry, vol. 2011, pp. Article ID 252031, 2011.
14 D. Gruber, N. Ponath, J. Muller, F. Lindstaedt, “Sputter-deposited ultra-low catalyst loadings for PEM fuel cells”, Journal of Power Sources, vol. 150, pp. 67–72, 2005.
15 A. Pozio, M. De Francesco, A. Cemmi, F. Cardellini, L. Giorgi, “Comparison of high surface Pt/C catalysts by cyclic voltammetry”, Journal of Power Source, vol. 105, pp. 13-19, 2002.
16 F.A. de Bruijn, V.A.T. Dam, G.J.M. Janssen, “Durability and degradation issues of PEM fuel cell components”, Fuel Cells, vol. 8/1, pp. 3–22, 2008.
17 A. Pozio, R.F. Silva, M. De Francesco, L. Giorgi, “NafionTM degradation in PEFCs from end plate iron contamination”, Electrochimica Acta, vol. 48, pp. 1543-1549, 2003.
Edito dall’ENEA
Servizio Promozione e Comunicazione Lungotevere Thaon di Revel, 76 - 00196 Roma
www.enea.it
Pervenuto il 10.3.2016
Stampato presso il Laboratorio Tecnografico ENEA - C.R. Frascati Finito di stampare nel mese di marzo 2016
![Table 1 – Calculated Pt loading for the Pt-PVD electrodes. Cathode type [Pt] mg cm -2 Pt-PVD-50 nm 0.11 Pt-PVD-75 nm 0.16 Pt-PVD-100 nm 0.21 Pt-PVD-125 nm 0.27 Pt-PVD-150 nm 0.32 2.3 Physicochemical characterisation](https://thumb-eu.123doks.com/thumbv2/123dokorg/5600027.67664/11.892.332.561.242.464/table-calculated-loading-electrodes-cathode-pvd-physicochemical-characterisation.webp)