Potential of remote sensing
to predict species invasions:
A modelling perspective
Duccio Rocchini
(Department of Biodiversity and Molecular Ecology, Research and Innovation Centre,) Fondazione Edmund Mach, Italy Veronica Andreo
Instituto de Altos Estudios Espaciales ‘Mario Gulich’ Centro Espacial Teofilo Tabanera - CONAE - Falda del Carmen, Argentina
Michael Fo¨rster
(Department of Geoinformation for Environmental Planning,) Technical University of Berlin, Germany
Carol Ximena Garzon-Lopez
(Department of Biodiversity and Molecular Ecology, Research and Innovation Centre,) Fondazione Edmund Mach, Italy Andrew Paul Gutierrez
Center for the Analysis of Sustainable Agricultural Systems (CASAS Global NGO), CA, USA
(Division of Ecosystem Science, College of Natural Resources,) University of California, CA, USA Thomas W. Gillespie
(Department of Geography,) University of California Los Angeles, CA, USA
Heidi C. Hauffe
(Department of Biodiversity and Molecular Ecology, Research and Innovation Centre,) Fondazione Edmund Mach, Italy Kate S. He
(Department of Biological Sciences,) Murray State University, KY, USA
Birgit Kleinschmit
(Department of Geoinformation for Environmental Planning,) Technical University of Berlin, Germany
Paola Mairota
(Dipartimento di Scienze Agro-Ambientali e Territoriali,) Universita` degli Studi di Bari ‘Aldo Moro’, Italy
Matteo Marcantonio
(Department of Biodiversity and Molecular Ecology, Research and Innovation Centre,) Fondazione Edmund Mach, Italy Markus Metz
(Department of Biodiversity and Molecular Ecology, Research and Innovation Centre,) Fondazione Edmund Mach, Italy
Harini Nagendra
(School of Development,) Azim Premji University, India Sajid Pareeth
(Department of Biodiversity and Molecular Ecology, Research and Innovation Centre,) Fondazione Edmund Mach, Italy Luigi Ponti
(Laboratorio Gestione Sostenibile degli Agroecosistemi,) Agenzia Nazionale per le Nuove Tecnologie, l’Energia e lo Sviluppo Economico Sostenibile (ENEA), Centro Ricerche Casaccia, Italy; Center for the Analysis of Sustainable Agricultural Systems (CASAS Global NGO), CA, USA
Carlo Ricotta
(Department of Environmental Biology,) University of Rome ‘La Sapienza’, Italy
Annapaola Rizzoli
(Department of Biodiversity and Molecular Ecology, Research and Innovation Centre,) Fondazione Edmund Mach, Italy Gertrud Schaab
(Faculty of Information Management and Media,) Karlsruhe University of Applied Sciences, Germany
Marc Zebisch
(Institute for Applied Remote Sensing, EURAC,) European Academy of Bozen, Italy
Roberto Zorer
(Department of Biodiversity and Molecular Ecology, Research and Innovation Centre,) Fondazione Edmund Mach, Italy Markus Neteler
(Department of Biodiversity and Molecular Ecology, Research and Innovation Centre,) Fondazione Edmund Mach, Italy
Corresponding author:
Duccio Rocchini, Department of Biodiversity and Molecular Ecology, Research and Innovation Centre, Fondazione Edmund Mach, Via E. Mach 1, 38010, Michele allAdige (TN), Italy.
Email: [email protected]
1–27
ªThe Author(s) 2015 Reprints and permission: sagepub.co.uk/journalsPermissions.nav DOI: 10.1177/0309133315574659 ppg.sagepub.com
Abstract
Understanding the causes and effects of species invasions is a priority in ecology and conservation biology. One of the crucial steps in evaluating the impact of invasive species is to map changes in their actual and potential distribution and relative abundance across a wide region over an appropriate time span. While direct and indirect remote sensing approaches have long been used to assess the invasion of plant species, the distribution of invasive animals is mainly based on indirect methods that rely on environmental proxies of conditions suitable for colonization by a particular species. The aim of this article is to review recent efforts in the predictive modelling of the spread of both plant and animal invasive species using remote sensing, and to stimulate debate on the potential use of remote sensing in biological invasion monitoring and forecasting. Specifically, the challenges and drawbacks of remote sensing techniques are discussed in relation to: i) developing species distribution models, and ii) studying life cycle changes and phenological variations. Finally, the paper addresses the open challenges and pitfalls of remote sensing for biological invasion studies including sensor characteristics, upscaling and downscaling in species distribution models, and uncertainty of results.
Keywords
Biological invasion, ecological niche models, physiologically-based demographic models, satellite imagery, species distribution modelling, species diversity, uncertainty
Acronyms
ENMs: ecological niche models; EVI: Enhanced Vegetation Index; GARP: Genetic Algorithm for Rule-set Prediction; LST: Land Surface Temperature; NDVI: Normalized Difference Vegetation Index; NDWI: Normalized Difference Water Index; PBDMs: Physiologically-Based Demographic Models; SDMs: Species Distribution Models; WBI: Water Band Index.
I Introduction
Biological invasions are a major consequence of global change and have had detrimental ecologi-cal and economic impacts on nearly all parts of the globe (Dullinger et al., 2013; Simberloff and Vitule, 2014). Invasive species continuously challenge biodiversity conservation, human and environmental health and natural resource management (see www.eea.europa.eu/highlights/ invasive-alien-species-a-growing).
Invasive species can profoundly modify the structure and function of invaded ecosystems, alter biotic interactions and homogenize diverse plant and animal communities at large spatial scales, ultimately resulting in a loss of genetic, species and ecosystem diversity (Qian and Ricklefs, 2006). The negative economic impact of invasive species is estimated at over $100
billion annually in the USA alone (NRC, 2002), and more than £239 million in the UK (White and Harris, 2002), and some authors go as far as to claim that they are incalculable (Mack et al., 2000). Collectively, annual eco-nomic losses due to species invasions are about one order of magnitude higher than those caused by all natural disasters put together (see Ric-ciardi et al., 2011).
Given the negative economic and ecological impact of invasive species, a rapid method for detection and prediction of their arrival and spread is critical to allow an effective early assessment of species invasion risk and impact (Malanson and Walsh, 2013).
This review focuses on recent efforts to model the distribution of invasive species using remote sensing, and to stimulate debate on the
potential of remote sensing for monitoring and forecasting biological invasions. Specifically, the article will discuss the strengths, challenges and drawbacks of remote sensing techniques such as: i) the use of remote sensing data in spe-cies distribution models (SDMs); ii) the poten-tial of remote sensing to identify life cycle changes and phenological variations; and iii) open challenges and possible pitfalls regarding remote sensing for biological invasion studies including sensor characteristics, upscaling and downscaling problems in SDMs and uncertainty of results.
II The use of remote sensing (RS)
in invasion studies
1 Using RS to detect and monitor plant
invasions directly
Plant species invasions can potentially be detected directly by remotely sensed data based on the reflectance properties of vegetation in certain portions of the electromagnetic spec-trum (called wavelength windows).
Multispectral sensors at a high spatial resolu-tion have been used to detect tree and shrub invasive species. For example, Carter et al. (2009) demonstrated the power of using Quick-bird data (4 bands, spatial resolution 2.44 m at nadir) to detect tamarisk (Tamarix spp.) along the Colorado River (USA) attaining a classifica-tion accuracy of 91%. However, there were large errors of commission since the moderate spectral resolution used was not sufficient to discriminate tamarisk and non-tamarisk riparian vegetation. A similar example is provided by Mullerova et al. (2013) detecting the distribu-tion of Heracleum mantegazzianum. On the other hand, Wang (2008) demonstrated the greater appropriateness of AISA hyperspectral resolution imagery in comparison to Quickbird, and listed a series of recent successful studies of individual species detection by means of hyper-spectral data.
In general, identifying individual species reliably using satellite-based and aerial imagery is challenging due to the difficulties of choosing and detecting optimal spectral wavelengths to differentiate the target species from others (which may only be possible at certain times of year), and controlling for the effects of vege-tation structural characteristics (Chopping, 2011; Kempeneers et al., 2008; Pisek et al., 2011; Zeng et al., 2009) as well as identifying spatial associations between invasive and closely-related native species (Call and Nilsen, 2003). A number of invasive species have also been identified based on the uniqueness in leaf chemistry using both hyperspectral (Asner et al., 2008, Hestir et al., 2008; Somers and Asner, 2013b) and multispectral (Becker et al., 2013; Schneider and Fernando, 2010) analyses. Leaf water content has also been used success-fully to detect invasive species. For instance, Underwood et al. (2003) were able to use air-borne visible/infrared imaging spectrometer (AVIRIS) imagery with 4 m resolution to detect iceplant (Carpobrotus edulis) and jubata grass (Cortaderia jubata) in Mediterranean-type eco-systems of California because such invasive spe-cies showed higher leaf water content than native co-occurring species.
New prospects for improving the capacity of remote sensing to discriminate plant species come from laboratory studies on the character-istic emissivity spectra of plant species in the mid- and thermal infrared, and from foreseen advances in air-borne and space-borne hyper-spectral thermal sensors (Ribeiro da Luz and Crowley, 2010; Ullah et al., 2012). As an example, it has been demonstrated that the leaf spectral reflectance measurements of Ailanthus altissima – an invasive tree species in Europe and North America (see Burkholder et al., 2011, and references therein) – are useful for determining the date of image acquisition and band selection, two of the main challenges in the design of remote sensing projects on vegetation.
2 Using RS to detect and monitor animal
and pathogen invasions indirectly
Regarding animals and microscopic organisms such as pathogens, the majority of the most devastating invasive species listed by Interna-tional Union for Conservation of Nature and Nat-ural Resources (IUCN) are not amenable to straightforward measurement by remote sensing. This is because the majority of vertebrates and invertebrates, including parasites, and fungal/ microbial species require indirect approaches unless they influence the reflective properties of the dominant canopy (i.e. plant) species (He et al., 2011). This phenomenon is also known as cross-taxon surrogacy or ‘cross-taxon con-gruency of community similarity’ (Su et al., 2004). These concepts can be applied to remote sensing detection as an indirect method to esti-mate animal species invasions.
For example, according to Araujo and Rozenfeld (2014), given two species sp1 and sp2, the probability of co-occurrence (spatial overlap) is given by
Pðsp1 \ sp2Þ ¼ f ðpsp1;psp2;Isp1sp2Þ ð1Þ
where p ¼ probability of occurrence and I ¼ interaction between species.
Hence, equation (1) could reliably be used to detect sp1 relying on its interaction with and the spatial distribution of sp2.
Consequently, the presence of hidden species (including understory plant species or animal spe-cies) might be revealed by taking advantage of their obligate ecological interactions with plant species that can be detected by remote sensors. For instance, the Normalized Difference Vegeta-tion Index (NDVI), a reflectance-derived vegeta-tion index, has been used to provide early warning and monitoring of invasive insects using the tight relationship between defoliation caused by these insects and vegetation indices (Eklundh et al., 2009; Gutierrez et al., 2010; Jepsen et al., 2009; see also Table 1). There are also several cases of pest damage that, while not strictly invasive,
are illustrative of the potential of the NDVI plus remote-sensing approach. For example, mortality of lodge-pole pine induced by bark beetle was predicted and assessed using estimates of stand vigour derived from remote sensed data (Coops et al., 2009). Another interesting case is that of semi-arid areas where green vegetation develop-ment has been related to breeding and upsurge patterns of some insect pests such as locusts and insect vectors of human diseases such as mosqui-toes (Anyamba et al., 2009).
In addition, the Food and Agriculture Organi-zation of the United Nations (FAO) has conducted pioneering studies on desert locusts in Africa using satellite data and NDVI (Cherlet et al., 1991; Hielkema et al., 1986) based on an approach used for plague locusts in Australia (McCulloch and Hunter, 1983). More recently, the same approach has been used to follow the movements of the East Asian migratory locust in China (Ji et al., 2004; Liu et al., 2008; Ma et al., 2005) as well as in Uzbekistan (Sivanpillai and Latchininsky, 2007). NDVI has also proven to be unexpectedly successful in animal ecology for predicting distribution, abundance and life history traits of herbivorous and non- herbivorous species (Pettorelli et al., 2011).
However, for insects, and particularly Lepi-doptera, it has been suggested that high resolu-tion space-borne synthetic aperture radar (SAR) or VHR satellite/air-borne hyperspectral data might be more appropriate (Reynolds and Riley, 2002). Moreover, the effectiveness of such measures could be enhanced by the com-bined use of other technologies to assess tem-poral changes in insect community composition resulting from individual species movement and migration (e.g. Riley and Drake, 2002). Refer to Table 1 for additional examples.
Although accurate estimates have proven dif-ficult to obtain because of the complexity of human factors involved (Charrel et al., 2007), satellite imagery has played a critical role in monitoring disease vector development and dis-persal (Ford et al., 2009) by linking environmental
Table 1. Solving different ecological tasks related to biological invasions by means of remote sensing. Ecological issue Remote sensing data analysis Sensors used in the examples cited Mapping spatial
spread of invasive species
Noise reduction in the spectral signal to avoid information redundancy, e.g. by Principal Component Analysis (PCA, Almeida and De Souza, 2004)
Airborne Visible/Infrared Imaging Spectrometer (AVIRIS, spatial resolution 10–20 m, 224 bands) Appropriate band selection to find peaks of
reflectance of a certain species in a part of the whole electromagnetic spectrum (Bajcsy and Groves, 2004)
Aerial platform with a Regional Data Assembly Centers Sensor (RDACS), model hyperspectral (H-3), a 120-channel prism-grading, push-broom sensor developed by NASA Image classification by maximum likelihood
with post-processing based on training areas in the field (e.g. Lung and Schaab, 2010)
Landsat MSS and (E)TM (spatial resolution 60 or 30 m, 4 or 6 bands)
Logistic regression modelling coupling thousands of field samples and satellite data to rank tamarisk suitability in the 48 continental US states (Morisette et al., 2006)
Moderate Resolution Imaging
Spectroradiometer (MODIS, 250 m to 1 km spatial resolution, 36 bands)
Linear Discriminant Analysis applying classification algorithms in many spectral dimensions at a time and reducing them to single linear dimensions (Duda and Hart, 1973)
General description, no specific sensors described
Classification by decision trees relying on Breiman Cutler Classification where a small group of variables is used to distinguish classes (Lawrence et al., 2006)
Probe-1 sensor (5 m spatial resolution, 128 bands)
Classification by object-oriented
approaches, overcoming salt-and-pepper effect based when relying on per-pixel classes (Bunting and Lucas, 2006)
Multispectral Compact Airborne Spectrographic Imager (CASI, 5 m spatial resolution, 15 bands) Prediction of Robinia pseudoacacia spread
based on low-cost remote sensing data sources together with a priori forest distribution information (Somodi et al., 2012)
Aerial photos (0.5 m spatial resolution), Landsat ETMþ (30 m spatial resolution, 7 bands)
Integration of optical and microwave remote sensing data to detect sub-canopy invasive plant species by decision tree algorithms (Ghulam et al., 2014)
IKONOS (4 m spatial resolution, 4 bands), Geoeye-1 Stereo (1.64 m spatial resolution, 4 bands), Hyperion (30 m spatial resolution, 196 bands), Landsat-5 TM and Landsat 7 ETMþ (30 m spatial resolution, 6 and 7 bands respectively), Radarsar-2 (8 m spatial resolution, SAR active sensor), PALSAR (12.5 m, SAR active sensor)
parameters to disease outbreaks. For example, the spread of the mosquito vector of Rift Valley Fever (RVF), a severe viral disease in Africa, has been monitored with the help of satellite data (Linthi-cum et al., 1987). Furthermore, by using a combi-nation of satellite measurements including NDVI, Anyamba et al. (2009) made the first prediction of an RVF outbreak for the Horn of Africa. Simi-larly, satellite data are now being harnessed to monitor and predict vector presence and,
therefore, malaria incidence (Caminade et al., 2014; Rogers et al., 2002; Tompkins and Ermert, 2013).
Though the majority of the studies have made use of NDVI as one of the ancillary variables for species distribution modelling, additional spec-tral indices have been used in invasive species mapping. For instance, the Enhanced Vegeta-tion Index (EVI) has often been used as an alter-native to NDVI as it is less influenced by
Table 1. (continued)
Ecological issue Remote sensing data analysis Sensors used in the examples cited Using time series
to incorporate phenology in invasion research
Air-borne time series analysis, including the detection of phenological differences between invasive and native species (Bradley and Mustard, 2006)
Landsat TM (spatial resolution 28.5 m, 8 bands), multispectral Advanced Very High Resolution Radiometer (AVHRR, 1 km spatial resolution, 6 bands) Bloom detection by multi-temporal data
based on the Mixture Tuned Matched Filtering (MTMF) algorithm (Glenn et al., 2005)
HyMap hyperspectral data (3.5 m spatial resolution, 126 bands)
Detection of spectral dissimilarity for different flowering stages based on Root mean Squared Error distance among spectra (Ge et al., 2006)
Multispectral Compact Airborne Spectrographic Imager (CASI, 5 m spatial resolution, 15 bands) Explicit comparison between single-scene
and time series analysis to detect invasive tamarisk (Evangelista et al., 2009)
Landsat ETMþ (30 m spatial resolution, 7 bands) Discriminating invasive species based on leaf and canopy biochemical and physiological properties
Determining compositional changes of native ecosystems based on canopy spectral signatures and measured leaf parameters (Asner et al., 2008)
Airborne Visible/Infrared Imaging Spectrometer (AVIRIS, spatial resolution 10–20 m, 224 bands)
Deriving physiological indices of
pepperweed from hyperspectral data and discriminating flowering and fruiting from co-occurring species (Andrew and Ustin, 2006)
HyMap hyperspectral data (3.5 m spatial resolution, 126 bands) coupled with LiDAR data
Upscaling from leaf to canopy level the spectral and chemical behaviour of tropical forest trees based on field spectroscopy (Asner et al., 2008)
Field custom-designed, full-range
spectrometer, 1.4 nm sampling (FR-Pro with Select Test detectors; Analytical Spectra Devices, Inc., Boulder, CO, USA)
background soil effects or saturation effects due to dense vegetation areas (Cord and Ro¨dder, 2011). Furthermore, other indices, such as the Normalized Difference Water Index (NDWI), have been used for mapping Anopheles larval habitats, sources of malaria vectors (Machault et al., 2012).
Concerning hyperspectral imagery, narrow band indices have allowed investigation of dif-ferent levels of plant stress and decline due to pest infestation. For example, Pontius et al. (2005) found that reflectance at a chlorophyll sensitive wavelength (R683 nm, using AVIRIS data), together with a Water Band Index (WBI, R970/R900), was able to predict the decline in eastern hemlock (Tsuga canadensis) forests due to the hemlock woolly adelgid (Adelges tsugae) pest. Refer to Table 2 in Pontius et al. (2005) for an exhaustive list of narrow band indices which have strong relationships with the decline of specific physiological responses.
Aside from the use of spectral indices which might be similar in substantially different climatic regions (Fitzpatrick et al., 2008), land surface temperature (LST) has been used successfully in northern Italy (Rizzoli et al., 2007) for a risk assessment of tick-borne encephalitis virus (TBEv); an emerging zoonotic tick-borne patho-gen whose life cycle is strictly related to varia-tions in temperature, with an increasing incidence in central Europe during the last few decades (Carpi et al., 2008). In addition to mos-quitoes and ticks, remote sensing has been applied successfully to the study of other arthropod vec-tors of disease such as blackflies (vecvec-tors of onch-ocerciasis), tsetse flies (sleeping sickness) and sandflies (leishmaniasis), which impact human health across the globe (Kalluri et al., 2007).
III Using remote sensing
to improve species distribution
models
SDMs may be correlative (ecological niche mod-els, ENMs) or mechanistic
(physiologically-based demographic models, PBDMs), and are rooted in niche theory (Chase and Leibold, 2003; Elton, 1927; Grinnell, 1917; Hutchinson, 1957). ENMs attempt to identify the set of condi-tions that best predict the geographic distribution of a species by means of algorithmic char-acterization of environmental features of sites of known occurrence (Elith et al., 2006; Pearson and Dawson, 2003; see Table 2). Each algorithm in this so-called correlative approach is designed to extract the relationship between environ-mental variability and occurrence of the target species (See Dormann et al., 2012, for a compar-ison between correlative and process-based SDMs). This relationship is then used to predict the probability of species distribution in non-sampled localities or areas based on their envi-ronmental conditions (Guisan and Zimmerman, 2000). ENM techniques vary in the way relevant explanatory variables are selected, how the con-tribution of each variable is weighted and how the occurrence patterns are predicted (Elith et al., 2006). In addition, while some model algo-rithms only use presence data, others require both presence and absence data (Elith and Leathwick, 2009). The selection of the appropriate model to use for analysis will depend on the availability of data and the underlying hypothesis. However, some already well-established methods, such as MaxEnt (Maximum Entropy, Phillips et al., 2006) or boosted regression trees (Elith et al., 2008), seem empirically to outperform several traditional techniques (Elith et al., 2006). Furthermore, ensemble modelling that combines information from multiple models to detect areas of high model agreement, where the invasive species is more likely to be found, appear to improve the likelihood of successful prediction (Stohlgren et al., 2010).
Remote sensing data have been used as ancillary spatial variables to improve species distribution models both spatially and temporally (e.g. Andrew and Ustin, 2009; Bradley and Fleishman, 2008; Gillespie et al., 2008; Saatchi et al., 2008). In particular,
Table 2. Advantages and disadvantages of ecological niche models (ENMs) and physiologically-based demo-graphic models (PBDMs).
Modelling
procedure Advantages Disadvantages ENMs (ecological
niche models)
– Often they are the only readily available methods for estimating the ecological niche of invasive species (Warren, 2012); – They are a useful first
approximation if the limitations of the models are considered (Pearson and Dawson, 2003); – They are often good to describe
the current ranges of species (Jeschke and Strayer, 2008; Elith and Leathwick, 2009).
– Inability to account for species interactions (Gutierrez et al., 1974; Working group II IPCC, 2013);
– Lack of an explicit description of physiological mechanisms (Gutierrez et al., 1974; Working group II IPCC, 2013);
– Inability to account for population processes (Gutierrez et al., 1974; Ibanez et al., 2014; Working group II IPCC, 2013);
– Overestimation of impact (Bradley, 2013); – Low management value (Bradley, 2013); – They are static, hence of limited value when
making predictions in newly invaded areas or under changing climate (Bradley, 2013; Fitzpatrick and Hargrove, 2009; Gutierrez et al., 1974);
– They make implicit ecological and mathematical assumptions with no mechanistic basis (Gutierrez and Ponti, 2014a; Gutierrez et al., 2010; Gutierrez et al., 2011; Soberon and Nakamura, 2009); – Often they make use of aggregate weather
data that may miss important short-term weather effects (Gutierrez and Ponti, 2014a; Gutierrez et al., 2010; Gutierrez et al., 2011). PBDMs
(physiologically-based
demographic models)
– Inbuilt ability to account for species interactions: the same model explicitly describes and links species at several trophic levels, also including physiological mechanisms via supply–demand physiology (Gutierrez, 1996; Gutierrez et al., 1994); – They are independent from
species distribution records (Gutierrez et al., 2010) while they can account for population processes via age-mass
structured population dynamics with daily time steps (Gutierrez, 1996; Gutierrez et al., 1994);
– They may be less readily available than ENMs, due to a potential lack of laboratory and field data required to model species biology, but data gaps can be filled given a dedicated scientific infrastructure (Gutierrez et al., 2011);
– Apart from immigration rates, movement is not included, limiting their use in predicting the regional species’ spread with high accuracy (Gutierrez, 1996; Gutierrez et al., 1994), but progress on the matter is being made (Gilioli et al., 2013).
remote sensing may considerably improve the reliability of SDMs as these are usually based on occurrence data that are a poor proxy for abundance and tend to overestimate projected impact vastly (Bradley, 2013).
In addition, remotely sensed data layers can also be used to estimate the ecological niche of species in SDMs indirectly (see Peterson et al., 2011). This was done by Roura-Pascual et al. (2006), who used MODIS NDVI and EVI data as input to the Genetic Algorithm for Rule-set Prediction (GARP) ecological niche model to predict the potential geographic distribution of the Argentine ant (Linepithema humile), one of the five ant species ranked among the world’s 100 most successful and widespread invaders listed by the IUCN. In India, Narendra and Ramachandra (2008) analysed the relationship between NDVI and the location of nesting sites of different ant species, including some invasive species. Cord and Ro¨dder (2011) used the Max-Ent model to show that, by including multi-temporal remote sensing data in the SDMs, it was possible to account for habitat availability. In Oregon, USA, Shirley et al. (2013) used boosted regression tree models to analyse relationships between distributions of birds and raw reflec-tance values from Landsat Thematic Mapper data. In that study, models based on individual
reflectance bands were more accurate than those using only NDVI, and the authors concluded that freely available Landsat imagery may be partic-ularly useful in developing SDMs when predic-tions at higher-resolution are required (Shirley et al., 2013).
Concerning habitat suitability modelling, Andrew and Ustin (2009) developed a habitat suitability model to assess the ability of advanced remote sensing data for evaluating habitat sus-ceptibility to invasion by pepperweed (Lepidium latifolium) in California’s San Francisco Bay/ Sacramento–San Joaquin River Delta. Their study used both predictor and response variables derived from remote sensing. In particular, the presence/absence data of the invasive species was drawn from a hyperspectral image. Predictor variables were derived from a high resolution LiDAR (light detection and ranging) DEM (digi-tal elevation model). An aggregated classifica-tion and regression tree model was used to evaluate habitat suitability of pepperweed, find-ing that pepperweed invaded relatively more suitable (i.e. less stressful) sites along inundation and salinity gradients.
ENMs are widely used SDMs that interpolate or extrapolate from point observations over space in order to predict the occurrence of a spe-cies for locations where survey data are lacking
Table 2. (continued) Modelling
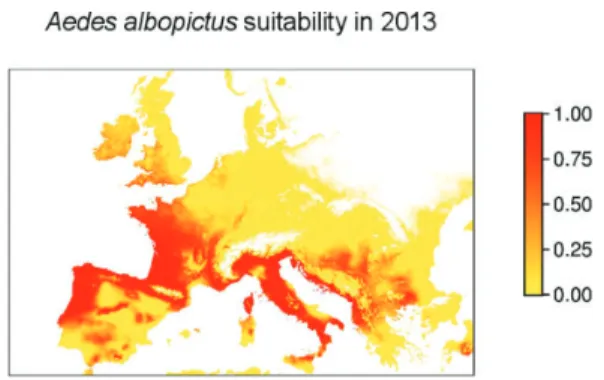
procedure Advantages Disadvantages – They provide measures of species
invasiveness (i.e. potential geographic distribution and relative abundance) with high management value (Gutierrez and Ponti, 2013);
– They may be used as the production function in a bioeconomic analysis to assess economic effects (Gutierrez and Ponti, 2014b: Gutierrez and Regev, 2005; Ponti et al., 2014).
(Franklin, 2010), and they show great potential for landscape functional connectivity studies (Mairota et al., 2011). The output of an ENM is a map indicating the potential distribution of a species, but it can also be applied to map higher levels of species assemblages such as communities or vegetation types (Casalegno et al., 2011; Ferrier et al., 2002). These maps are a basic tool for many aspects of resource man-agement and conservation planning (Franklin, 2010). If the species under study is a pest or dis-ease organism capable of affecting plants, ani-mals or humans, then the prediction of its distribution or potential distribution may serve both public health and production-economy goals (Elith et al., 2006; Franklin, 2010; Guisan and Zimmerman, 2000; Gutierrez and Ponti, 2013; Peterson et al., 2011). In particular, pre-dicting the potential distribution of invasive species using SDM correlative methods such as ENMs poses special challenges because in new scenarios the species can either occupy environments outside their native range or occupy a more restricted set of environmental conditions (e.g. see Guisan and Thuiller, 2005). Despite limitations, these methods can be very useful in predicting possible locations of spread on which managers can focus their attention to limit potential future damage (Zhu et al., 2007), and in many cases they are the only readily available methods for estimating the ecological niche of a species and may provide a useful first approximation if the results are interpreted with due consideration of the limita-tions of the models (Warren, 2012).
Given the ecological and economic impor-tance that invasive species may have, the application of SDM and other approaches (e.g. indirect genetic or direct estimates of dis-persal capabilities) to assess invasion risk is an active area of research (Franklin, 2010). How-ever, recent literature deals clearly with the risks of policy or management failures associ-ated with heavy reliance on correlative approaches (Barve et al., 2011; Dawson
et al., 2011; Guisan et al., 2012, 2014; Petit-pierre et al., 2012; Roubicek et al., 2010; Sin-clair et al., 2010; Veloz et al., 2012; Webber et al., 2012; Wiens et al., 2009). These authors conclude that predicting the potential geo-graphic distribution and relative abundance of invasive species requires both a realistic repre-sentation of the processes underlying species invasions, including the interactions with other species (e.g. trophic interactions), and that these processes are driven by climate indepen-dently of correlative measures of occurrence (Gutierrez and Ponti, 2013).
An alternative approach to correlative meth-ods is the development of mechanistic PBDMs that capture the demographic response of a spe-cies to climate and trophic interactions and pre-dict the distribution from its biology (Gutierrez and Ponti, 2013; Gutierrez et al., 1974; Gutierrez et al., 2005, 2010). The PBDM approach bridges the gap between field experiments used to study global change biology and climate envelope approaches used in macroecology (Kerr et al., 2007). By linking biological processes explicitly to their environmental drivers (not implicitly via proxies), and accessed via data layers of wide spatial and temporal coverage including remote sensing data, PBDMs bridge the gap between bottom-up (primarily physiological and popula-tion dynamics) and top-down (climatological) Geographic Information Systems (GIS) approaches for assessing on-ground ecosystem-level questions including biological invasions. For example, the prospective distribution of the glassy-winged sharpshooter (Homalodisca vitri-pennis) in North America was shown to be restricted by the action of egg parasitoids (Gutierrez and Ponti, 2013). The PBDM approach can also use species distribution data for validation, though such data are often lacking or too sparse to test the predictions.
Table 2 reports advantages and disadvan-tages of Ecological Niche Models (ENMs) and PBDMs (Physiologically-Based Demographic Models).
IV Life cycle changes
and phenological variations
captured by remote sensing
Phenological studies are critical to understand how species change and adapt their life cycles, especially in view of recent climate warming. Remote sensing has a great potential for directly tracking phenology for plants and indirectly determining temporal and spatial changes in habitat suitability for animals.
Different models have been developed to understand the nature of the geometry of vege-tation in relation to its spectral behaviour (see Eastman et al., 2013; Fo¨rster et al., 2010; Nagai et al., 2010). While the concept of a spectral library has been proven for spectrally homoge-neous and stable features (e.g. geological for-mations at coarse spatial scale), the spectral response of plant species varies with phenology, stress and environmental conditions (Kumar et al., 2001). This variation impairs the transfer-ability of relations between vegetation and spec-tra and hence affects the use of specspec-tral libraries (Eastman et al., 2013; Feilhauer and Schmid-tlein, 2011). However, if the complete vegeta-tion cycle can be included with measurements of field spectra, a relation between remote sen-sing imagery and a spectral library is possible for a given date of acquisition (Fo¨rster et al., 2010).
On the other hand, relying on time series data, phenological changes allow ecologists to gain better understanding of species life cycle events and seasonal dynamics of populations and assemblages. Phenology also plays a signif-icant role in detecting and mapping the spatial distribution of invasive species in remote sen-sing applications (He et al., 2011). Multi-date remotely sensed images have become very use-ful in invasion studies. In particular, the unique phenology of some invasive species provides a sound basis for spectral differences between tar-geted species and co-occurring native vegeta-tion (Evangelista et al., 2009; Ge et al., 2006;
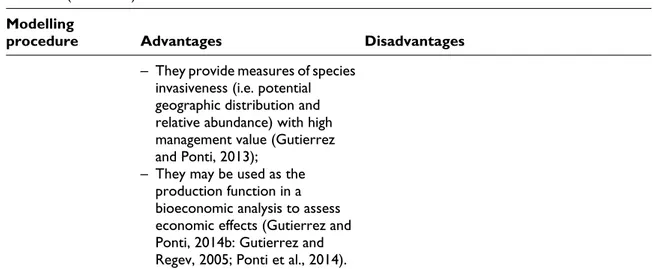
Peterson, 2005; Singh and Glenn, 2009; Wil-liams and Hunt, 2004). Examples of an assem-blage of invaders identified in this way include downy brome (Bromus tectorum), leafy spurge (Euphorbia esula), yellow starthistle (Centaurea solstitialis) and pepperweed (Lepi-dium latifolium).
Bradley and Mustard (2006) demonstrated how inter-annual data collected from the Advanced Very High Resolution Radiometer (AVHRR) can be used effectively to detect downy brome (Bromus tectorum) populations in the Great Basin. They were able to identify the phenological differences between the inva-ders and native flora within a single growing season. The same invasive species was also studied by Noujdina and Ustin (2008) using multi-date AVIRIS data in south-central Washington, USA. The authors compared the detectability of downy brome from single-date and multi-date AVIRIS data using a mixture-tuned matched filtering algorithm for image classification. They concluded that the use of multi-date data increased the accuracy of downy brome detection in the semi-arid rangeland eco-systems. The accuracy is a direct result of clear spectral differences controlled by phenological dissimilarities between downy brome and sur-rounding vegetation (see Figure 1).
Similarly, Glenn et al. (2005) used HyMap hyperspectral data collected over two years to detect the infestation of leafy spurge (Euphorbia esula) in Idaho, USA. A slight difference in leafy spurge reflectance was found between 2002 and 2003 images that was likely a result of slight changes in flowering time and date of the image acquisition. The authors also performed accuracy assessments for annual classification data and found that user accuracies were all above 70%, suggesting that the image processing methods were repeatable between years.
Phenology and other environmental attributes derived from remote sensing are crucial for both land cover/land use and habitat mapping using categorization schemes such as those developed
by Food and Agriculture Organization of the United Nations (FAO) in the land cover classifi-cation system (LCCS) (Di Gregorio and Jansen, 1998, 2005) and by Bunce et al. (2011) in the Gen-eral Habitat Categories (GHCs). Both are useful tools for the monitoring of habitat qualitative fea-tures from the perspective of vegetation dynamics induced by global warming coupled with anthro-pogenic disturbances (Franklin, 2010).
Hestir et al. (2008) successfully used hyper-spectral remote sensing to identify both aquatic and wetland invasive weeds in the Sacramento– San Joaquin Delta: the terrestrial riparian weed, pepperweed (Lepidium latifolium); the floating aquatic weed, water hyacinth (Eichhornia cras-sipes); and the submerged aquatic weed, Brazilian waterweed (Egeria densa). They found signifi-cant differences in phenology among the three species. For example, Brazilian waterweed has two growth peaks, an early one during the begin-ning of the summer and another one during late summer. They suggested that a later acquisition in summer may reduce omission errors as plants may be given more time to grow to the water sur-face. They concluded that classification accuracy could be improved by mapping each phenological stage individually for all three invasive species.
In the tropics, time series of space-borne Hyperion data have been used to study the dynamic changes and invasive species in Hawaiian rainforests (Asner et al., 2006). The authors compared the structural, biochemical and physiological characteristics of an invasive nitrogen-fixing tree (Myrica faya) and a native tree (Metrosideros polymorpha) in humid mon-tane forests. By using nine scenes of Earth Observing-1 Hyperion satellite data spanning a period from July 2004 to June 2005, including a transition from drier/warmer to wetter/cooler conditions, the authors successfully identified the basic biological mechanisms favouring the spread of an invasive tree species and provided a better understanding of how vegetation–cli-mate interactions affect plant growth during an invasion process.
In general, most understory invasive species are hard to detect and map by remote sensing since they are usually hidden by overstory canopy. However, in some cases, a temporal win-dow may exist when a clear phenology difference exists between native overstory species and understory invaders (Somers and Asner, 2013a). Wilfong et al. (2009) effectively detected the distribution of an understory invasive shrub, Amur honeysuckle (Lonicera maackii), in the deciduous forests of south-western Ohio, using phenological difference between Amur honey-suckle and co-occurring native tree species in the
Figure 1. Maps of downy brome Bromus tectorum abundance predicted by the analysis of three different datasets derived from the air-borne hyperspectral Advanced Visible Infrared Imaging Spectrometer (AVIRIS): (1) Multi-temporal spectral stack; (2) July 2000 spectral data; and (3) May 2003 data. The overall accuracy coefficients for the three downy brome occurrence maps were: 0.81 for multi-temporal data-set, and 0.70 and 0.72 for 2000 and 2003 datasets (reproduced from Noujdina and Ustin (2008), under the permission of Weed Science and Allen Press Publishing Services).
canopy. In this case, the invading shrub leafs out earlier in the spring and retains leaves longer in the fall than native deciduous species. Therefore, the best acquisition windows for remote sensing could possibly be the early spring and late fall when native deciduous species are leafless.
A key point when using remote sensing is the consideration of the correct time step in which a certain species and/or class may be detected. An example is provided by Evange-lista et al. (2009) mapping tamarisk invasion in Arkansas River in south-western Colorado (USA). The authors demonstrated the power of using multi-temporal analysis to identify the time frames in which the phenological attributes of a plant species may help to discriminate invad-ing tamarisk formations from other vegetation types (see Table 1).
Although it is possible to locate a few large species, such as elephants, using today’s high resolution remote sensing imagery, in contrast to plant species most animal species cannot be
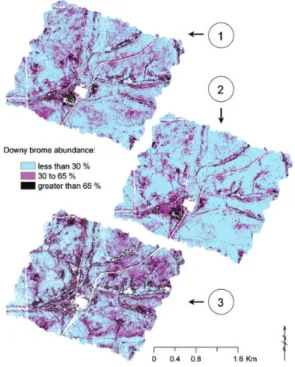
detected directly. Their elusive and secretive nature requires approaches based on proxies and surrogates of animal distribution and diversity such as habitat suitability, photosynthetic pro-ductivity, multi-temporal patterns, structural properties of habitat and forage quality, together with animal life cycles (Leyequien et al., 2007). For example, Neteler et al. (2011; see also Roiz et al., 2011) used temperature thresholds (derived from satellite MODIS data) which drive tiger mosquito (Aedes albopictus) survival in the Province of Trento (northern Italy) along with data on its life cycle in the area to provide both spatial distribution maps of the species and spread prediction in space and time. In Figure 2, applying the same approach, we estimated the areas suitable for Aedes albopictus within Eur-ope for the year 2013, based on January mean temperature, average annual temperature and annual rainfall. The thresholds for these cli-matic parameters were taken from Kobayashi et al. (2002). The method is based on MODIS data at a resolution of 250m, which allowed us to estimate LST for creating thresholds and esti-mating the suitability for the insect. The LST values are available at http://gis.cri.fmach.it/ eurolst/ (see also Metz et al., 2014).
In addition, band ratios, together with NDVI, LST, and rainfall, have been used to predict abundance, distribution and seasonality of disease-transmitting invertebrate vectors (see Leyequien et al., 2007, and references therein) such as the tsetse fly (Glossina spp.; Robinson et al., 1997), the midge (Culicoides imicola), vector of bluetongue virus (Baylis and Rawl-ings, 1998), and the gipsy moth (Lymantria dis-par; Nelson, 1983). Similar approaches have been used to predict the abundance and distribu-tion of vertebrate species such as the long-tailed colilargo (Oligoryzomys longicaudatus), the rodent responsible for hantavirus pulmonary syndrome in southern Argentina and Chile (Andreo et al., 2011), and the great gerbil, one of the rodent hosts of the Bubonic plague in cen-tral Kazakhstan (Wilschut et al., 2013).
Figure 2. Animal species can be detected based on proxies and surrogates of animal distribution such as habitat suitability. In this example, reconstructing land surface temperature (LST) maps from remote sensing (MODIS data) may allow the prediction of the suitability for the spatial distribution of tiger mosquito (Aedes albopictus) and the forecasting of its spread in the future, under different climate scenarios. This Figure represents the potential spread of Aedes albopictus in South and Middle Europe in 2013 and has been created by the Free and Open Source Software GRASS GIS (Neteler et al., 2012).
V Open challenges and pitfalls
regarding remote sensing for
biological invasion studies
1 Sensor characteristics
Nagendra and Rocchini (2008) reviewed issues related to the resolution of remotely sensed data to study biodiversity, including biological inva-sion, and provided an extensive table with all the characteristics of such sensors (see Table 1 in Nagendra and Rocchini, 2008). According to this review, most of the relevant research in biodiversity and biological invasion is focused on throughput of hyper-spatial resolution data.
This observation was further reinforced by He et al. (2011), who showed a number of useful examples of studies relying on hyperspectral remote sensing to detect invasive species in different habitats and sites, from riparian vege-tation in South California (Hamada et al., 2007), to terrestrial ecosystems in South Africa (Rouget et al., 2003), to California grasslands (Miao et al., 2006).
From this point of view, Nagendra and Roc-chini (2008) also found that ‘the devil is in the detail’, providing several examples where remote sensing data with a higher fragmentation of the electromagnetic spectrum (higher spec-tral resolution) may outperform high spatial resolution data in studies of species patterns over space and time. This is particularly true considering the high level of noise in the spec-tral signal deriving from shadows when using hyper-spatial data.
As previously stated, in some cases direct detection of invasive plant species may rely on the spectral signature of a given species in the electromagnetic space. As an example, Somers and Asner (2012) distinguished invasive and non-invasive tree types using space-borne ima-ging spectroscopy to analyse the seasonal dynamics of the canopy hyperspectral reflec-tance properties. A similar methodology was applied by Bentivegna et al. (2012) to detect
cutleaf teasel (Dipsacus laciniatus) in Missouri, while Yang and Everitt (2010) concentrated on invasive weed species. Moreover, in some cases, the hyperspectral information has been supported by LiDAR-based DEM (Asner et al., 2010), proving the availability of a wide range of remote sensing products for invasive species detection.
Furthermore, different classification methods may be adopted to make use of hyperspectral imagery profitably for detecting plant species invasion. Once specific spectral signatures of single vascular plant species (mostly trees and shrubs; Carlson et al., 2007) have been identi-fied, different classification algorithms can be applied. When using hyperspectral data, the most commonly used algorithms are based on: i) unsupervised classification that aggregates pixels into classes based on spectral values with numerous clustering algorithms, including Iso-data and K-means (Shanmugam et al., 2006); ii) maximum likelihood (e.g. Carter et al., 2009), which simply estimates each class mean and variation from training data; iii) linear dis-criminant analysis (LDA; Duda and Hart, 1973) using discriminant functions for each class based on the within-class covariance matrix; or iv) the spectral angle mapper (SAM; e.g. Clark et al., 2005), which is a spectral matching technique comparing each sample spectrum with several reference spectra (Kruse et al., 1993). Together with these algorithms, more recent tech-niques have been developed based on decision trees (e.g. random forest; Lawrence et al., 2006), or object-oriented approaches (Bunting and Lucas, 2006; Plaza et al., 2009).
Images acquired by hyperspectral sensors have been used to map invasive plants in vari-ous regions in the USA and other parts of the globe. Underwood et al. (2003) properly used the AVIRIS imagery with 4m resolution to detect iceplant (Carpobrotus edulis) and jubata grass (Cortaderia jubata) in Califor-nia’s Mediterranean-type ecosystems using
three image processing techniques (Minimum Noise Fraction Transform, Continuum Removal and Band Ratio Indices). Their study concluded that the Continuum Removal is a reliable method for depicting presence/absence of ice-plant within the scrub community. However, the Minimum Noise Fraction Transform and Band Ratio Indices methods were most accurate in delineating the spatial distribution and density of iceplant and jubata grass.
When dealing with plant species, remote sen-sing direct detection is one of the most valuable methods and is akin to niche-based modelling techniques. This is true also when relying on multi-spectral sensors, i.e. when fewer spectral bands are available. As an example, Pouteau et al. (2011), modelling the distribution of the invasive tree species Miconia calvescens in Tahiti tropical rain forests, demonstrated that relying on direct remote sensing may outper-form niche-based modelling techniques by comparing Support Vector Machine classifica-tion of Quickbird images (spatial resoluclassifica-tion 2.44m at nadir) versus the GARP developed by Stockwell and Peters (1999). Table 1 represents a summary of the use of different remote sensing sensors and data analysis to solve ecological issues related to species invasion, while readers are referred to Underwood et al. (2007) and Huang and Asner (2009) for a description of case studies comparing different sensor types.
2 Upscaling and downscaling problems
in SDMs
Compared to field observations, coverage and resolution of biophysical data derived from remote sensing satellite data substantially increase the potential to assess biological inva-sions under different climate change scenarios (e.g. those provided by the Intergovernmental Panel on Climate Change, IPCC) on a regional and global scale, especially given the increasing availability of satellite data with regional and global coverage and increasing resolution detail
(Camps-Valls et al., 2009; Mendelsohn et al., 2007; Turner et al., 2003). This is because miss-ing variables, inadequate duration, temporal and spatial gaps and declining coverage are perva-sive limitations of field data (Clark et al., 2001; Pettorelli et al., 2005). On the other hand, satellite data are currently subject to errors that substantially reduce their ecological applica-tions when not integrated with reliable field data (Kerr and Ostrovsky, 2003). Such integration of field and remotely sensed data now occurs through new interdisciplinary approaches that have collectively been termed ‘satellite ecol-ogy’ (Muraoka and Koizumi, 2009).
Remote sensing has long been used to esti-mate plant invasions by direct (and indirect) approaches, but the need to make predictions about higher trophic levels under climate change requires mechanistic alternatives to environmen-tal proxies of invasion suitability.
Invasive species assessment currently faces the same key challenge as other ecosystem assess-ments: to determine how the biotic and abiotic context alters the direction and magnitude of cli-mate change effects on biotic interactions (Davis et al., 1998; Tylianakis et al., 2008). However, the known mismatch between sparse field observa-tions and the spatially and temporally continuous coverage of remote sensing data leads to a gap that has been addressed mostly via indirect correlative approaches in the form of ecological niche models (ENMs) (Kerr et al., 2007). ENM approaches have been successful in reducing this mismatch, but their correlative use of remote sensing data as proxies for environmental variables prevents a mechanistic assessment of biotic interactions under climate change and hence hampers reliable projections (i.e. extrapolation) outside observed climate space (Araujo and Luoto, 2007; Guisan and Thuiller, 2005; Tylianakis et al., 2008; van der Putten et al., 2010; Wardle et al., 2011; Zarnetske et al., 2012). PBDMs circumvent this limitation by explicitly modelling the weather-driven biol-ogy of the invasive weed, yellow starthistle, and its natural enemies (Gutierrez et al., 2005,
2010). Albeit substantially close to the correlative end of the process-correlation model continuum (Higgins et al., 2012), an interesting advance in the application of SDMs is provided by hybrid approaches (Midgley et al., 2010) which integrate landscape models (Mladenoff, 2004) and both SDM and population viability models (Akca-kaya, 2000). Landscape models, in particular, allow simulation of spatially explicit simplifica-tions of vegetation dynamics over large spatial scales.
Remote sensing has the potential for improv-ing the reliability of SDMs for assessimprov-ing biolo-gical invasions. When used with ENMs, remote sensing data may improve the manage-ment value of these correlative approaches that have proven to overestimate impact, with asso-ciated increased risk of policy or management failure. An alternative approach to correlative methods is mechanistic PBDMs where pro-cesses including those underpinning biological invasions are linked explicitly to environmental drivers that may be accessed via remote sensing. PBDMs have higher management value than ENMs as they predict the potential geographic distribution and abundance based on the mechanistic biology of species. However, the biology of an invasive species may be incom-plete or poorly understood, and/or may require consideration in a trophic context. In addition, programming of the dynamics of the biology may be challenging for non-specialists, but standardized software could be developed that would facilitate implementation (e.g. Rocchini and Neteler, 2012). On the other hand, using an incomplete PBDM model may give false pre-dictions of the geographic range and relative abundance of a species, and hence great care must be taken when developing and implement-ing such models.
3 Uncertainty of results
As stressed by Chile`s and Delfiner (1999), once a predictive map is drawn, people tend to accept
it at face value. However, thus far, species inva-sion estimates do not represent reality in a deter-ministic sense and are only estimates of potential presence. Therefore, the use of ‘maps of ignorance’ (Boggs, 1949) representing the bias or the uncertainty deriving from species distribution modelling, along with predictive maps, is strongly encouraged (Rocchini et al., 2011). Uncertainty can derive from a number of input data sources, such as the definition or identification of a certain species, as well as location-based errors.
Concerning the use of remote sensing data in direct species invasion detection, major sources of uncertainty derive mainly from: i) a mis-match between field and remote sensing grain (e.g. the pixel dimension is too big with respect to the pattern being studied; Carter et al., 2009, Table 1); ii) a mismatch between the phenologi-cal period and the spectral data being used, which may mean the species is not detected or its spread is underestimated (Evangelista et al., 2009, Table 1); iii) the classification of remote sensing data in vegetation or land use types, with pixels or resulting polygons representing species presence that are assumed to be internally homogeneous, which is rarely the case (e.g. Rocchini, 2010; Mairota et al., 2015). Additionally, uncertainty in modelling plant species distribution with a direct approach based on the unique spectral signature of the invading species as discussed in section II.1 can be tangible. This is due to the nature of the vari-ables derived from remote sensing used in the modelling. Typically, these variables are con-tinuous remote sensing products such as NDVI, spectral bands, LAI, and so on; thus, the resulting distribution map could reflect the actual distribution of target species instead of their potential distribution patterns. This is more evident when the target species are in high abundance and in a unique phenological stage where they can be distinguished easily from co-occurring species by remote sensors (Brad-ley et al., 2012). Therefore, to reduce the
uncertainty in the outcome of the modelling, other remotely sensed variables directly related to climate and topography should be used, such as MODIS LST data and microtopography from LiDAR. Further, when the resulting distribution maps are used for making management deci-sions, resource managers need to be more cau-tious about the possibility of underestimating the potential distribution of target species.
Finally, maps derived from the overlap of dif-ferent thematic layers may lead to uncertainty related to the modelling procedure being adopted (Arbia et al., 1998). Hence the spatial distribution of uncertainty should explicitly be shown on maps (e.g. Bastin et al., 2013) to avoid ignoring overall accuracy or model errors. Quoting Swanson et al. (2013), ‘including such estimates alongside mean projections gives a map of ignorance as called for by Rocchini et al. (2011), highlighting areas where knowl-edge is lacking and could be improved with additional sampling effort or the inclusion of additional covariates’.
VI Conclusions
This article discussed methods used in tracking species range shifts and contractions such as SDMs and related model inputs derived from remote sensing. Furthermore, phenological studies aimed at mapping and detecting inva-ders at a broad spatial scale using air-borne or space-borne sensors were reviewed in detail. Lastly, open challenges and pitfalls regarding remote sensing for biological invasion studies were highlighted. We demonstrated the useful-ness of remote sensing in directly mapping and modelling invasive plant species distribution patterns, and the indirect potential for remote sensing to detect such patterns in animal species and microorganisms such as pathogens.
Aside from potential global changes, species range shifts might be induced by direct anthro-pogenic causes, such as habitat destruction, or simply by assisted long distance dispersal
(Nathan, 2006). For instance, increasing human mobility has facilitated the intentional or unin-tentional introduction of species beyond their natural geographic ranges (Ricotta et al., 2010). Land cover change is an additional key factor in biological invasions. Remote sensing provides an array of earth observation products that are valuable for understanding patterns of species abundance and range expansion (Pfeifer et al., 2012).
The aim of this article was to stimulate dis-cussions on the potential of remote sensing in monitoring and estimating species invasions. With an increased imagery availability and advanced sensor technology, remote sensing provides a great opportunity for invasion biolo-gists and resource managers to develop predic-tive models for invasion risk analysis and to draft early detection strategies. By integrating remote sensing products with field sampling data, significant progress can be made in detect-ing, mapping and modelling invasive taxa in a wide range of habitats and ecosystems.
Climate change is expected to expand further the risk of species invasions through novel distur-bance regimes, elevated atmospheric CO2, altered
dispersal patterns and relaxed physiological con-straints of many plants and animals (Dukes and Mooney, 1999; Pearson and Dawson, 2003; Wiens et al., 2009). In this regard, the prediction of the potential geographic distribution and rela-tive abundance of invasive species in their recipi-ent communities (i.e. their invasiveness; see Gutierrez and Ponti, 2013; Gutierrez et al., 2011; Ponti et al., 2012) is crucial. Accurate mea-sures of abundance are particularly important for making more relevant predictions and improving resource management (Bradley, 2013).
When species experience novel combina-tions of biotic and abiotic factors, such as during biological invasions (with climate change as an additional layer of complexity), predicting spe-cies invasiveness on correlative grounds based on scarce and costly field observations has shown to have serious limitations, especially
from the management point of view. The best alternative would be to have direct observations of the invading species with wide geographic coverage, such as those provided by remote sen-sing imagery. However, most species except some plants cannot be sensed remotely, and hence remote sensing data might be used in conjunction with mechanistic rather than corre-lative modelling of invasive species (i.e. PBDMs vs ENMs) as a viable alternative that circumvents known limitations of correlative methods. In this way, invasive species assess-ment can be more relevant to manageassess-ment, and decision rules can be provided almost in real-time for wide geographic areas thanks to the increasingly rapid delivery of satellite imagery. Studies have shown that climate change may increase the vulnerability of endemic spe-cies (Casalegno et al., 2010; see also Loarie, 2011) and enable range expansion of species from warm climate regions into previously colder regions (van der Putten et al., 2010). A recent report indicates that rapid range shifts are associated with climate change and that the rates of shift are two or three times greater than previously thought: the distribu-tions of species have recently shifted to higher elevations at a median rate of 11 metres per decade, and to higher latitudes at a median rate of 16.9 kilometres per decade (Chen et al., 2011). This also implies that many inva-sive species will shift their geographic distri-butions, moving into areas where they were previously non-invasive or absent, thus mak-ing invasive species control and management even more complicated and costly. Moreover, both native and alien species can become invasive and alter an ecosystem’s taxonomic and structural composition. However, invasion by native plant species may ultimately lead to ecological succession and thus to vegetation types which retain certain conservation value according to current perceptions in particular areas. Invasion brought by alien species, instead, may imply more substantial and
long-lasting modifications to vegetation dynamics, hence to both local and landscape food webs and efficiency in providing ecosys-tem services (e.g. carbon storage, biodiver-sity). In addition, the individualistic nature of species’ response to climatic changes, which is likely to lead to communities that are com-positionally unlike those found currently (Mack et al., 2000; Pysek et al., 2014), is further com-plicated by local natural and anthropogenic dis-turbances (e.g. wildfires, grazing, management, land use change). A meaningful example is provided by Olofsson et al. (2014), in which single events such as fire can be localized and mapped by remote sensing. Such maps can be used as drivers to understand composition turn-over turn-over time related to the invasion of new niches by potentially invasive species. These events operate in synergy with global and regional shifts in climate and play a major role in shaping patterns of species distribution at regional and local scales (Franklin, 2010). Funding
Duccio Rocchini and Carol Ximena Garzon-Lopez were partially funded by the EU BON (Building the European Biodiversity Observation Network) project, funded by the European Union under the 7th Framework programme, Contract No. 308454. Duccio Rocchini was also partially funded by the ERA-Net BiodivERsA, with the national funders ANR, BelSPO and DFG, part of the 2012-2013 BiodivERsA call for research proposals. Annapola Rizzoli, Markus Neteler and Markus Metz were par-tially funded by the Autonomous Province of Trento (Italy), Research funds for Grandi Progetti, Project LExEM (Laboratory of excellence for epidemiology and modelling, http://www.lexem.eu). The PhD Scholarship of Sajid Pareeth and Matteo Marcanto-nio is supported by FIRS>T (FEM International Research School e Trentino).
Acknowledgements
We are grateful to the handling editor, K Anderson, and to two anonymous reviewers for precious insights on a previous version of the manuscript.
References
Akcakaya HR (2000) Population viability analyses with demographically and spatially structured models. Ecological Bulletins 48: 23–38.
Almeida T and De Souza F (2004) Principal component analysis applied to feature-oriented band ratios of hyperspectral data: a tool for vegetation studies. International Journal of Remote Sensing 25: 5005–5023.
Andreo V, Glass G, Shields T, et al. (2011) Modeling potential distribution of Oligoryzomys longicaudatus, the Andes virus (Genus: Hantavirus) reservoir, in Argentina. EcoHealth 8: 332–348.
Andrew ME and Ustin SL (2006) Spectral and physiolo-gical uniqueness of perennial pepperweed (Lepidium latifolium). Weed Science 54: 1051–1062.
Andrew ME and Ustin SL (2009) Habitat suitability modeling of an invasive plant with advanced remote sensing data. Diversity and Distributions 15: 627–640. Anyamba A, Chretien JP, Small J, et al. (2009) Prediction of a Rift Valley fever outbreak. Proceedings of the National Academy of Sciences USA 106: 955–959. Araujo MB and Luoto M (2007) The importance of biotic
interactions for modeling species distributions under climate change. Global Ecology and Biogeography 16: 743–753.
Araujo MB and Rozenfeld A (2014) The geographic scaling of biotic interactions. Ecography 37: 406–415. Arbia G, Griffith D and Haining R (1998) Error propaga-tion modelling in raster GIS: overlay operapropaga-tions. International Journal of Geographical Information Science 12: 145–167.
Asner GP, Jones MO, Martin RE, et al. (2008) Remote sensing of native and invasive species in Hawaiian forests. Remote Sensing and Environment 112: 1912–1926.
Asner GP, Martin RE, Carlson KM, et al. (2006) Vegetation– climate interactions among native and invasive species in Hawaiian rainforest. Ecosystems 9: 1106–1117. Asner GP, Martin RE, Knapp DE, et al. (2010) Effects
of Morella faya tree invasion on aboveground car-bon storage in Hawaii. Biological Invasions 12: 477–494.
Bajcsy P and Groves P (2004) Methodology for hyper-spectral band selection. Photogrammetric Engineering & Remote Sensing 70: 793–802.
Barve N, Barve V, Jimnez-Valverde A, et al. (2011) The crucial role of the accessible area in ecological niche
modeling and species distribution modeling. Ecologi-cal Modelling 222: 1810–1819.
Bastin L, Cornford D, Jones R, et al. (2013) Managing uncertainty in integrated environmental modelling: The UncertWeb framework. Environmental Model-ling & Software 39: 116–134.
Baylis M and Rawlings P (1998) Modelling the distri-bution and abundance of Culicoides imicola in Morocco and Iberia using climatic data and satellite imagery. Archives of Virology, Supplement, 14: 137–153.
Becker RH, Zmijewski KA and Crail T (2013) Seeing the forest for the invasives: mapping buckthorn in the Oak Openings. Biological Invasions 15: 315–326. Bentivegna DJ, Smeda RJ and Wang CZ (2012) Detecting
cutleaf teasel (Dipsacus laciniatus) along a Missouri highway with hyperspectral imagery invasive. Plant Science and Management 5: 155–163.
Boggs SW (1949) An atlas of ignorance: a needed stimulus to honest thinking and hard work. Proceedings of the American Philosophical Society 93: 253–258. Bradley BA (2013) Distribution models of invasive plants
overestimate potential impact. Biological Invasions 15: 1417–1429.
Bradley BA and Fleishman E (2008) Can remote sensing of land cover improve species distribution modelling? Journal of Biogeography 35: 1158–1159.
Bradley BA and Mustard JF (2006) Characterizing the landscape dynamics of an invasive plant and risk of invasion using remote sensing. Ecological Applications 16: 1132–1147.
Bradley BA, Olsson AD, Wang O, et al. (2012) Detection vs suitability: Dangers of biasing habitat suitability models for vegetation with remote sensing data. Eco-logical Modelling 244: 57–64.
Bunce RGH, Bogers MMB, Roche P, et al. (2011) Manual for habitat and vegetation surveillance and monitoring: temperate, Mediterranean and desert biomes, 1st edn. Alterra report 2154, Wageningen, the Netherlands.
Bunting P and Lucas R (2006) The delineation of tree crowns in Australian mixed species forests using hyperspectral Compact Airborne Spectrographic Ima-ger (CASI) data. Remote Sensing of Environment 30: 230–248.
Burkholder A, Warner TA, Culp M, et al. (2011) Seasonal trends in separability of leaf reflectance spectra for ailanthus altissima and four other tree species.
Photogrammetric Engineering and Remote Sensing 77: 793–804.
Call LJ and Nilsen ET (2003) Analysis of spatial patterns and spatial association between the invasive tree-of-heaven (Ailanthus altissima) and the native black locust (Robinia pseudoacacia). The American Midland Naturalist 150: 1–14.
Caminade C, Kovats RS, Rocklov J, et al. (2014) Impact of climate change on global malaria distribution. Pro-ceedings of the National Academy of Sciences USA 111: 3286–3291.
Camps-Valls G, Munoz-Mari J, Gomez-Chova L, et al. (2009) Biophysical parameter estimation with a semi-supervised support vector machine. IEEE Geoscience and Remote Sensing Letters 6: 248–252.
Carlson K, Asner G, Hughes R, et al. (2007) Hyperspectral remote sensing of canopy biodiversity in Hawaiian lowland rainforests. Ecosystems 10: 536–549. Carpi G, Cagnacci F, Neteler M, et al. (2008) Tick
infes-tation on roe deer in relation to geographic and remo-tely sensed climatic variables in a tick-borne encephalitis endemic area. Epidemiology and Infection 136: 1416–1424.
Carter GA, Lucas KL, Blossom GA, et al. (2009) Remote sensing and mapping of tamarisk along the Colorado river, USA: a comparative use of summer-acquired Hyperion, thematic mapper and Quickbird data. Remote Sensing 1: 318–329.
Casalegno S, Amatulli G, Bastrup-Birk A, et al. (2011) Modelling and mapping the suitability of European forest formations at 1-km resolution. European Journal of Forest Research 130: 971–981.
Casalegno S, Amatulli G, Camia A, et al. (2010) Vulner-ability of Pinus cembra L. in the Alps and the Car-pathian mountains under present and future climates. Forest Ecology and Management 259: 750–761. Charrel RN, de Lamballerie X and Raoult D (2007)
Chi-kungunya outbreaks-the globalization of vectorborne diseases. New England Journal of Medicine 356: 769–771.
Chase JM and Leibold MA (2003) Ecological Niches: Linking Classical and Contemporary Approaches. Chicago, IL: University of Chicago Press.
Chen I-C, Hill JK, Ohlemuler R, et al. (2011) Rapid range shifts of species associated with high levels of climate warming. Science 333: 1024–1026.
Cherlet MR, Di Gregorio A and Hielkema JU (1991) Remote-sensing applications for desert-locust
monitoring and forecasting. EPPO Bulletin 21: 633–642.
Chile`s D and Delfiner P (1999) Geostatistics Modeling Spatial Uncertainty. New York, NYH: Wiley. Chopping M (2011) CANAPI: Canopy analysis with
panchromatic imagery. Remote Sensing Letters 2: 21–29.
Clark JS, Carpenter SR, Barber M, et al. (2001) Ecological forecasts: an emerging imperative. Science 293: 657–660.
Clark ML, Roberts DA and Clark DB (2005) Hyperspec-tral discrimination of tropical rain forest tree species at leaf to crown scales. Remote Sensing of Environment 96: 375–398.
Coops NC, Waring RH, Wulder MA, et al. (2009) Pre-diction and assessment of bark beetle-induced mortal-ity of lodgepole pine using estimates of stand vigor derived from remotely sensed data. Remote Sensing of Environment 113: 1058–1066.
Cord A and Ro¨dder D (2011) Inclusion of habitat availability in species distribution models through multi-temporal remote-sensing data. Ecological Applications 21: 3285–3298.
Davis AJ, Jenkinson LS, Lawton JH, et al. (1998) Making mistakes when predicting shifts in species range in response to global warming. Nature 391: 783–786. Dawson TP, Jackson ST, House JI, et al. (2011) Beyond
predictions: biodiversity conservation in a changing climate. Science 332: 53–58.
Di Gregorio A and Jansen LJM (1998) Land Cover Clas-sification System (LCCS): clasClas-sification concepts and user manual. GCP/RAF/287/ITA Africover—East Africa Project in cooperation with AGLS and SDRN, Nairobi, Rome.
Di Gregorio A and Jansen LJM (2005) Land Cover Clas-sification System (LCCS): clasClas-sification concepts and user manual. Food and Agriculture Organization of the United Nations, Rome.
Dormann CF, Schymanski SJ, Cabral J, et al. (2012) Corre-lation and process in species distribution models: bridging a dichotomy. Journal of Biogeography 39: 2119–2131. Duda RO and Hart PE (1973) Pattern Classification and
Scene Analysis. New York, NY: Wiley.
Dukes JS and Mooney HA (1999) Does global change increase the success of biological invaders? Trends in Ecology & Evolution 14: 135–139.
Dullinger S, Essl F, Rabitsch W, et al. (2013) Europe’s other debt crisis: the long legacy of future extinctions.