R E S E A R C H A R T I C L E
Open Access
Short Physical Performance Battery and
all-cause mortality: systematic review and
meta-analysis
Rita Pavasini
1*, Jack Guralnik
2, Justin C. Brown
3, Mauro di Bari
4, Matteo Cesari
5,6, Francesco Landi
7, Bert Vaes
8,9,
Delphine Legrand
10, Joe Verghese
11, Cuiling Wang
12, Sari Stenholm
13, Luigi Ferrucci
14, Jennifer C. Lai
15,
Anna Arnau Bartes
16, Joan Espaulella
17, Montserrat Ferrer
18,19, Jae-Young Lim
20, Kristine E. Ensrud
21,22,
Peggy Cawthon
23, Anna Turusheva
10, Elena Frolova
24, Yves Rolland
5,6, Valerie Lauwers
25, Andrea Corsonello
26,
Gregory D. Kirk
27, Roberto Ferrari
1,28, Stefano Volpato
29and Gianluca Campo
1Abstract
Background: The Short Physical Performance Battery (SPPB) is a well-established tool to assess lower extremity physical performance status. Its predictive ability for all-cause mortality has been sparsely reported, but with conflicting results in different subsets of participants. The aim of this study was to perform a meta-analysis investigating the relationship between SPPB score and all-cause mortality.
Methods: Articles were searched in MEDLINE, the Cochrane Library, Google Scholar, and BioMed Central between July and September 2015 and updated in January 2016. Inclusion criteria were observational studies; >50
participants; stratification of population according to SPPB value; data on all-cause mortality; English language publications. Twenty-four articles were selected from available evidence. Data of interest (i.e., clinical characteristics, information after stratification of the sample into four SPPB groups [0–3, 4–6, 7–9, 10–12]) were retrieved from the articles and/or obtained by the study authors. The odds ratio (OR) and/or hazard ratio (HR) was obtained for all-cause mortality according to SPPB category (with SPPB scores 10–12 considered as reference) with adjustment for age, sex, and body mass index.
Results: Standardized data were obtained for 17 studies (n = 16,534, mean age 76 ± 3 years). As compared to SPPB scores 10–12, values of 0–3 (OR 3.25, 95%CI 2.86–3.79), 4–6 (OR 2.14, 95%CI 1.92–2.39), and 7–9 (OR 1.50, 95%CI 1. 32–1.71) were each associated with an increased risk of all-cause mortality. The association between poor
performance on SPPB and all-cause mortality remained highly consistent independent of follow-up length, subsets of participants, geographic area, and age of the population. Random effects meta-regression showed that OR for all-cause mortality with SPPB values 7–9 was higher in the younger population, diabetics, and men.
Conclusions: An SPPB score lower than 10 is predictive of all-cause mortality. The systematic implementation of the SPPB in clinical practice settings may provide useful prognostic information about the risk of all-cause mortality. Moreover, the SPPB could be used as a surrogate endpoint of all-cause mortality in trials needing to quantify benefit and health improvements of specific treatments or rehabilitation programs.
The study protocol was published on PROSPERO (CRD42015024916).
Keywords: Short Physical Performance Battery, All-cause mortality, Physical function, Meta-analysis
* Correspondence:[email protected]
1Cardiology Unit, Azienda Ospedaliero-Universitaria S.Anna, Via Aldo Moro, 8,
44124 Ferrara, Italy
Full list of author information is available at the end of the article
© The Author(s). 2016 Open Access This article is distributed under the terms of the Creative Commons Attribution 4.0 International License (http://creativecommons.org/licenses/by/4.0/), which permits unrestricted use, distribution, and reproduction in any medium, provided you give appropriate credit to the original author(s) and the source, provide a link to the Creative Commons license, and indicate if changes were made. The Creative Commons Public Domain Dedication waiver (http://creativecommons.org/publicdomain/zero/1.0/) applies to the data made available in this article, unless otherwise stated.
Background
Life expectancies at birth have risen globally, with the longest life expectancies (80–87 years) in Europe and North America [1]. With this has come the challenge of providing medical care to increasingly older adults. It is well established that the elderly are at increased risk of frailty, functional decline, and other adverse health out-comes, as well as death [1, 2]. This finding has import-ant clinical implications, because impaired functional status significantly influences prognosis and benefit from pharmacological and interventional therapies. As such, several authors and experts have suggested that the as-sessment of physical performance and functional status should be included in the initial clinical evaluation of older patients [3], with the aim of guiding clinicians in the decision-making process. The Short Physical Per-formance Battery (SPPB) has emerged as one of the most promising tools to evaluate functional capability and provide a measure of the biological age of an older individual [4]. It is an objective tool for measuring the lower extremity physical performance status [4]. The SPPB is based on three timed tasks: standing balance, walking speed, and chair stand tests. The timed results of each subtest are rescaled according to predefined cut-points for obtaining a score ranging from 0 (worst per-formance) to 12 (best perper-formance) [4]. The SPPB has been adopted in multiple observational studies that have consistently found an association with incident disability and hospital admission [3, 28]. Some studies suggest SPPB also has the capacity to predict all-cause mortality [6–29]. However, results were inconclusive, perhaps due to (1) limited sample size, (2) heterogeneous cut-points for categorizing the timed results, and (3) variability in the clinical settings of applications [6–29].
Therefore, the aim of this study was to assess the rela-tionship between SPPB and all-cause mortality by per-forming a thorough systematic review and meta-analysis. Methods
We developed a systematic review and meta-analysis fol-lowing the Preferred Reporting Items for Systematic Re-view and Meta-Analyses (PRISMA) amendment to the Quality of Reporting of Meta-analyses (QUOROM) statement and recommendations from the Cochrane Collaboration and from the Meta-analysis of Observa-tional Studies in Epidemiology (MOOSE) [30–33]. The protocol was previously published in an international prospective register of systematic reviews (PROSPERO) under number CRD42015024916.
Search strategy
Appropriate articles were found using the Medical Subject Headings (MeSH) strategy and searching in MEDLINE, the Cochrane Library, Google Scholar, and BioMed
Central. The search strategy was created by RP. The terms searched were: ((short physical performance battery) OR (SPPB) OR (lower limb strength) OR (standing balance) OR (walking speed) OR (chair stand)) AND ((mortality) OR (death)).
Only articles published in the English language and in peer-reviewed journals were selected. The research was carried out between July 2015 and January 2016. Inde-pendent reviewers (RP, GC) analyzed the titles and ab-stracts of the articles and determined which of them warranted the examination of the full text. Studies in-cluded in the analysis had to have the following character-istics: (1) observational (non-randomized) study; (2) inclusion of more than 50 subjects; (3) reporting the stratification of patients/population according to SPPB cut-points; (4) presenting data on all-cause mortality in re-lation to the value of SPPB expressed as hazard ratio (HR) or odds ratio (OR). Duplicate, interventional, or animal studies were excluded. Both reviewers agreed to the final number of studies included in the present analysis.
Data extraction, definition, endpoint, and contact with authors
Independent reviewers (GC, RP, and SV) completed the database, which contained information about the jour-nal, year of publication, authors, baseline characteristics of study population, follow-up length, SPPB cut-points, and source of mortality data. The primary endpoint was all-cause mortality. Additional analyses were performed after stratification of studies according to the following criteria: (1) mean age of the study population (≤75 years versus >75 years); (2) setting (general population versus outpatients versus hospitalized patients); (3) geograph-ical region (North America versus Europe versus Asia); (4) follow-up length (≤1 year versus >1 year and ≤5 years versus >5 years). To obtain standardized data, the au-thors of all the selected papers (n = 24) were contacted. Of the 22 authors contacted (two were corresponding authors for two studies), one was not able to provide the requested data, one refused to participate, and five never replied to the inquiry. A total of 15 authors (68%) gave complete available data for 17 of the studies originally selected (71%) (see Fig. 1). Authors were asked to complete a table summarizing baseline characteristics of their studies (mean age, sex, hypertension, cardiovascu-lar disease, cerebrovascucardiovascu-lar disease, diabetes) and to stratify the population into four SPPB score categories (0–3, 4–6, 7–9, 10–12) according to the cut-points pro-vided by Guralnik and colleagues in their original work [4]. The reference group for the analyses comprised par-ticipants ranging between 10 and 12 on the SPPB score. In addition, authors were asked to calculate the odds ra-tio (OR)/hazard rara-tio (HR) for all-cause mortality in SPPB groups with values 0–3, 4–6, and 7–9 compared
to the group 10–12 as reference, and to perform multi-variate analyses adjusted for age, sex, and body mass index (weight/height2).
Internal validity and quality appraisal
Two unblinded reviewers (RP and SV) independently evaluated the quality of the included studies using pre-specified electronic forms (piloted over the first three cases) and a modified version of the Newcastle-Ottawa Scale (NOS) for cohort studies [34] (Additional file 1: eTable 1). Because of the design of the studies consid-ered, we did not consider the section for“Comparability” and question 2 in the section “Selection” (“selection of the non exposed cohort”). Discrepancies between re-viewers were solved by consensus. No study was ex-cluded on the basis of this analysis. The same reviewers independently analyzed references of all the evaluated articles to avoid the eventual exclusion of additional studies.
Data analysis and synthesis
Continuous variables were reported as mean (± standard deviation) or median (interquartile range). Categorical variables were expressed as number and percentage (%). Point estimates and standard errors were extracted from individual studies and combined by the generic inverse variance method [35], computing risk estimates with
95% confidence intervals according to logarithmic trans-formation of the hazard measures. Considering the high likelihood of between-study variance, a random effect model was used. Statistical heterogeneity was assessed using Cochran’s Q test. This statistic was complemented with the I2 statistic, which quantifies the proportion of total variation across studies that is due to heterogeneity rather than chance. A value for I2of 0–25% represents insignificant heterogeneity, 26–50% low heterogeneity, 51–75% moderate heterogeneity, and >75% high hetero-geneity [36]. The chi-square test was used to test differ-ences between subgroups. To estimate the percentage of deaths that could be attributed to poor physical function, the percentage attributable risk (%AR) was calculated [37]. Finally, a random effect meta-regression analysis was performed to assess the effect of some potential confounding factors (age, sex, previous history of cardio-vascular disease, previous history of cerebrocardio-vascular dis-ease, diabetes, hypertension) on the results. Publication bias was appraised by graphical evaluation of funnel plots and through Begg and Mazumdar rank correlation, Egger’s regression intercept, and Duval and Tweedie trim and fill [36]. Statistical analyses were conducted using ProMeta software (Internovi, Cesena, Italy) and RevMan 5 (the Cochrane Collaboration, the Nordic Cochrane Centre, Copenhagen, Denmark).
Results
Search results and study selection
After removal of duplicates, 725 titles were identified by the databases search (Fig. 1). Overall, 529 items were ex-cluded after the first evaluation of the title and abstract, as they failed to meet the prespecified inclusion and ex-clusion criteria. Of the remaining 196 records examined, 134 were excluded because they focused on other out-comes or on other physical performance measures. An additional 5 were not retained because they were not original papers but reviews, and 31 because they were study protocols. Twenty-six studies were examined as full papers. Two of these were excluded because they were based on the same study sample used in Lai et al. [15]. The corresponding authors of the retained 24 re-cords were contacted [6–29]. As previously explained, standardized information was obtained for 17 of them [5–21], and these studies were included in the final qualitative and quantitative analysis (Fig. 1).
Population characteristics
A total of 16,534 participants (mean age: 76 ± 3 years, women: 78%) were included in the meta-analysis. Over-all, 47% of participants had hypertension, 9% diabetes, and 31% prior diagnosis of cardiovascular disease, while only 5% had a previous diagnosis of cerebrovascular dis-ease (Table 1). Eleven studies were focused on the
general population [7, 8, 12–14, 16–21]. Of note, the study of Greene et al. focused on current and former in-jection drug users [13]. Three studies enrolled hospital inpatients [10, 11, 22]. In the study by Volpato et al., the causes of hospitalization were congestive heart failure (HF), chronic obstructive pulmonary disease, pneumo-nia, or minor stroke [22]. In the study by Chiarantini et al., the cause of hospitalization was decompensated HF [10], whereas in the study by Corsonello et al., pa-tients were admitted to an acute care medical ward or a long-term care/rehabilitation unit [11]. The remaining three studies were based on outpatients presenting het-erogeneous clinical conditions (primary care center: can-cer, cirrhosis, on waiting list for liver transplant) (Table 1) [6, 9, 15]. Eleven studies were performed in Europe [6, 8–11, 16–20, 22], five in America [7, 12, 13, 15, 21], and one in Asia [14] (Table 1). The SPPB score was 0–3 in 9% of the study population, 4–6 in 16%, 7–9 in 33%, and 10–12 in 42%, respectively. Quality assess-ment of the 17 studies according to the NOS demon-strated an average high quality level with all studies having a score ranging between 5 and 6 (Additional file 1: eTable 1).
All-cause mortality
Overall, 3237 deaths (19.5%) were recorded. The length of follow-up ranged from a minimum of 1 year to a maximum of 11 years (median 4.5 years) (Additional file
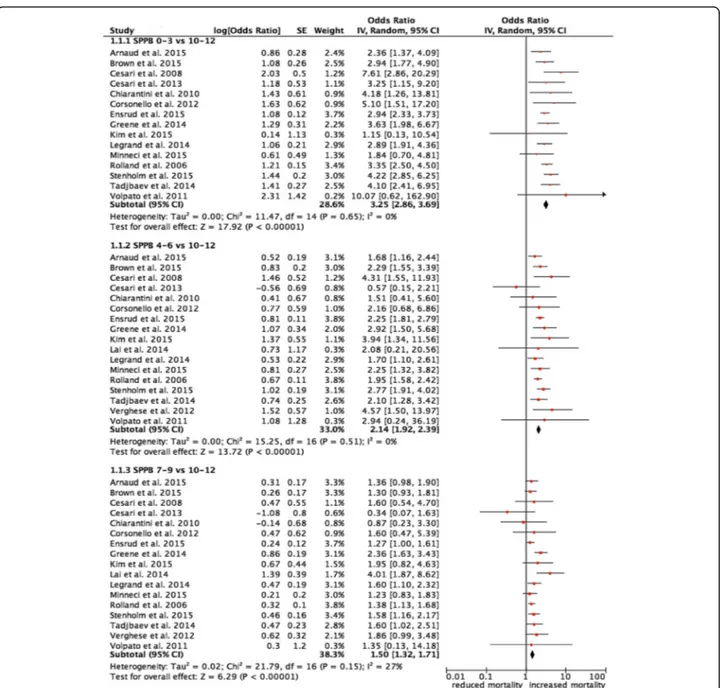
1: eTable 2). As compared to an SPPB score of 10–12, scores of 7–9, 4–6, and 0–3 were associated with greater and progressively increasing risks of all-cause mortality (Fig. 2). After adjustment for age, sex, and body mass index, we found an OR of 1.50 (95%CI 1.32–1.71) for SPPB scores 7–9, OR 2.14 (95%CI 1.92–2.39) for SPPB scores 4–6, and OR 3.25 (95%CI, 2.86–3.79) for SPPB scores 0–3 (Fig. 2). The %AR (95% CI) of death attrib-uted to poor functional performance was 33% (24–42%), 53% (48–58%), and 69% (65–73%), respectively. Hetero-geneity, expressed as I2%, was insignificant for the com-parison between SPPB scores 0–3 and 4–6 versus 10– 12, whereas it was low between SPPB scores 7–9 versus 10–12.
Additional analyses
Subgroup analyses demonstrated that after stratification of the studies for age, type of population, geographic area, and follow-up length, the association between SPPB and all-cause mortality remained highly consistent, with no statistical significance of the interaction terms (Table 2). Random effects meta-regression disclosed no significant association between confounding factors (pre-vious cardiovascular disease, cerebrovascular disease, diabetes, hypertension, age, and sex) for SPPB scores 0– 3 or 4–6 versus 10–12 and the risk of all-cause mortality (Additional file 1: eTable 3). In contrast, the OR for all-cause mortality with SPPB scores 7–9 was higher
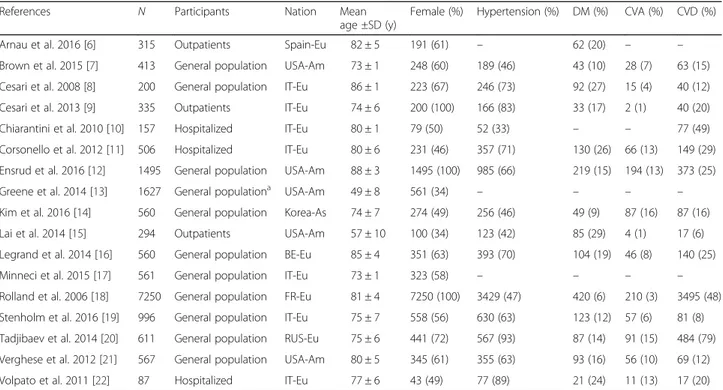
Table 1 Sample characteristics of the studies included in the meta-analysis
References N Participants Nation Mean
age ±SD (y)
Female (%) Hypertension (%) DM (%) CVA (%) CVD (%)
Arnau et al. 2016 [6] 315 Outpatients Spain-Eu 82 ± 5 191 (61) – 62 (20) – – Brown et al. 2015 [7] 413 General population USA-Am 73 ± 1 248 (60) 189 (46) 43 (10) 28 (7) 63 (15) Cesari et al. 2008 [8] 200 General population IT-Eu 86 ± 1 223 (67) 246 (73) 92 (27) 15 (4) 40 (12) Cesari et al. 2013 [9] 335 Outpatients IT-Eu 74 ± 6 200 (100) 166 (83) 33 (17) 2 (1) 40 (20) Chiarantini et al. 2010 [10] 157 Hospitalized IT-Eu 80 ± 1 79 (50) 52 (33) – – 77 (49) Corsonello et al. 2012 [11] 506 Hospitalized IT-Eu 80 ± 6 231 (46) 357 (71) 130 (26) 66 (13) 149 (29) Ensrud et al. 2016 [12] 1495 General population USA-Am 88 ± 3 1495 (100) 985 (66) 219 (15) 194 (13) 373 (25) Greene et al. 2014 [13] 1627 General populationa USA-Am 49 ± 8 561 (34) – – – –
Kim et al. 2016 [14] 560 General population Korea-As 74 ± 7 274 (49) 256 (46) 49 (9) 87 (16) 87 (16) Lai et al. 2014 [15] 294 Outpatients USA-Am 57 ± 10 100 (34) 123 (42) 85 (29) 4 (1) 17 (6) Legrand et al. 2014 [16] 560 General population BE-Eu 85 ± 4 351 (63) 393 (70) 104 (19) 46 (8) 140 (25) Minneci et al. 2015 [17] 561 General population IT-Eu 73 ± 1 323 (58) – – – – Rolland et al. 2006 [18] 7250 General population FR-Eu 81 ± 4 7250 (100) 3429 (47) 420 (6) 210 (3) 3495 (48) Stenholm et al. 2016 [19] 996 General population IT-Eu 75 ± 7 558 (56) 630 (63) 123 (12) 57 (6) 81 (8) Tadjibaev et al. 2014 [20] 611 General population RUS-Eu 75 ± 6 441 (72) 567 (93) 87 (14) 91 (15) 484 (79) Verghese et al. 2012 [21] 567 General population USA-Am 80 ± 5 345 (61) 355 (63) 93 (16) 56 (10) 69 (12) Volpato et al. 2011 [22] 87 Hospitalized IT-Eu 77 ± 6 43 (49) 77 (89) 21 (24) 11 (13) 17 (20)
SD standard deviation, DM diabetes mellitus, CVA cerebrovascular accident, CVD cardiovascular disease, y years, Am America, Eu Europe, As Asia, IT Italy, BE Belgium, FR France, RUS Russia
a
in younger populations, diabetics, and men (Additional file 1: eTable 3, eFigure 2).
Publication bias
According to graphical evaluation of funnel plots, Begg and Mazumdar rank correlation, and Egger’s regression intercept, there was no evidence of publication bias (Additional file 1: eTable 4 and eFigure 1A-C).
Discussion
Our meta-analysis suggests that poor performance on the SPPB is associated with an increased risk of all-cause
mortality in a dose-response manner. These findings were consistent among community-based subjects and both inpatients and outpatients, and across dif-ferent geographical areas, age groups, and durations of follow-up.
In the older population, self-reported functional limi-tation is a well-established independent risk factor for disability, morbidity, hospital admission for any cause, and mortality [3]. Objective measures of physical per-formance may be more likely to capture the integrated and multisystemic effects of aging, comorbidity, disease severity, malnutrition, motivation, and cognition on the
Fig. 2 Forest plot of the relation between SPPB and all-cause mortality. Data are displayed for each available study. Error bars represent 95% confidence intervals.SE standard error, CI confidence interval, SPPB Short Physical Performance Battery
health status of older persons. The SPPB is a simple test developed for assessing lower extremity function. It includes three different assessments (walking speed, chair stand, and balance time) [3, 4]. This test might be considered a non-specific but highly sensitive indi-cator of global health status and also an indiindi-cator of vulnerability [38], reflecting several underlying physio-logical impairments [39].
To the best of our knowledge, this is the first meta-analysis with an adequate sample size to definitively study the relationship between SPPB score and all-cause mortality. We found an independent association between poor performance on SPPB and all-cause mortality. As expected, the association between SPPB score and all-cause mortality was more pronounced at lowest scores (0–3 and 4–6 versus 10–12). Nevertheless, a 7–9 SPPB score predicted increased all-cause mortality compared
to a score of 10–12. It is noteworthy that
meta-regression analysis revealed that, in the group of subjects with SPPB scores 7–9, a higher risk of death was seen in males, diabetics, and younger persons.
Previous studies have suggested an association between measures of physical performance and all-cause mortality [40, 41]. In particular, two worthy meta-analyses showed that walking speed, chair stand, and balance time (each tested singularly) were able to discriminate those at height-ened risk of mortality in community-dwelling older adults [40, 41]. Our meta-analysis extends these findings into a broader range of ages, clinical settings, and geographical
areas. As compared to single tests, SPPB gives a more thor-ough evaluation of lower limb physical capability, and it could permit a better discrimination of subjects with poor physical function. At the same time, the application of the full SPPB compared to the single part of this test, such as gait speed, is more time-consuming. Future studies are needed to assess if the application in clinical practice of SPPB is superior to the application of gait speed alone in the prediction of mortality, considering also the costs for health care. In effect, one of the limits of the application of SPPB in daily clinical practice is related to the chronic limi-tation of the resources in the primary care setting. This problem is dual. Firstly, the systematic application of SPPB to elderly patients requires qualified, properly trained personnel. Secondly, the application of self-reported phys-ical function could be a possible alternative, but it is still not known if this assessment could be considered reliable in prediction of mortality.
Our work strongly supports the role of SPPB scores as a marker for risk stratification. This information might eventually support the development of adapted and per-sonalized care offered to older persons. Considering the strong association with all-cause mortality, information on SPPB might suggest the application of different dinostic and therapeutic strategies tailoring the more ag-gressive and intensive interventions to elderly patients with low physical performance. Randomized trials are warranted to test whether adoption of SPPB as a prog-nostic indicator by health systems reduces adverse
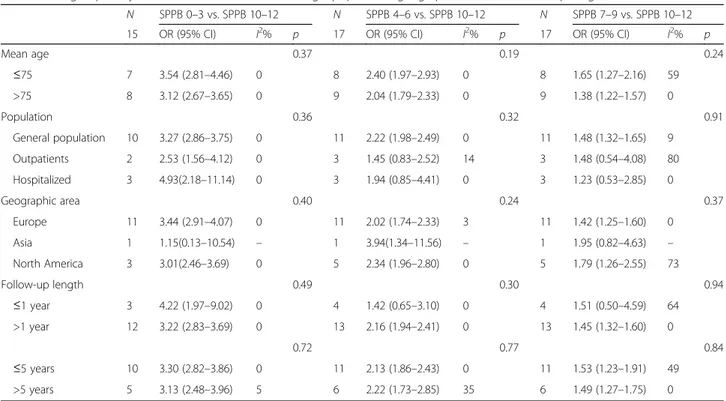
Table 2 Subgroup analyses after stratification for mean age, population, geographic area, and follow-up length
N SPPB 0–3 vs. SPPB 10–12 N SPPB 4–6 vs. SPPB 10–12 N SPPB 7–9 vs. SPPB 10–12 15 OR (95% CI) I2% p 17 OR (95% CI) I2% p 17 OR (95% CI) I2% p
Mean age 0.37 0.19 0.24 ≤75 7 3.54 (2.81–4.46) 0 8 2.40 (1.97–2.93) 0 8 1.65 (1.27–2.16) 59 >75 8 3.12 (2.67–3.65) 0 9 2.04 (1.79–2.33) 0 9 1.38 (1.22–1.57) 0 Population 0.36 0.32 0.91 General population 10 3.27 (2.86–3.75) 0 11 2.22 (1.98–2.49) 0 11 1.48 (1.32–1.65) 9 Outpatients 2 2.53 (1.56–4.12) 0 3 1.45 (0.83–2.52) 14 3 1.48 (0.54–4.08) 80 Hospitalized 3 4.93(2.18–11.14) 0 3 1.94 (0.85–4.41) 0 3 1.23 (0.53–2.85) 0 Geographic area 0.40 0.24 0.37 Europe 11 3.44 (2.91–4.07) 0 11 2.02 (1.74–2.33) 3 11 1.42 (1.25–1.60) 0 Asia 1 1.15(0.13–10.54) – 1 3.94(1.34–11.56) – 1 1.95 (0.82–4.63) – North America 3 3.01(2.46–3.69) 0 5 2.34 (1.96–2.80) 0 5 1.79 (1.26–2.55) 73 Follow-up length 0.49 0.30 0.94 ≤1 year 3 4.22 (1.97–9.02) 0 4 1.42 (0.65–3.10) 0 4 1.51 (0.50–4.59) 64 >1 year 12 3.22 (2.83–3.69) 0 13 2.16 (1.94–2.41) 0 13 1.45 (1.32–1.60) 0 0.72 0.77 0.84 ≤5 years 10 3.30 (2.82–3.86) 0 11 2.13 (1.86–2.43) 0 11 1.53 (1.23–1.91) 49 >5 years 5 3.13 (2.48–3.96) 5 6 2.22 (1.73–2.85) 35 6 1.49 (1.27–1.75) 0
health-related outcomes or reduces health care costs. For example, use of SPPB may improve choice of post-acute care setting, thereby reducing risk of short-term re-hospitalization and may better identify subsets of older patients unlikely to benefit from invasive surgical procedures. Alternatively, SPPB could be helpful as a surrogate endpoint of all-cause mortality in trials need-ing to quantify benefit and health improvements of spe-cific treatments or rehabilitation programs. For example, the Lifestyle Interventions and Independence for Elders (LIFE) pilot study demonstrated that a structured phys-ical activity program is able to increase the SPPB score [42]. Subsequently, the investigators showed in a larger randomized trial that a moderate-to-intense program of physical activity reduces disability [3].
Study limitations
Our results suffer from those limitations that are inher-ent to all meta-analytic techniques including particularly heterogeneity in populations and variable endpoint defi-nitions across studies. We could analyze data only from authors who replied to our request and, even if statistical analyses do not show the presence of publication bias, this could not be completely excluded. Secondly, we de-cided to report SPPB score in classes (0–3, 4–6, 7–9, 10–12) and not as a continuous variable. Finally, we only evaluated the association between SPPB and mortality. Additional studies are needed to show that adoption of SPPB into a prediction model improves discrimination of mortality and to evaluate its clinical utility in the practice setting. Nevertheless, this is a meta-analysis on a large sample, including more than 16,000 patients. Our protocol has been prespecified and registered on a public platform (PROSPERO), and the collaboration between authors allowed us to obtain highly standardized data. Conclusions
In the present collaborative meta-analysis, a SPPB value less than 10 predicts all-cause mortality. This finding is consistent across different clinical settings, geographical areas, ages, and follow-up lengths.
Additional file
Additional file 1: Short Physical Performance Battery and all-cause Mortality: Systematic Review and Meta-analysis. eTable 1. New-Castle Ottawa Scale for quality assessment. eTable 2. Source for follow-up of all the studies included in the meta-analysis. eTable 3. Meta-regression analyses considering population characteristics of each study included in the meta-analysis. eTable 4. Assessment of publication bias. eTable 5. PRISMA checklist. eFigure 1. Funnel plot and Trim and Fill analysis. A. Relation between SPPB 0-3 vs 10-12 and all-cause mortality. B. Relation between SPPB 4-6 vs 10-12 and all-cause mortality. C. Relation between SPPB 7-9 vs 10-12 and all-cause mortality. eFigure 2. Scatter Plot of meta-regression analysis for female sex, diabetes mellitus and age and relation between SPPB 7-9 vs 10-12 and all-cause death. (DOCX 146 kb)
Acknowledgements Not applicable.
Funding
B. Vaes and D. Legrand participated in the BELFRAIL study (B40320084685), which was supported by an unconditional grant from the Fondation Louvain. The Fondation Louvain is the support unit of the Université catholique de Louvain and is charged with developing the educational and research projects of the university by collecting gifts from corporations, foundations, and alumni.
J. Verghese participated in The Einstein Aging Study, which was supported by US National Institute on Aging grants (P01 AGO3949 and R01 AGO25119). Dr. Verghese received funding support from National Institute on Aging grants (R01 AG039330, R01 AGO44007, AGO44829, and R01 AG036921). C. Wang received funding support from National Institute on Aging grants (P01 AGO3949, R01 AG039330, R01 AGO44007, AGO44829, and R01 AG036921).
A. Arnau Bartes received a grant from the Fund for Health Research of Spain (PI042370) and the European Regional Development Fund (FEDER). K. Ensrud and P. Cawthon participated in the Study of Osteoporotic Fractures (SOF), which is supported by National Institutes of Health funding. The National Institute on Aging provides support under the following grant numbers: R01 AG005407, R01 AR35582, R01 AR35583, R01 AR35584, R01 AG005394, R01 AG027574, and R01 AG027576.
A. Turusheva and E. Frolova received a Grant of the President of the Russian Federation (grant 192-RP) and the Foundation Louvain.
G. Kirk participated in the AIDS Linked to the IntraVenous Experience (ALIVE) study, which was supported by the National Institutes of Health (grants U01-DA-036297, R01-DA-04334, R01-DA-12568, RC1-AI-086053, and K24-AI118591).
Authors’ contributions
RP, GC, and SV conceived and designed the research. GC, RP, and SV acquired the data. GC and RP performed the statistical analysis. JCB, MDB, MC, FL, BV, DL, JV, CW, SS, JG, LF, JCL, AAB, JE, MF, J-YL, KEE, PC, AT, EF, YR, VL, AC, and GK drafted the manuscript. GC, SV, and RF critically revised the manuscript for key intellectual content. All authors read and approved the final manuscript.
Competing interests
The authors declare that they have no competing interests.
Ethics approval and consent to participate
Every study included in the meta-analysis has been published after the approval of an ethics committee, and each patient enrolled signed a written consent. For this reason, the present meta-analysis did not required further ethics committee approval.
Author details
1Cardiology Unit, Azienda Ospedaliero-Universitaria S.Anna, Via Aldo Moro, 8,
44124 Ferrara, Italy.2University of Maryland School of Medicine, Baltimore,
MD, USA.3Division of Population Sciences, Department of Medical Oncology,
Dana-Farber Cancer Institute, Boston, MA, USA.4Department of Critical Care Medicine and Surgery, Unit of Gerontology and Geriatric Medicine, University of Florence and Azienda Ospedaliero-Universitaria Careggi, Florence, Italy.
5Gérontopôle, Centre Hospitalier Universitaire de Toulouse, Toulouse, France. 6
INSERM UMR1027, Université de Toulouse III Paul Sabatier, Toulouse, France.
7Department of Geriatrics, Neurosciences and Orthopaedics, Catholic
University of the Sacred Heart, Rome, Italy.8Institute of Health and Society,
Université catholique de Louvain (UCL), Brussels, Belgium.9Department of
Public Health and Primary Care, KU Leuven (KUL), Leuven, Belgium.10Institut de Recherche Sante et Societe, Universite Catholique de Louvain, Brussels, Belgium.11Department of Neurology & Medicine, Albert Einstein College of
Medicine, Bronx, New York, USA.12Department of Epidemiology, Albert
Einstein College of Medicine, Bronx, New York, USA.13Department of Public Health, University of Turku, Turku, Finland.14National Institute on Aging,
Longitudinal Studies Section, Clinical Research Branch, NIA-ASTRA Unit, Harbor Hospital, Baltimore, MD, USA.15Department of Medicine, Division of
Gastroenterology and Hepatology, University of California San Francisco, San Francisco, CA, USA.16Clinical Research Unit, Althaia Xarxa Assistencial
Universitària de Manresa, Manresa, Barcelona, Spain.17Servei de Geriatria i
18Health Services Research Group, IMIM, Hospital del Mar Medical Research
Institute, Barcelona, Spain.19CIBER Epidemiología y Salud Pública (CIBERESP),
Barcelona, Spain.20Department of Rehabilitation Medicine, Seoul National
University Bundang Hospital, Seoul National University College of Medicine, Seongnam, Gyeonggi, Republic of Korea.21Medicine and Epidemiology &
Community Health, University of Minnesota, Minneapolis, Minnesota, USA.
22General Internal Medicine, Minneapolis VA Health Care System,
Minneapolis, Minnesota, USA.23California Pacific Medical Center Research Institute, San Francisco CA, USA.24Department of Family Medicine, The
North-Western State Medical University named after I.I. Mechnikov, St. Petersburg, Russia.25Faculte’ de Me’ decine, Laboratoire d’Epidemiologie et
Sante’ Communautaire (Unite’ Inserm 558), Alle’es Jules Guesde, Toulouse, France.26Unit of Geriatric Pharmacoepidemiology, Research Hospital of
Cosenza, Italian National Research Centre on Aging (INRCA), Cosenza, Italy.
27Departments of Epidemiology and Medicine, Johns Hopkins University,
Baltimore MD, USA.28Maria Cecilia Hospital, GVM Care & Research, E.S.: Health Science Foundation, Cotignola, Italy.29Department of Medical
Science, Section of Internal and Cardiorespiratory Medicine, University of Ferrara, Ferrara, Italy.
Received: 15 August 2016 Accepted: 1 December 2016
References
1. http://gamapserver.who.int/gho/interactive_charts/mbd/life_expectancy/ atlas.html. Accessed 31 July 2016.
2. Fried LP, Tangen CM, Walston J, Newman AB, Hirsch C, Gottdiener J, et al. Frailty in older adults: evidence for a phenotype. J Gerontol A Biol Sci Med Sci. 2001;56(3):M146–57.
3. Pahor M, Guralnik JM, Ambrosius WT, Blair S, Bonds DE, Church TS, et al. Effect of structured physical activity on prevention of major mobility disability in older adults: the LIFE study randomized clinical trial. JAMA. 2014;311(23):2387–96.
4. Guralnik JM, Simonsick EM, Ferrucci L, Glynn RJ, Berkman LF, Blazer DG, et al. A short physical performance battery assessing lower extremity function: association with self-reported disability and prediction of mortality and nursing home admission. J Gerontol. 1994;49(2):M85–94.
5. Guralnik JM, Ferrucci L, Simonsick EM, Salive ME, Wallace RB. Lower-extremity function in persons over the age of 70 years as a predictor of subsequent disability. N Engl J Med. 1995;332(9):556–61.
6. Arnau A, Espaulella J, Méndez T, Serrarols M, Canudas J, Formiga F, et al. Lower limb function and 10-year survival in population aged 75 years and older. Fam Pract. 2016;33(1):10–6.
7. Brown JC, Harhay MO, Harhay MN. Physical function as a prognostic biomarker among cancer survivors. Br J Cancer. 2015;112(1):194–8. 8. Cesari M, Onder G, Zamboni V, Manini T, Shorr RI, Russo A, et al. Physical
function and self-rated health status as predictors of mortality: results from longitudinal analysis in the ilSIRENTE study. BMC Geriatr. 2008;8:34. 9. Cesari M, Cerullo F, Zamboni V, Di Palma R, Scambia G, Balducci L, et al.
Functional status and mortality in older women with gynecological cancer. J Gerontol A Biol Sci Med Sci. 2013;68(9):1129–33.
10. Chiarantini D, Volpato S, Sioulis F, Bartalucci F, Del Bianco L, Mangani I, et al. Lower extremity performance measures predict long-term prognosis in older patients hospitalized for heart failure. J Card Fail. 2010;16(5):390–5. 11. Corsonello A, Lattanzio F, Pedone C, Garasto S, Laino I, Bustacchini S, et al.
Prognostic significance of the short physical performance battery in older patients discharged from acute care hospitals. Rejuvenation Res. 2012;15(1):41–8. 12. Ensrud KE, Lui LY, Paudel ML, Schousboe JT, Kats AM, Cauley JA, et al.
Effects of mobility and cognition on risk of mortality in women in late life: a prospective study. J Gerontol A Biol Sci Med Sci. 2016;71(6):759–65. 13. Greene M, Covinsky K, Astemborski J, Piggott DA, Brown T, Leng S, et al.
The relationship of physical performance with HIV disease and mortality. AIDS. 2014;28(18):2711–9.
14. Kim YH, Kim KI, Paik NJ, Kim KW, Jang HC, Lim JY. Muscle strength: a better index of low physical performance than muscle mass in older adults. Geriatr Gerontol Int. 2016;16(5):577–85.
15. Lai JC, Feng S, Terrault NA, Lizaola B, Hayssen H, Covinsky K. Frailty predicts waitlist mortality in liver transplant candidates. Am J Transplant. 2014;14(8): 1870–9.
16. Legrand D, Vaes B, Matheï C, Adriaensen W, Van Pottelbergh G, Degryse JM. Muscle strength and physical performance as predictors of mortality,
hospitalization, and disability in the oldest old. J Am Geriatr Soc. 2014;62(6):1030–8.
17. Minneci C, Mello AM, Mossello E, Baldasseroni S, Macchi L, Cipolletti S, et al. Comparative study of four physical performance measures as predictors of death, incident disability, and falls in unselected older persons: the insufficienza Cardiaca negli Anziani Residenti a Dicomano Study. J Am Geriatr Soc. 2015;63(1):136–41.
18. Rolland Y, Lauwers-Cances V, Cesari M, Vellas B, Pahor M, Grandjean H. Physical performance measures as predictors of mortality in a cohort of community-dwelling older French women. Eur J Epidemiol. 2006;21(2):113–22. 19. Stenholm S, Koster A, Valkeinen H, Patel KV, Bandinelli S, Guralnik JM, et al.
Association of physical activity history with physical function and mortality in old age. J Gerontol A Biol Sci Med Sci. 2016;71(4):496–501.
20. Tadjibaev P, Frolova E, Gurina N, Degryse J, Vaes B. The relationship between physical performance and cardiac function in an elderly Russian cohort. Arch Gerontol Geriatr. 2014;59(3):554–61.
21. Verghese J, Holtzer R, Lipton RB, Wang C. Mobility stress test approach to predicting frailty, disability, and mortality in high-functioning older adults. J Am Geriatr Soc. 2012;60(10):1901–5.
22. Volpato S, Cavalieri M, Sioulis F, Guerra G, Maraldi C, Zuliani G, et al. Predictive value of the Short Physical Performance Battery following hospitalization in older patients. J Gerontol A Biol Sci Med Sci. 2011;66(1):89–96.
23. Comba M, Fonte G, Isaia G, Pricop L, Sciarrillo I, Michelis G, et al. Cardiac and inflammatory biomarkers and in-hospital mortality in older medical patients. J Am Med Dir Assoc. 2014;15(1):68–72.
24. Fox KR, Ku PW, Hillsdon M, Davis MG, Simmonds BA, Thompson JL, et al. Objectively assessed physical activity and lower limb function and prospective associations with mortality and newly diagnosed disease in UK older adults: an OPAL four-year follow-up study. Age Ageing. 2015; 44(2):261–8.
25. Khan H, Kalogeropoulos AP, Georgiopoulou VV, Newman AB, Harris TB, Rodondi N, et al. Frailty and risk for heart failure in older adults: the health, aging, and body composition study. Am Heart J. 2013;166(5):887–94. 26. Klepin HD, Geiger AM, Tooze JA, Kritchevsky SB, Williamson JD, Pardee TS,
et al. Geriatric assessment predicts survival for older adults receiving induction chemotherapy for acute myelogenous leukemia. Blood. 2013; 121(21):4287–94.
27. Miller DK, Wolinsky FD, Andresen EM, Malmstrom TK, Miller JP. Adverse outcomes and correlates of change in the Short Physical Performance Battery over 36 months in the African American health project. J Gerontol A Biol Sci Med Sci. 2008;63(5):487–94.
28. Panas LJ, Siordia C, Angel RJ, Eschbach K, Markides KS. Physical performance and short-term mortality in very old Mexican Americans. Exp Aging Res. 2013;39(5):481–92.
29. Singer JP, Diamond JM, Gries CJ, McDonnough J, Blanc PD, Shah R, et al. Frailty phenotypes, disability, and outcomes in adult candidates for lung transplantation. Am J Respir Crit Care Med. 2015;192(11):1325–34. 30. Moher D, Cook DJ, Eastwood S, Olkin I, Rennie D, Stroup DF, et al.
Improving the quality of reports of meta-analyses of randomized controlled trials: the QUOROM statement. Lancet. 1999;354:1896–900.
31. Stroup DF, Berlin JA, Morton SC, Olkin I, Williamson GD, Rennie D, et al. Meta-analysis of observational studies in epidemiology: a proposal for reporting. Meta-Analysis of Observational Studies in Epidemiology (MOOSE) group. JAMA. 2000;283:2008–12.
32. Higgins JPT, Green S. Cochrane handbook for systematic reviews of interventions, version 5.1.0, The Cochrane Collaboration. 2009. http:// handbook.cochrane.org. Accessed 13 Mar 2016.
33. Liberati A, Altman DG, Tetzlaff J, Mulrow C, Gøtzsche PC, Ioannidis JP, et al. The PRISMA statement for reporting systematic reviews and meta-analyses of studies that evaluate healthcare interventions: explanation and elaboration. BMJ. 2009;339:b2700.
34. Wells GA, Shea B, O’Connell D, Peterson J, Welch V, Losos M, et al. The Newcastle-Ottawa Scale (NOS) for assessing the quality of nonrandomised studies in meta-analyses. http://www.ohri.ca/programs/clinical_ epidemiology/oxford.asp. Accessed 15 Apr 2016.
35. DerSimonian R, Laird N. Meta-analysis in clinical trials. Control Clin Trial. 1986;7:177–88.
36. Higgins JP, Thompson SG, Deeks JJ, Altman DG. Measuring inconsistency in meta-analyses. BMJ. 2003;327:557–60.
37. Cooper H, Hedges VL, Valentine JC, editors. Handbook of research synthesis and meta-analysis. 2nd ed. New York: Russell Sage Foundation; 2009.
38. Penninx BW, Ferrucci L, Leveille SG, Rantanen T, Pahor M, Guralnik JM. Lower extremity performance in nondisabled older persons as a predictor of subsequent hospitalization. J Gerontol A Biol Sci Med Sci. 2000;55(11):M691–7. 39. Savino E, Volpato S, Zuliani G, Guralnik JM. Assessment of mobility status and risk
of mobility disability in older persons. Curr Pharm Des. 2014;20(19):3099–113. 40. Studenski S, Perera S, Patel K, Rosano C, Faulkner K, Inzitari M, et al. Gait
speed and survival in older adults. JAMA. 2011;305(1):50–8.
41. Cooper R, Kuh D, Hardy R. Objectively measured physical capability levels and mortality: systematic review and meta-analysis. BMJ. 2010;341:c4467. 42. Pahor M, Blair SN, Espeland M, Fielding R, Gill TM, Guralnik JM, et al. Effects
of a physical activity intervention on measures of physical performance: Results of the Lifestyle Interventions and Independence for Elders Pilot (LIFE-P) study. J Gerontol A Biol Sci Med Sci. 2006;61(11):1157–65.
• We accept pre-submission inquiries
• Our selector tool helps you to find the most relevant journal
• We provide round the clock customer support
• Convenient online submission
• Thorough peer review
• Inclusion in PubMed and all major indexing services
• Maximum visibility for your research Submit your manuscript at
www.biomedcentral.com/submit