DOTTORATO di RICERCA in INGEGNERIA dell’INFORMAZIONE
DRINF
DRINF
A network-based approach to
uniformly extract knowledge and
support decision making in
heterogeneous application context
Supervisor: Prof. Domenico URSINO
Coordinator: Prof. Tommaso ISERNIA S.S.D. ING-INF/05
XXXII Ciclo
SCIENTIFIC BOARD MEMBERS: Tommaso ISERNIA (coordinator) Giovanni ANGIULLI Pier Luigi ANTONUCCI Giuseppe ARANITI Antoine BERTHET Francesco BUCCAFURRI Claudia CAMPOLO Rosario CARBONE Riccardo CAROTENUTO Luigi CELONA Salvatore COCO Mariantonia COTRONEI Lorenzo CROCCO Dominique DALLET Claudio DE CAPUA Francesco DELLA CORTE Giuliana FAGGIO Pasquale FILIANOTI Patrizia FRONTERA Sofia GIUFFRE' Voicu GROZA Antonio IERA Gianluca LAX Aime' LAY EKUAKILLE Giacomo MESSINA Antonella MOLINARO Andrea MORABITO Rosario MORELLO Fortunato PEZZIMENTI Sandro RAO Ivo RENDINA Domenico ROSACI Giuseppe RUGGERI Francesco RUSSO Valerio SCORDAMAGLIA Domenico URSINO
Paolo LO GIUDICE
Pa
o
lo
L
O
G
IU
DI
CE
A
netw
ork
-b
as
ed
a
pp
ro
ac
h
to
u
ni
fo
rml
y
ex
tra
ct
kn
ow
led
ge
an
d
su
pp
ort
dec
is
io
n
ma
ki
ng
in
h
eter
og
en
eo
us
a
pp
lic
ati
on
c
on
te
xt
SCUOLA di DOTTORATO
Università degli Studi Mediterranea di Reggio Calabria
DOTTORATO di RICERCA in INGEGNERIA dell’INFORMAZIONE
CO L L A N A D E L L A S CU O L A D I D O T T O R A T O D E L L ’U NI V E R S IT A ’ D E G L I S T U D I ME D IT ER R A N EA DI R E G G IO C A L A B R IA DO C TO R A L SC H O O L O F M ED IT ER R A N EA U N IV ER SI TY O F R EG G IO C A LA B R IA
In the big data era, the number, the volume and the variety
of available data sources are dramatically increasing.
As a consequence, one of the main open issues to address in
computer science research consists of uniformly extracting
knowledge and facing decision problems in heterogeneous
application contexts. However, as generally
happens, a solved problem becomes an opportunity.
In fact, if we were able to define a model suitable to uniformly
represent and handle highly heterogeneous data formats,
we could use it to manage data coming from several
research contexts. In other words, an approach designed
to solve an open problem in one context can be easily
transposed to address other open issues in other contexts.
This thesis aims at providing a contribution in this setting.
Indeed, it proposes a social network-based approach to
uniformly extract knowledge and support decision
making concerning disparate research contexts.
In particular we will focus on four contexts:
Biomedical Engineering, Data Lakes,
Internet of Things and Innovation Management
Paolo Lo Giudice
was born in Reggio Calabria,
Italy, in 1991.
He received the MSc degree
in ICT Engineering from
the University Mediterranea of
Reggio Calabria in October 2016.
His research interests include
Social Network Analysis, Social
Internetworking, Source and
Data Integration, Internet of
Things, Innovation Management,
Knowledge Extraction and
Representation, Biomedical
applications and Data Lake.
He is also co-authored of some
pubblications in peer-reviewed
national and international journals
and several conference
contributions.
Collana Quaderni del Dottorato di Ricerca in Ingegneria dell’Informazione
Quaderno n°45
9 788899 352400
DOCTORAL SCHOOL
UNIVERSITA’ MEDITERRANEA DI REGGIO CALABRIA DIPARTIMENTO DI INGEGNERIA DELL’INFORMAZIONE, DELLE INFRASTRUTTURE E DELL’ENERGIA SOSTENIBILE (DIIES) PHD IN INFORMATION ENGINEERING S.S.D. ING-INF/05 XXXII CICLO
A network-based approach to uniformly extract knowledge and
support decision making in heterogeneous application contexts
CANDIDATE
Paolo LO GIUDICE
ADVISOR
Prof. Domenico URSINO
COORDINATOR
Prof. Tommaso
I
SERNIA
Finito di stampare nel mese di Gennaio 2020
Edizione
Quaderno N. 45
Collana Quaderni del Dottorato di Ricerca in Ingegneria dell’Informazione Curatore Prof. Tommaso Isernia
ISBN 978-88-99352-40-0
Università degli Studi Mediterranea di Reggio Calabria Salita Melissari, Feo di Vito, Reggio Calabria
PAOLO LO GIUDICE
A network-based approach to uniformly extract knowledge and
support decision making in heterogeneous application contexts
The Teaching Staff of the PhD course in
INFORMATION ENGINEERING
consists of:
Tommaso ISERNIA (coordinator) Giovanni ANGIULLI Pier Luigi ANTONUCCI Giuseppe ARANITI Antoine BERTHET Francesco BUCCAFURRI Claudia CAMPOLO Rosario CARBONE Riccardo CAROTENUTO Luigi CELONA Salvatore COCO Mariantonia COTRONEI Lorenzo CROCCO Dominique DALLET Claudio DE CAPUA Francesco DELLA CORTE Giuliana FAGGIO Pasquale FILIANOTI Patrizia FRONTERA Sofia GIUFFRE' Voicu GROZA Antonio IERA Gianluca LAX Aime' LAY EKUAKILLE Giacomo MESSINA Antonella MOLINARO Andrea MORABITO Rosario MORELLO Fortunato PEZZIMENTI Sandro RAO Ivo RENDINA Domenico ROSACI Giuseppe RUGGERI Mariateresa RUSSO Valerio SCORDAMAGLIA Domenico URSINO
Significa qualcosa che appartiene al passato, ad un futuro immaginato che per`o non c’`e
Contents
1 Introduction . . . 1 1.1 Motivations . . . 1 1.1.1 Neurological Disorders . . . 3 1.1.2 Data Lakes . . . 4 1.1.3 Internet of Things . . . 5 1.1.4 Innovation Management . . . 61.2 Complex Networks as a unifying model for heterogeneous contexts . . . 8
1.3 Social Network Analysis as a unifying approach to knowledge extraction 9 1.3.1 Clique . . . 10
1.3.2 Centralities . . . 10
1.3.3 Homophily, Ego Networks and Neighborhoods . . . 11
1.4 A sketch of possible applications . . . 12
1.4.1 Neurological Disorders . . . 12
1.4.2 Data Lakes . . . 12
1.4.3 Internet of Things . . . 13
1.4.4 Innovation Management . . . 14
1.5 Outline of this thesis . . . 15
Part I Neurological Disorders 2 Creutzfeldt Jakob Disease . . . 21
2.1 Introduction . . . 21
2.2 Related Literature . . . 23
2.3 Basic Support Data Structures . . . 26
2.4 PSWC Characterization . . . 30
2.4.1 Connection Coefficient . . . 30
3 Mild Cognitive Impairment - Alzheimer’s disease (AD) . . . 43
3.1 Introduction . . . 43
3.1.1 Motivations and Related Literature . . . 43
3.1.2 Objectives and general description of the proposed approach . . 45
3.2 Methods . . . 47
3.2.1 Input and Support Data Structures . . . 47
3.2.2 Connection Coefficient . . . 52 3.2.3 Sub-band Analysis . . . 54 3.2.4 Conversion Coefficient . . . 54 3.2.5 Network Motifs . . . 55 3.3 Results . . . 57 3.3.1 Testbed . . . 57
3.3.2 Training of the proposed approach . . . 61
3.3.3 Testing of the proposed approach . . . 62
3.3.4 Comparison between Connection and Clustering coefficients . . 64
3.3.5 Network Motifs . . . 65
3.3.6 Comparison with other existing approaches . . . 68
3.3.7 Discussion . . . 70
4 Childhood Absence Epilepsy . . . 73
4.1 Introduction . . . 73
4.2 Available data . . . 76
4.2.1 EEG recording and preprocessing . . . 76
4.2.2 Coherence estimation . . . 76
4.3 Support data structures . . . 77
4.4 Detection and characterization of ictal states . . . 79
4.4.1 Connection coefficient . . . 79
4.4.2 Detecting ictal states . . . 79
4.4.3 Characterizing ictal states . . . 82
Part II Data Lakes 5 Uniform Management of Heterogeneous Data Lake Sources . . . 89
5.1 Introduction . . . 89
5.2 Related Literature . . . 90
5.3 A unifying model for representing the metadata of data lake sources . 91 5.3.1 Typologies of metadata . . . 91
5.3.2 A network-based model for business and technical metadata . . 93
Contents
5.4.1 Defining a structure for unstructured sources . . . 94
5.4.2 An approach to extracting thematic views . . . 95
5.5 An example case . . . 96
6 Extraction of Interschema Properties . . . 101
6.1 Introduction . . . 101
6.2 Related Literature . . . 104
6.2.1 Schema matching for structured and semi-structured sources . . 104
6.2.2 Approaches to represent unstructured sources . . . 105
6.3 A network-based model for uniformly representing structured, semi-structured and unstructured sources . . . 108
6.4 Structuring an unstructured source . . . 109
6.4.1 Example . . . 113
6.5 Extracting interschema properties from disparate sources . . . 115
6.5.1 Semantic similarity degree computation . . . 117
6.5.2 Semantic relationship detection . . . 121
6.6 Experiments . . . 126
6.6.1 Overall performances of our approach . . . 127
6.6.2 Evaluation of the pros and the cons of our approach . . . 128
6.6.3 A deeper investigation on the scalability of our approach . . . 131
6.6.4 Evaluation of the role of our approach for structuring unstructured sources . . . 133
7 Extraction of Knowledge Patterns . . . 135
7.1 Introduction . . . 135
7.2 Related Literature . . . 137
7.3 A network-based model for data lakes . . . 140
7.4 Enriching the representation of unstructured data . . . 142
7.4.1 Example . . . 144
7.5 Extraction of complex knowledge patterns . . . 146
7.5.1 General description of the approach . . . 146
7.5.2 Technical Details . . . 148
7.6 Some case studies . . . 150
7.7 Discussion . . . 155
7.7.1 Comparison between our approach and the related ones . . . 156
7.7.2 Evaluation of our approach to structure unstructured data . . . . 158
7.7.3 Performance of our overall approach . . . 159
Part III Internet of Things
8 Extracting knowledge from heterogeneous sensor data streams . . 169
8.1 Introduction . . . 169
8.2 Methods . . . 170
8.2.1 Network construction . . . 170
8.2.2 Network parameters . . . 171
8.2.3 Approach to knowledge extraction . . . 172
8.3 Results . . . 173
8.3.1 Testbed . . . 173
8.3.2 Obtained results and Discussion . . . 174
9 Multiple IoTs . . . 179
9.1 Introduction . . . 179
9.2 Related Literature . . . 182
9.3 The MIoT paradigm . . . 184
9.3.1 An example of a MIoT . . . 189
9.3.2 Why use the MIoT paradigm? . . . 191
9.4 CDS: a crawler tailored for MIoTs . . . 195
9.4.1 Motivations underlying CDS . . . 195
9.4.2 Description of CDS . . . 196
9.4.3 Experimental campaign . . . 200
9.5 Analytical Discusssion . . . 207
10 Building Virtual IoTs in a Multiple IoTs scenario . . . 209
10.1 Introduction . . . 209
10.2 Related Literature . . . 211
10.3 The MIoT paradigm . . . 214
10.4 Definition of a thing’s profile . . . 216
10.5 Topic-guided virtual IoTs in a MIoT and approaches to constructing them . . . 219 10.5.1 Supervised approach . . . 220 10.5.2 Unsupervised approach . . . 222 10.5.3 Discussion . . . 223 10.6 Experiments . . . 224 10.6.1 Adopted Dataset . . . 224
10.6.2 Cohesion of the obtained topic-guided virtual IoTs . . . 225
10.6.3 Average fraction of merged c-nodes and analysis of node distribution in virtual IoTs . . . 228
Contents
10.6.4 Computation time . . . 231
10.6.5 Our approaches’ capability of improving the efficiency of information dissemination . . . 232
10.6.6 Number and size of returned virtual IoTs . . . 235
Part IV Innovation Management 11 Evaluating patents and their citations . . . 241
11.1 Introduction . . . 241 11.2 Related Work . . . 243 11.3 Preliminaries . . . 246 11.3.1 Patent Database . . . 246 11.3.2 Support model . . . 247 11.4 Centrality measures . . . 248 11.4.1 Theoretical definition . . . 248 11.4.2 Experimental evaluation . . . 249
11.5 Some possible applications . . . 254
11.5.1 Computation of the scope of a patent . . . 254
11.5.2 Computation of the lifecycle of a patent . . . 256
11.5.3 Definition of power patents and investigation of their importance258 12 Extraction of Knowledge Patterns . . . 265
12.1 Introduction . . . 265
12.2 Related Literature . . . 268
12.3 Available data and preprocessing . . . 271
12.3.1 Choice of similarity metrics . . . 271
12.3.2 Description of the algorithm for determining string similarity . 272 12.3.3 Application of our ETL algorithm on available data . . . 273
12.4 Description of our approach . . . 273
12.4.1 Hub characterization and detection . . . 274
12.4.2 Investigation of the research scenarios for the countries of interest . . . 276
12.4.3 Investigation of research areas . . . 279
12.4.4 Investigation of the quality of publications . . . 279
12.4.5 Characterization of hub neighborhoods . . . 280
12.5 Application of our approach to four North African countries . . . 282
12.5.1 Hub characterization and detection . . . 282
12.5.2 Investigation of the research scenarios for the countries of interest . . . 285
12.5.3 Investigation of research areas . . . 291
12.5.4 Investigation of the quality of publications . . . 293
12.5.5 Characterization of hub neighborhoods . . . 294
12.6 Discussion . . . 297
13 Deriving knowledge on research scenarios in a set of countries . . . 301
13.1 Deriving Knowledge . . . 301
13.2 Approach description and knowledge pattern extraction . . . 302
13.2.1 RQ1: What is the distribution of patents against inventors . . . . 303
13.2.2 RQ2: How the number of inventors and their cooperation degree evolve over time? . . . 304
13.2.3 RQ3: Do cliques of inventors exist in some countries? . . . 306
13.2.4 RQ4: With whom and how inventors cooperate? . . . 308
13.2.5 RQ5: What about the “neighbors” of inventors? . . . 312
13.2.6 RQ6: Do power inventors exist? . . . 313
13.2.7 RQ7: Does a backbone of power inventors exist? . . . 315
13.2.8 RQ8: What are the main characteristics of the neighbors of power inventors? . . . 318
13.2.9 RQ9: How are patents distributed against IPC classes? . . . 321
13.2.10RQ10: How are foreign collaborations distributed against IPC classes? . . . 324
Part V Closing Remarks 14 Conclusions . . . 329
List of Figures
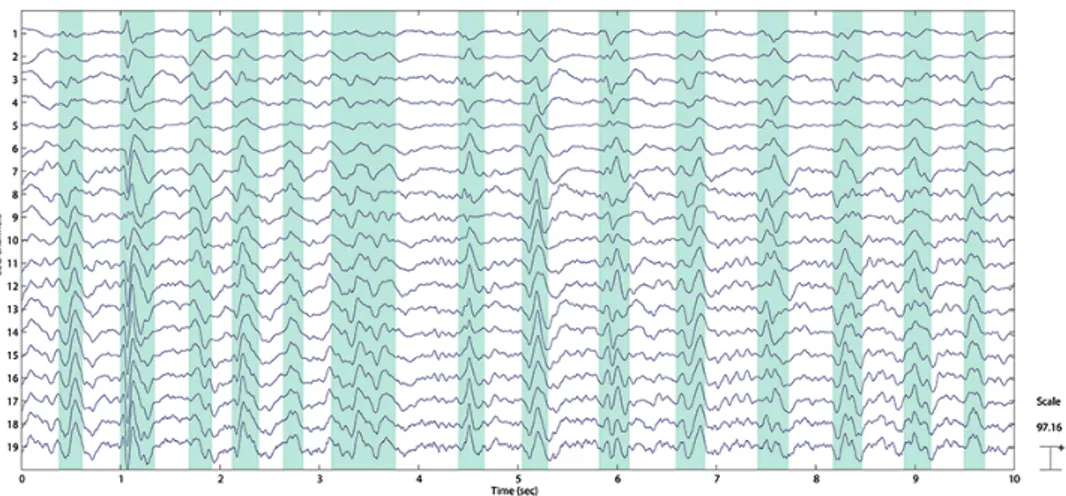
2.1 Partitioning of an EEG into segments with PSWCs and without
PSWCs - shaded segments correspond to the ones with PSWCs . . . 27
2.2 Original NetworksNπ andNπ for the patient CJD 10 . . . 29
2.3 Colored NetworkNπ for the patient CJD 10 . . . 29
2.4 Colored NetworkNπ for the patient CJD 10 . . . 30
2.5 Clique NetworkCN for the patient CJD 16 . . . 35
2.6 Clique NetworkCN for the patient CJD 16 . . . 35
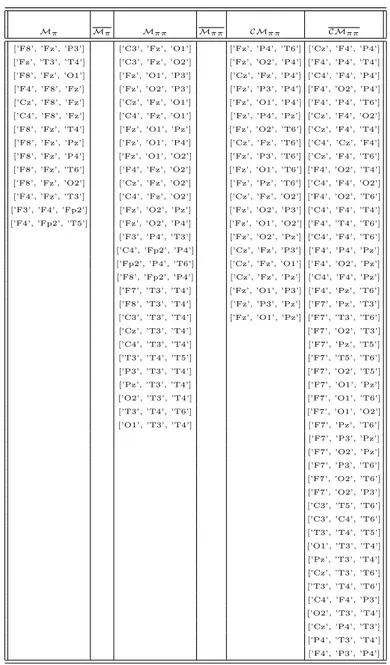
2.7 Two basic motifs belonging toCMππ (at left) andCMππ (at right) . . . 38
2.8 The most significant motif characterizing the tracing segments with PSWCs . . . 41
2.9 One of the most significant motifs characterizing the tracing segments without PSWCs . . . 41
2.10 A further significant motif characterizing the tracing segments without PSWCs . . . 42
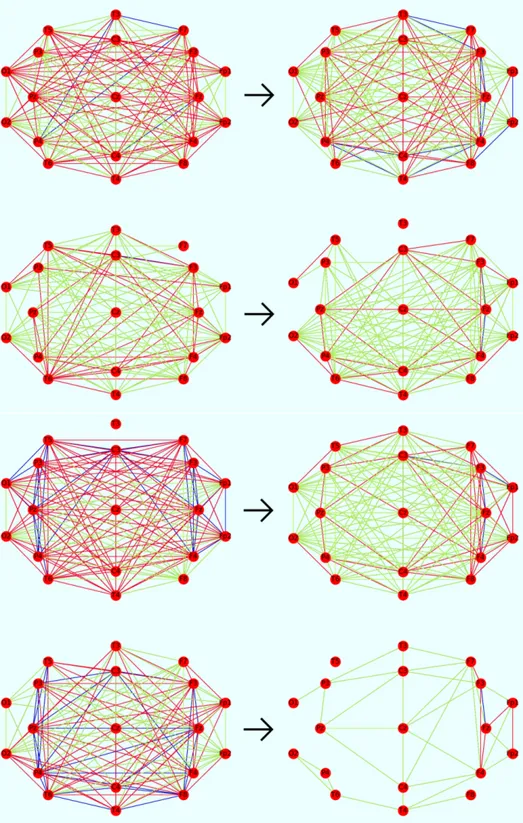
3.1 Distributions of the edge weights and colored networks for the possible kinds of subjects into consideration. In particular, the first row is associated with a control subject, the second with a patient with MCI and the third with a patient with AD. In the distributions, k denotes the subrange number between minE and maxE. In the networks, the disposal of nodes reflects the 10-20 system even if nodes are rotated 90 degrees clockwise. Observe that the control subject presents a high number of edges and most of them are blue; the corresponding distribution is biased towards left. The patient with MCI presents many edges and most of them are red; the corresponding distribution is balanced. The patient with AD presents a small number of edges and most of them are green; the corresponding distribution is biased towards right.. . . 50
3.2 The clique networks of Subjects 12 (Control Subject), 30 (MCI-MCI) and 51 (MCI-AD) at t0 (on the left) and t1 (on the right) . . . 52
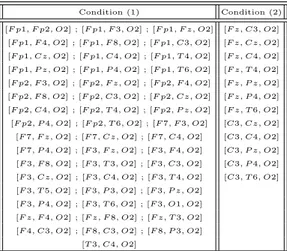
3.3 Two of the most significant basic motifs (on the top) and two of the most significant derived motifs (on the bottom) characterizing the
tracing segments of patients with MCI from patients with AD . . . 66
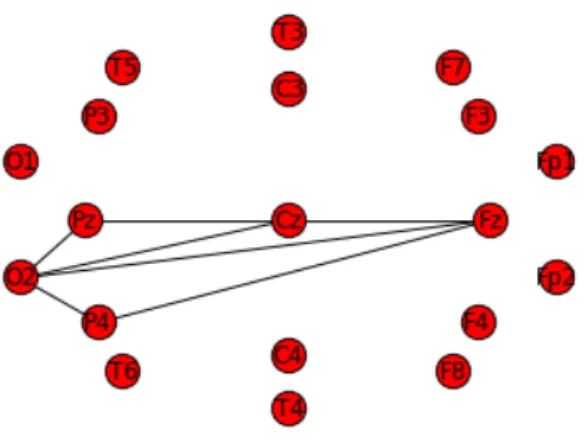
3.4 Results of the application of the approach of [292] to the four subjects into consideration . . . 68
3.5 The networksN0π andN1π for the two patients not converting to AD (above) and for the two other ones converting to AD (below) . . . 69
4.1 Average edge weight distribution in inter-ictal states . . . 77
4.2 Average edge weight distribution in ictal states . . . 78
4.3 Connection coefficient for the networkNrbw of Patient 18 . . . . 80
4.4 Connection coefficient for the networkNblk of Patient 18 . . . . 80
4.5 Zoomed plot of the value of connection coefficient of Figure 4.3 - first seizure . . . 81
4.6 Zoomed plot of the value of connection coefficient of Figure 4.3 -eighth seizure . . . 81
4.7 Connection Coefficient for mean networks during pre-ictal and ictal states . . . 83
5.1 The three kinds of metadata proposed by our model. . . 92
5.2 Network-based representations of the four sources into consideration. . 97
5.3 Ego networks corresponding to V.Ocean, C.Sea, W.P lace, C.P lace, V.Region and E.Location. . . 98
5.4 Ego networks corresponding to Ocean and Area. . . 99
5.5 The integrated thematic view. . . 99
6.1 Graphical representation of our approach to derive a “structure” for an unstructured source . . . 114
6.2 Representation, in our network-based model, of the unstructured source of our interest . . . 123
6.3 Structure of the JSON file associated with the semi-structured source of our interest . . . 124
6.4 Representation, in our network-based model, of the semi-structured source of our interest . . . 124
6.5 Distribution, in a semi-logarithmic scale, of the values of the the semantic similarity degrees of the objects belonging to the two sources of interest . . . 125
6.6 Computation time of XIKE and our approach against the number of concepts to process . . . 131
List of Figures
6.7 Computation time of DIKE, XIKE (u = 5 and u = 2) and our
approach against the number of concepts to process . . . 133
7.1 Graphical representation of our approach to deriving a “structure” for an unstructured source . . . 145
7.2 The network corresponding to the source Climate . . . 151
7.3 The network corresponding to the source Energy . . . 152
7.4 The network corresponding to the source Environment disasters . . . 152
7.5 Complex knowledge pattern from the node Energy to the node Population of the source Energy . . . 154
7.6 Complex knowledge pattern from the node Position of the source Environment disasters to the node Energy of the source Energy . . . 154
7.7 Complex knowledge pattern from the node Fujita scale of the source Environment disasters to the node Risk of the source Environment risks155 7.8 Complex knowledge pattern from the node Risk degree of the source Environment disasters to the node Risk of the source Environment risks156 7.9 Average clustering coefficient, density and transitivity of the network returned by our approach against the number of available keywords of the corresponding source . . . 158
7.10 A zoom of the graphs of Figure 7.9 referred to the case in which the number of keywords ranges between 5 and 20 . . . 158
7.11 Real and theoretical response time against data lake dimension and density . . . 160
7.12 Real and theoretical response time against data lake dimension and density (zoom of Figure 7.11) . . . 160
7.13 Real and theoretical response time against dimension and density for large data lakes (Scenario 1) . . . 161
7.14 Real and theoretical response time against dimension and density for large data lakes (zoom of Figure 7.13) . . . 162
7.15 Real and theoretical response time against dimension and density for large data lakes (Scenario 2) . . . 162
7.16 Real and theoretical response time against data lake dimension and density for large data lakes (zoom of Figure 7.15) . . . 163
9.1 Schematic representation of the proposed MIoT structure . . . 185
9.2 Distribution of the number of connected components of the instances of our MIoT against distances . . . 192
9.3 Graphical representation of our MIoT . . . 192
9.5 Trends of the number of seen nodes, visited nodes, IoT crossings and visited IoTs against the number of iterations performed by CDS (trends are separated in the first two graphs and put together in the
last one) . . . 201
9.6 Our Metric Dependency Graph . . . 205
10.1 Computation time (in seconds) against the size of MIoTs and queries used to generate the virtual IoTs (supervised approach) - first part . . . 231
10.2 Computation time (in seconds) against the size of MIoTs and queries used to generate the virtual IoTs (supervised approach) - second part . 231 10.3 Computation time (in seconds) against the size of MIoTs (unsupervised approach) . . . 232
11.1 Distribution of the values of NPD for Italy . . . 250
11.2 Distribution of the values of NPD for Estonia . . . 251
11.3 Distribution of the values of NPD for Tunisia . . . 252
11.4 Distribution of the values of RPD for Italy . . . 252
11.5 Distribution of the values of RPD for Estonia . . . 253
11.6 Distribution of the values of RPD for Tunisia . . . 254
11.7 Trend of AN St k and ARSkt against the neighborhood level t for China . 256 11.8 Trend of AN St k and ARSkt against the neighborhood level t for Luxenbourg . . . 257
11.9 Trend of AN St k and ARSkt against the neighborhood level t for Poland 257 11.10Average values of RPD over time for the patents published in 1985 . . . 261
11.11Average values of RPD over time for the patents published in 1990 . . . 261
11.12Average values of RPD over time for the patents published in 1995 . . . 262
11.13Average values of RPD over time for the patents published in 2000 . . . 262
11.14Distribution of the values of RPD for India, along with the levels corresponding to the top 5%, 10%, 15% and 20% of patents with the highest values . . . 263
11.15Distribution of the values of RPD for France, along with the levels corresponding to the top 5%, 10%, 15% and 20% of patents with the highest values . . . 263
11.16Distribution of the values of RPD for Japan, along with the levels corresponding to the top 5%, 10%, 15% and 20% of patents with the highest values . . . 264
12.1 Distribution of M1 for the publications of JCP ub in the year 2013 . . . . 282
List of Figures
12.3 Trend of M2 for the four countries in the year 2013 . . . 286
12.4 Number of hubs for each country in the year interval [2003,2013] . . . 286
12.5 Average number of publications per hub over time for the four countries287 12.6 Herfindahl index over time for the four countries . . . 287
12.7 Graphs CG2k for the four countries . . . 289
12.8 Graphs !CG1k for the four countries . . . 290
12.9 Graphs !CG2k for the four countries . . . 290
12.10Average number of publications of hubs over time for each research area292 12.11Average number of internal, external and alone publications for hub neighborhoods . . . 294
12.12Average number of internal, external and alone publications for hub neighborhoods (after the hubs present therein have been filtered out) . 295 12.13Values of AvgDim over time . . . 296
12.14Values of AvgCF rac over time . . . 296
12.15Values of AvgCN bh over time . . . 297
12.16Values of AvgDens over time . . . 298
13.1 Distribution of M1 for France and Greece . . . 304
13.2 Distribution of M1 for Egypt and Algeria . . . 304
13.3 Trend of|Nk| and |Ek| over time for China . . . 305
13.4 Trend of|Nk| and |Ek| over time for Italy . . . 305
13.5 Trend of|Dk| over time for China and Italy . . . 306
13.6 Distribution of clique size for Japan and UK . . . 306
13.7 Visualization of the values of Aggk for the countries reported in Table 13.1 . . . 308
13.8 Distribution of foreign collaborations for Algerian and Moroccan inventors . . . 308
13.9 Distribution of foreign collaborations for Tunisian and Egyptian inventors . . . 309
13.10Distribution of foreign collaborations for Israelis and Austrian inventors 309 13.11Distribution of foreign collaborations for Slovenian and Taiwan inventors310 13.12Visualization of the values of HI for the countries reported in Table 13.2311 13.13Distribution of M2 for Brazil and Austria . . . 312
13.14Trend of M3 over time for South Korea and Austria . . . 313
13.15Trend of M3 over time for Romania . . . 313
13.16Distribution of M4 for France and Greece . . . 315
13.18Visualization of the values of rAggk for the countries reported in
Table 13.3 . . . 317 13.19The clique social network of Spain and a zoomed portion of it . . . 317 13.20The clique social network of Israel and a zoomed portion of it . . . 317 13.21Visualization of the number of nodes of the clique social networks of
the countries reported in Table 13.4 . . . 318 13.22Visualization of the number of edges of the clique social networks of
the countries reported in Table 13.4 . . . 319 13.23Visualization of the density of the clique social networks of the
countries reported in Table 13.4 . . . 319 13.24Visualization of the values of rP atN umN bhk for the countries
reported in Table 13.5 . . . 320 13.25Trend of AvgDimN bhPk and AvgDimN bhk over time for Spain . . . 321
13.26Visualization of the values of rDimN bhk for the countries reported in
Table 13.6 . . . 322 13.27Distribution of patents against IPC classes for China and Spain . . . 322 13.28Trend of the distributions of patents against IPC classes for India
(Part 1) . . . 322 13.29Trend of the distributions of patents against IPC classes for India
(Part 2) . . . 323 13.30Visualization of the values of the modified Herfindahl Index concerning
the IPC classes of the countries reported in Table 13.7 . . . 324 13.31Distribution of the foreign neighbors of the Egyptian inventors for
“ICT” and “INS” classes . . . 324 13.32Distribution of the foreign neighbors of the Egyptian inventors for
“CM” and “PB” classes . . . 325 13.33Distribution of the foreign neighbors of the Egyptian inventors for
“IP” and “ME” classes . . . 325 13.34Distribution of the foreign neighbors of the Egyptian inventors for
List of Tables
1.1 Number of instances present in the IoTs of our MIoT . . . 14
2.1 Values of dim(CMi),|CMi| (1 ≤ i ≤ 3) and ccNπ for all the patients at our disposal . . . 32
2.2 Values of dim(CMi),|CMi| (1 ≤ i ≤ 3) and ccNπ for all the patients at our disposal . . . 32
2.3 Values of ccNπ, ccNπ and ccNπ − ccNπ ccNπ for all the patients at our disposal 33 2.4 The basic motifs extracted by our approach with αf set to its default value of 0.30 . . . 38
2.5 The basic motifs extracted by our approach with αf set to 0.20 . . . 39
3.1 Quantitative results representing the networks of Figure 3.1 . . . 49
3.2 Quantitative results representing the networks of Figure 3.2 . . . 53
3.3 Main characteristics of the patients enrolled for our experiments . . . 58
3.4 Average minimum weight, average mean weight and average maximum weight for the sets of interest . . . 62
3.5 Sensitivity, specificity and precision of the connection coefficient associated with overall EEGs . . . 63
3.6 Sensitivity, specificity and precision of the connection coefficient associated with the sub-bands of EEGs (virtual patients) . . . 63
3.7 Sensitivity, specificity and precision of the connection coefficient associated with the sub-bands of EEGs (real patients) . . . 63
3.8 Sensitivity, specificity and precision of the conversion coefficient . . . 63
3.9 Average connection coefficient and average clustering coefficient for all the sets of virtual and real people of interest . . . 65
3.10 Sensitivity, specificity and precision of the clustering coefficient . . . 65
3.11 The basic motifs belonging toMM derived by applying condition (1) and condition (2) . . . 66
3.13 Quantitative results representing the results shown in Figure 3.4 . . . 70
3.14 Values of the conversion coefficient conveeg for the four patients into examination . . . 70
4.1 Table produced by a neurologist about start and end time-slots for each seizure of Patient 18 . . . 80
4.2 Sensitivity, Specificity and Precision of our approach . . . 82
6.1 Keywords of the unstructured source of our interest . . . 123
6.2 Derived synonymies between objects of the two sources of interest . . . . 125
6.3 Derived type conflicts between objects of the two sources of interest . . 126
6.4 Derived overlappings between objects of the two sources of interest . . . 126
6.5 Precision, Recall, F-Measure and Overall of our approach . . . 129
6.6 Characteristics of the sources adopted for evaluating our approach . . . . 130
6.7 Precision, Recall, F-Measure and Overall of XIKE and our approach . . 130
6.8 Precision, Recall, F-Measure and Overall of DIKE, XIKE (u = 5, u = 2) and our approach . . . 132
6.9 Precision, Recall, F-Measure and Overall of our approach when a clustering-based technique for structuring unstructured sources is applied . . . 134
7.1 Keywords of the source Environment risks . . . 153
7.2 Keywords of the source Air pollution . . . 153
8.1 Results obtained by our approach during the training phase . . . 175
8.2 Results obtained by our approach during the testing phase . . . 176
8.3 Results obtained by our approach during the examination of some situations of interest . . . 177
9.1 Number of instances present in the IoTs of our MIoT . . . 191
9.2 Betweenneess Centrality, Degree Centrality, Closeness Centrality and Eigenvector Centrality, and the corresponding ranks, for all the nodes of the case study of Figure 9.4 . . . 194
9.3 Number of seen nodes, number of visited nodes, number of IoT crossings and number of visited IoTs against the number of iterations performed by CDS . . . 200
9.4 Number of seen nodes, visited nodes, IoT crossings and visited IoTs against the variation of inf and cnf . . . 202
List of Tables
9.6 Values of OCQ obtained by CDS, BFS, RW and MH for the two
weight configurations into examination . . . 207 10.1 Main features of the constructed MIoTs . . . 225 10.2 Values of the clustering coefficient for real and virtual IoTs against
the size of MIoTs and queries used to generate the virtual IoTs
(supervised approach) . . . 226 10.3 Values of the density for real and virtual IoTs against the size of
MIoTs and queries used to generate the virtual IoTs (supervised
approach) . . . 226 10.4 Values of both clustering coefficient and density of real and virtual
IoTs against the size of MIoTs (unsupervised approach) . . . 227 10.5 Average fraction of merged c-nodes against the size of MIoTs and
queries used to generate the virtual IoTs (supervised approach) . . . 228 10.6 Average fraction of real IoTs involved in a virtual IoT against the size
of MIoTs and queries used to generate the virtual IoTs (supervised
approach) . . . 228 10.7 Average fraction of merged c-nodes and average fraction of real IoTs
involved in a virtual IoT against the size of MIoTs (unsupervised
approach) . . . 229 10.8 Average Herfindahl Index of virtual IoTs against the size of MIoTs
and queries used to generate the virtual IoTs (supervised approach) . . 230 10.9 Average Herfindahl Index of virtual IoTs against the size of MIoTs
(unsupervised approach) . . . 230 10.10Average values of fst against the size of MIoTs and queries used to
generate the virtual IoTs (supervised approach) . . . 233 10.11Average values of fst against the size of MIoTs (unsupervised approach)233
10.12Average values of gst against the size of MIoTs and queries used to
generate the virtual IoTs (supervised approach) . . . 234 10.13Average values of gst against the size of MIoTs (unsupervised approach)235
10.14Average size and number of virtual IoTs against the increase of the MIoT size (unsupervised approach) . . . 236 11.1 Similarity Rate of NPD and RPD for some countries . . . 255 11.2 Values of the coefficients of the sixth-degree polynomial function that
best approximates the lifecycles of patents published from 1985 to 2000 259 11.3 Values of bc for several countries . . . 260
12.1 Values of RQ, F C, and T P in the year interval [2003,2013] when both conferences and journals are considered . . . 285 12.2 Quantitative differences characterizing the cooperation behaviors of
hubs in the four countries (first time interval on the top and second time interval on the bottom) . . . 288 12.3 Number of nodes, number of edges and density of CG1k (on the top)
and of CG2k (on the bottom) for all countries . . . 291
12.4 Hub number over time in the three different situations into examination293 13.1 Values of Aggk for several countries . . . 307
13.2 Values of HI, HI Top 80% and HI∗ Top 80% for North African
countries . . . 311 13.3 Values of rAggk and rfk for some countries . . . 316
13.4 Number of nodes, number of edges and density of the clique social
networks of some countries . . . 318 13.5 Average number of patents of the neighbors of a power inventor, of a
generic inventor and values of the parameter rP atN umN bh . . . 319 13.6 Values of rDimN bh for several countries in the year 2013 . . . 321 13.7 Modified Herfindahl Index concerning the IPC classes of some countries 323
1
Introduction
1.1 Motivations
In the big data era, the number, the volume and the variety of available data sources are dramatically increasing. As a consequence, one of the main open issues to address in computer science research consists of uniformly extracting knowledge and facing (very complex) decision problems in heterogeneous application contexts. However, as generally happens, a solved problem becomes an opportunity. In fact, if we were able to define a model suitable to uniformly represent and handle highly heterogeneous data formats, we could use it to manage data coming from several research contexts. In other words, an approach designed to solve an open problem in one context can be easily transposed to address other open issues in other contexts. This thesis aims at providing a contribution in this setting. Indeed, it proposes a social network-based approach to uniformly extract knowledge and support decision making concerning disparate research contexts. In particular we will focus on four contexts, namely: Biomedical Engineering (BE - specifically electroencephalogram tracks to investigate neurological disorders), Data Lakes (DL), Internet of Things (IoT) and Innovation Management (IM - specifically patent data to investigate innovation trends).
The attempt to uniformly handle data sources characterized by heterogeneous formats for extracting knowledge and supporting decision making has been performed in the past, when most of available data were structured or semi-structured [288, 60, 62, 123, 348, 351]. However, with the advent of the big data phenomenon, most of available data (i.e., about 80%) are unstructured [110]. This is rapidly changing the coordinates of several research fields. So, the need of new models and approaches to handle data with disparate formats is compulsory. As for this exigency, it was shown that network-based models and approaches have the flexibility and, at the same time, the power of effectively and efficiently handling data represented in heterogeneous formats [76]. For this purpose, the advances in the Operations Research (OR) field,
especially in Graph Optimization (GO), which network-based models and approaches derive from, can successfully support knowledge extraction and decision making.
For instance Social Network Analysis (SNA) has been extensively investigated from some decades and, with the advent of Online Social Networks (OSNs), it has become one of the hot topics in computer science. In this context, several interest-ing results concerninterest-ing information diffusion [301], homophily [305], centrality [162], crawling [84], etc., have been already found. Network models have also been suc-cessfully adopted to face issues concerning IoTs [49], with particular reference to Wireless Sensor Networks (WSNs) and event and anomaly detection [114, 165]. Most of these studies focus on the analysis of data produced by single devices [365], while few are based on the processing of aggregated data acquired by WSNs [90]. Here, network based models have been mainly applied to WSN design and routing [287, 415, 15, 57, 197, 187]. The usage of these models in Biomedical Engineering has been successfully experimented in the past to handle electroencephalographic (EEG) and electrocardiographic (ECG) data [279]. On the other side, brain diseases have been largely analyzed in Biomedical Engineering. Here, EEG analysis supports the study of problems related to the brain, in a non-invasive and economic fashion. In this context, network based models have been used for the diagnosis of several patho-logical states in humans [192, 478, 389]. Finally, the same models have been already used to face several problems concerning Innovation Management. Among them, we cite the detection of hub institutions in a country [153].
In this thesis, we will examine the network-based models presented in the past literature to represent structured and semi-structured sources [76]. In particular, we will determine the pros and the cons of each of them. Furthermore, we will investigate the features they need to have for handling unstructured data. Finally, we will define a new model maintaining the pros and avoiding the cons of the previous ones by adding the necessary features to make it capable of handling also unstructured data.
In the same way, we can define a unique network analysis-based approach for extracting knowledge and supporting decision making in disparate contexts. Starting from the past literature, we will define new and more appropriate techniques for extracting knowledge and supporting decision making in several domains. This way of proceeding will return a set of general techniques, well suited for the new model and that, when applied to a certain context, allow us to address issues typical of that context. In other words, we will produce a set of generic and, at the same time, powerful template techniques, which can be specialized in many application fields and can support the resolution of problems typical of each of these fields.
1.1 Motivations 3
We will apply the new model and the new approach to four contexts of interest, namely: (i) Neurological Disorders, (ii) Data Lakes, (iii) IoT, and (iv) Information Management.
In the whole thesis, we will underline the commonalities of the models and ap-proaches described in the four contexts. In particular, we will try to define some best practices and we specify some guidelines for modifying models in order to further empower them for future research efforts.
1.1.1 Neurological Disorders
The first context refers to EEG data. Here, we propose a new network-based approach to help experts to investigate neurological disorders in which the connections among brain areas play a key role. Our approach receives the EEG of a patient and associates a network with it, with nodes that represent electrodes and with edges that denote the disconnection degree of the corresponding brain areas. Starting from this network, we investigate the strength of the connections between brain areas and use this strength to investigate three neurological disorders, namely Creutzfeldt-Jacob Disease (CJD), Alzheimers Disease (AD) and Childhood Absence Epilepsy (CAE).
In recent years, the incidence of neurological disorders is growing also because pop-ulation is aging in most countries. At the same time, the efforts to design approaches capable of determining the onset of these disorders and of monitoring their course in the corresponding patients are intensifying [138, 207, 463]. Even the tools supporting neurologists in their activities are becoming more complex and sophisticated (think, for instance, of electroencephalograms with 256 electrodes, instead of the classical ones with 19 electrodes). The counterpart of these important advances is the need of handling huge amounts of data that experts have difficulty to analyze manually. In this scenario, automatic tools helping experts to analyze available data are becoming mandatory.
Among the many diagnostic tools available to neurologists, electroencephalogram (hereafter, EEG) is one of the least invasive. For this reason, it is adopted to support the analyses of many neurological disorders. In the literature, many techniques to process EEG data have been proposed, and most of them are based on signal analysis [88, 220, 343, 418, 456, 422].
An EEG can be easily modeled as a network. Indeed, several approaches that use networks to model EEGs and to investigate neurological disorders have been presented [122, 280, 295, 370, 416, 472] in the past. After having modeled an EEG as a network, these approaches generally use basic concepts and metrics of network analysis (e.g., centrality measures, diameter, path length) to help an expert in her diagnosis.
It is well known that, in many neurological investigations, the key role is played by the connections between the brain areas. Network analysis provides some basic parameters to evaluate the connection level of a network. The most known of them are network density and clustering coefficient. However, these two parameters have not been specifically conceived for measuring the connection degree of a network. As a consequence, a challenging issue could be defining a parameter specifically thought for this purpose. Hopefully, this parameter could work better than density and clustering coefficient for evaluating the connection degree of a network. To define it, we observe that cliques play a central role in identifying highly-connected portions of a network. Thus, they could represent the key concept in this task, because the higher the number and the dimension of available cliques in a network and the higher the corresponding connection level.
However, a network associated with an EEG is totally connected, since a voltage difference can be evaluated for each pair of its electrodes. On the other side, voltage difference between two electrodes is an indicator of the strength of the connection between them and, ultimately, between the corresponding brain areas. As a conse-quence, it is reasonable to use a metric derived from it to weigh the corresponding edges in the network. This metric could represent the distance, or the disconnection level, of the associated brain areas. These edge weights could guide the analyses of the network and, ultimately, of the corresponding patient.
In this scenario, a metric that, starting from the voltage differences, can determine the disconnection level between two nodes is particularly important. We have decided to propose a new approach orthogonal to the metric adopted to weigh network edges.
1.1.2 Data Lakes
The second context will focus on Data Lakes. In particular, we propose a new network-based approach to uniformly manage heterogeneous data lake sources. This approach first models involved sources by means of networks, then it exploits network-based techniques to extract interchema properties and knowledge patterns from them. The extracted knowledge will represent the metadata that are, in turn, the core of a data lake.
Metadata have always played a key role in favoring the cooperation of heteroge-neous data sources. This role has become much more crucial with the advent of data lakes, in which case metadata represent the only possibility to guarantee an effective and efficient management of data source interoperability. For this reason, the necessity to define new models and paradigms for metadata representation and management appears crucial in the data lake scenario. We aim at addressing this issue by propos-ing a new metadata model, well suited for data lakes. Furthermore, to give an idea of
1.1 Motivations 5
its capabilities, we present an approach that leverages it to “structure” unstructured sources and to extract thematic views from heterogeneous data lake sources.
In the last few years, the “big data phenomenon” is rapidly changing the re-search and technological “coordinates” of the information system area [93, 451]. For instance, it is well known that data warehouses, generally handling structured and semi-structured data offline, are too complex and rigid to manage the wide amount and variety of rapidly evolving data sources of interest for a given organization, and the usage of more agile and flexible structures appears compulsory [128]. Data lakes are one of the most promising answers to this exigency. Differently from a data ware-house, a data lake uses a flat architecture (so that the insertion and the removal of a source can be easily performed). However, the agile and effective management of data stored therein is guaranteed by the presence of a rich set of extended metadata. These allow a very agile and easily configurable usage of the data stored in the data lake. For instance, if a given application requires the querying of some data sources, one could process available metadata to determine the portion of the involved data lake to examine.
In this scenario, we propose a new metadata model well suited for data lakes. Our model starts from the considerations and the ideas proposed by data lake companies (in particular, it starts from the general metadata classification also used by Zaloni [341]). However, it complements them with new ideas and, in particular, with the power guaranteed by a network-based and semantics-driven representation of meta-data. Through this approach, our model can take advantage of all the results already found in network theory and semantic-based approaches. As a result, it can allow a large number of sophisticated tasks that currently adopted metadata models cannot guarantee. For example, it allows the definition of a structure for unstructured data. It also allows the extraction of thematic views from data sources, i.e. the construction of views on one or more topics of interest to the user, obtained by extracting and merging data from different sources.
1.1.3 Internet of Things
The third context regards an IoT scenario. In this case, we will use Social Network Analysis to represent multiple networks of smart objects interconnected to each other through cross objects. Then, we will use this representation to extract knowledge from heterogeneous sensor data streams and to build virtual IoTs in a Multiple IoTs scenario.
The Internet of Things (IoT) is currently considered the new frontier of the In-ternet, and a lot of research results about this topic can be found in literature. One of the most effective ways to investigate and implement IoT is based on the use of
the social network paradigm: Social Internet of Things (SIoT) is an excellent attempt in this direction. In the last years, social network researchers have introduced new paradigms capable of capturing the growing complexity of this scenario. One of the most known is the Social Internetworking System, which models a scenario comprising several related social networks. We investigate the possibility of applying the ideas underlying Social Internetworking System to IoT, and we propose a new paradigm, called MIoT (Multiple Internets of Things), capable of modelling and handling the increasing complexity of this last context.
MIoT can be seen as an evolution of SIoT (Social Internet of Things). In SIoT, things are empowered with social skills, making them more similar to people [39, 42]. In particular, they can be linked by five kinds of relationship, namely: (i) parental object relationship; (ii) co-location object relationship; (iii) co-work object relation-ship; (iv) ownership object relationrelation-ship; (v) social object relationship. If: (i) a node is associated with each thing, (ii) an edge is associated with each relationship between things, and, finally, (iii) all the nodes and the edges linked by the same relationship are seen as joined together, SIoT can be modeled as a set of five pre-defined networks. Here, some nodes belong to only one network (we call them inner-nodes), whereas other ones belong to more networks (we call them cross-nodes).
The idea underlying SIoT is extremely interesting and, as a matter of fact, has received, and is still receiving, a lot of attention in the literature. However, we think that the number of relationships that might connect things could be much higher than five, and relationships could be much more variegate than the ones currently considered by SIoT. As a consequence, we think that a new paradigm, taking into account this fact, is in order.
We think that the key concepts of SIS can also be applied to things (instead of users) and to relationships between things and we propose the MIoT (Multiple Internets of Things) paradigm. The core of the SIS paradigm is modeling users and their relationships as a unique big network and, at the same time, as a set of related social networks connected to each other thanks to those users joining more than one social network. The MIoT paradigm arises in this scenario. Roughly speaking, a MIoT can be seen as a set of things connected to each other by relationships of any kind and, at the same time, as a set of related IoTs, one for each kind of relationship. Actually, as will be clear in the following, a more precise definition of MIoT would require the introduction of the concept of instance of a thing in an IoT.
1.1.4 Innovation Management
Finally, the fourth context concerns patent data. In this case, we found some inspi-rations from the approaches that use network-based models to determine institutions
1.1 Motivations 7
acting as hubs [153]. The ultimate goal is the extraction of knowledge concerning patents, their characteristics and their applicants, as well as information about the influence and the scope of a patent on the other ones.
Patents and collaboration between researchers and, more in general, scientometrics and bibliometrics have been largely investigated in the past. The impressive devel-opment of innovations in all the R&D fields and the data available for investigations are growing at a very rapid rate. This has made the adoption of big data centered-techniques compulsory for their analysis. As a matter of fact, the problem of extracting useful knowledge from these data can be seen as a Data Mining problem. In this con-text, network analysis-based approaches are extremely promising. This is due to the fact that in recent years it has become incredibly important to evaluate the perfor-mances of researchers, universities, institutions, etc. Indeed, research collaborations across institutions, firms and countries have been largely investigated in strategy and management literature [409, 308, 79]. Moreover, different studies have been performed to understand whether international flows from developed countries to developing and less-developed ones have some positive effects in these last ones [178]. Furthermore, many studies investigate the impact and the effects of international knowledge flows by focusing on R&D collaborations and inventions and on their impact on innovation [260, 300, 163].
As we pointed out, Social Network Analysis [458, 53, 52, 24, 106, 107, 258, 328] and, more in general, graph theory, have been a prominent family of approaches adopted in the past in this context (see, for istance [276, 36, 46, 72, 446, 359, 10, 13, 277, 237, 103, 71, 11]). Furthermore, it is possible to foresee that they will be even more employed in the future, due to the increasing number of proposals someway involving them.
As it will be clear in the following, our approach presents several features that characterize it with respect to the related ones already proposed in the past. It does not focus on a case study (for instance, on a group of countries). By contrast, it consists of a general methodology for the extraction of several knowledge patterns about innovation geography that can be applied on any country of interest for the user. This is obtained by investigating inventors and not applicants. Furthermore, our approach redefines several metrics, which have been already introduced in SNA or in other research fields, in such a way as to make them suitable to the application context of our interest. It also redefines the concepts of neighborhood, internal neighborhood and external neighborhood of an inventor, which have been previously introduced in totally different research fields. As for this contexts, as we will see in the following, we are able to introduce several new concepts. Finally, our approach defines new metrics about patent and inventor relationships not present in the past; think, for instance,
of the aggregation coefficient and some parameters based on the modified Herfindahl Index for the computation of the heterogeneity of the external collaborations of a country and of the variability of the IPC classes, which the patents of a country refer to.
1.2 Complex Networks as a unifying model for heterogeneous
contexts
In this section we provide an overview of a complex network-based model capable of representing disparate scenarios. This model, whose specification will be presented in the next chapters, represents the base for the unifying approach to knowledge extraction that we examine in Section 1.3.
Our complex network-based approach can represent any scenario consisting of several entities (generally of the same type) that interact with each other and that are linked by one or more forms of relationships. Formally speaking, it can be represented as a network:
N = ⟨V, E⟩
Here, V is the set of nodes of N . Each node vi∈ V corresponds to an entity, for
instancve to an electrode, a metadata label, an object or a patent.
E is the set of the edges of N . Each edge eij connects the nodes vi and vj and
can be represented as:
eij= (vi, vj, wij)
Edges might be weighted. The weight wij is a measure of the connections strength
between vi and vj. It is an indicator of the connection/disconnection level of vi and
vj. Taking into account the peculiarities of the different areas in which the model can
operate, we have made our model orthogonal to the different distance measurements that can be used. Indeed, in our experiments, we will employ different types of weight. In some cases, the weight is part of the input (e.g. the PDI in the EEG), while, in other cases, it is computed by pre-processing the input data (think, for instance, of similarity weights in the analysis of similarities between the metadata of different data lakes).
In many of the cases that we have considered, in order to specifically address the analysis of the problems of our interest, we had to build projections of the networks, for instance by removing the edges. This allowed us to make our model more “user-friendly” and “expressive” and, at the same time, more capable of discriminating strong and weak connections between the different network areas.
1.3 Social Network Analysis as a unifying approach to knowledge extraction 9
A networkNπ, being a projection of a networkN , is obtained from this last one
by removing the edges with an “excessive” weight and by coloring the others based on their weight. As a matter of fact, if the edges weights represent distance, the edges with an “excessive” weight identify weak connections between the corresponding nodes and can be removed. The remaining edges can be, instead, colored based on their strength. In particular, blue edges denote strong connections, red edges represent intermediate ones and, finally, green edges indicate weak connections. We formalize the network Nπ as follows:
Nπ =⟨V, Eπ⟩
Here, the nodes ofNπ are the same as the ones ofN . To define Eπ, we consider
the distribution of the weights of the edges ofN . Specifically, let maxE (resp., minE)
be the maximum (resp., minimum) weight of an edge of E. Starting from maxE and
minE, it is possible to define a parameter stepE= maxE10−minE, which represents the
length of a “step” of the interval between minE and maxE. We can define dk(E),
0≤ k ≤ 9, as the number of the edges of E with weights that belong to the interval between minE+ k· stepE and minE+ (k + 1)· stepE. All these intervals are closed
on the left and open on the right, except for the last one that is closed both on the left and on the right. Eπ consists of all the edges of E belonging to dk(E), where
k≤ thmax.
Now, we can “color” the edges composing Eπ. Specifically, Eπ = Eπb ∪ Eπr∪ Eπg.
Here: • Eb π= " eij∈ E | eij∈#thmin≤k≤thbrdk(E) $ ; • Er π= " eij∈ E | eij∈#thbr<k≤thrgd k(E)$; • Eg π= " eij∈ E | eij∈#thrg<k≤thmaxd k(E)$.
As will be clear in the following, the projection technique described above, and therefore the corresponding networkNπ, represent powerful tools at disposal for
defin-ing a uniform approach handldefin-ing knowledge in disparate contexts.
1.3 Social Network Analysis as a unifying approach to
knowledge extraction
After having seen that complex networks can represent a unifying model to represent disparate contexts, in this section we aim ad providing a highlight of how, after having modeled contexts as complex or social networks, Social Network Analysis can be exploited as a unifying approach to extract knowledge regarding these contexts. In particular, in the following of this section, in order to prove an overview of this
claim, we will focus on some Social Network Analysis concepts and operators. In the next chapters, we will see that these concepts and operators could be much more numerous.
1.3.1 Clique
In Social Network analysis, one of the most important (and, at the same time, simple and basic) tools for investigating network connection is the concept of clique. We recall that, given a network, a clique of dimension k represents a totally connected subnetwork with k nodes. That is, its induced subgraph is complete. The task of finding whether there is a clique of a given size in a graph (the clique problem) is NP-complete, but, despite this hardness result, many algorithms for finding cliques have been studied.
As for the four contexts examined in this thesis, the concept of clique can be used in different ways. For example, cliques can be adopted as supporting data structures in the process of identifying motifs (i.e., recurring connection patterns within the network), but also to calculate a connection coefficient that, quantitatively, is able to return information about the strength of the network itself.
The most important applications of this concept within our work are the following: • in neurological disorders, to punctual monitor which areas of the brain are most connected, and, therefore, what parts of the brain continue to operate correctly; • in innovation management, to identify if there are groups of authors or
organiza-tions that often operate together to realize patents.
1.3.2 Centralities
Centrality is one of the most investigated issues in network analysis. It aims at mea-suring the importance of a node in a network. It allows experts: (i) to measure the relevance and the criticity of nodes in their networks; (ii) to define forms of distance between network nodes or areas; (iii) to measure the cohesion degree of a subnetwork; (iv) to identify cohesive subnetworks or network communities.
In the past, several centrality measures have been proposed in the literature [94, 386, 162, 186, 161, 423, 80]. Among them, the most general and best known ones are: (i) degree centrality, based on the number of arcs incoming in, or outgoing from, each node; (ii) closeness centrality, based on distances between nodes; (iii) betweenness centrality, based on the shortest paths connecting pairs of nodes; (iv) eigenvector centrality, based on both the number and the centrality of nodes whose outgoing arcs are incident on the nodes of interest.
1.3 Social Network Analysis as a unifying approach to knowledge extraction 11
All these measures, as well as the other ones proposed in the literature, could be adopted in the investigation of the four contexts of interest for this thesis. In partic-ular, they have been adopted as the starting point of several information extraction tasks. Specifically:
• in the IoT analysis, they allowed us to identify cross-nodes within MIoT;
• in the Data Lakes analysis, they allowed us to re-construct a structure for unstruc-tured sources;
• in the innovation management analysis, they allowed us to identify the so-called innovation hubs, i.e., people and/or organization that can favor the development of the whole neighborhood connected with them.
1.3.3 Homophily, Ego Networks and Neighborhoods
Due to the concept of homophily [305] in Social Network Analysis, the behavior of an individual is strictly connected to the one of the individuals most strictly connected to her. Describing and indexing the variation across nodes in the way they are embedded in “local” social structures is the goal of the analysis of ego networks. Ego is an individual focal node. A network has as many egos as it has nodes. Egos can be persons, groups, organizations, or whole societies. A neighborhood, instead, is the collection of an ego and all the nodes to whom it has a connection at some path length. In Social Network Analysis, the “neighborhood” involved in ego networks is almost always one-step; that is, it includes only the ego and the actors that are directly adjacent to her. The neighborhood also includes all of the ties among all of the actors to whom ego has a direct connection. The boundaries of ego networks are defined in terms of neighborhoods.
Homophily, ego networks and neighbors have been extensively exploited through-out this thesis and allowed us to extract knowledge in all the four contexts of our interest. In particular:
• in the IoT analysis, they allowed us to identify communities within object net-works;
• in the Data Lakes analysis, they represent the starting point of the Knowledge Pattern extraction process;
• in the innovation management analysis, they allowed us to determine hubs and, more in general, the influence of a patent, an authors or an organization on the connected ones;
1.4 A sketch of possible applications
In this section, we provide a sketch of possibile applications of our approach. The details about this issue can be found in the next chapters of this thesis.
1.4.1 Neurological Disorders
The EEGs to perform our investigation were provided by different Italian centers (i.e., University “Magna Graecia” of Catanzaro, Neurologic Institute “Carlo Besta” of Milano, Istituto Bonino-Pulejo and Neurologic Institute of the University of Catania). They regard a group of patients with neurological disorders (in particular, patients suffering from Creutzfeldt-Jacob Disease - CJD -, Mild Cognitive Impairment - MCI -, Alzheimer’s Disease - AD -, Childhood Absence Epilepsy - CAE) examined in the last 15 years in these centers. The EEGs were recorded through scalp electrodes placed according to the international 10-20 system. The specific montage was: Fp1, Fp2, F3, F4, C3, C4, P3, P4, O1, O2, F7, F8, T3, T4, T5, T6, Fz, G2, Cz and Pz, where G2 (located between electrodes Fz and Cz) was used as reference. Each EEG was recorded in the morning in a comfortable, eye closed, resting state. The mean recording length is 20 min. The EEG was high-pass filtered at 0.5 Hz, low-pass filtered at 70 Hz. Furthermore a 50 Hz notch filter was also applied. The EEG traces were then downsampled to 256 Hz. The artifactual epochs were visually detected and marked by the EEG experts and later excluded from the analysis. Cleaned data was stored in a MongoDB database [6]. To give an idea of it, we report some of its features: (i) size = 357.8 MB; (ii) number of collections = 10 ; (iii) number of objects = 20; (iv) number of indexes = 10; (v) index size = 160 KB.
Clearly, we investigated the three neurological disorders separately. Some impor-tant results we have found are the following:
• We have defined an approach to identify and characterize Periodic Sharp Wave Complexes in EEGs. These are important indicators of the presence of CJD in a patient.
• We have defined an approach able to discriminate patients who convert from MCI to AD and also to predict, at least partially, the occurrence of an epileptic seizure. • We have defined an approach able to predict, at least partially, the occurrence of
an epileptic seizure.
1.4.2 Data Lakes
To perform our experiments about data lakes, we constructed a set DS of data sources consisting of 2 structured sources, 4 semi-structured ones (2 of which were XML
1.4 A sketch of possible applications 13
sources and 2 were JSON ones), and 4 unstructured ones (2 of which were books and 2 were videos). All these sources stored data about environment and pollution. To describe unstructured sources, we considered a list of keywords for each of them. These keywords were derived from Google Books, for books, and from YouTube, for videos. The interested reader can find the schemas, in case of structured and semi-structured sources, and the keywords, in case of unstructured sources, at the address http://daisy.dii.univpm.it/dl/datasets/dl1. The password to type is “za.12&;lq74:#”.
It could appear that taking only 10 sources is excessively limited. However, we made this choice because we wanted to fully analyze the behavior and the perfor-mance of our approach and, as it will be clear, this requires the human intervention for verifying obtained results. This intervention would have become much more dif-ficult with a higher number of sources to examine. At the same time, our test set is fully scalable. As a consequence, an interested reader, starting from the data sources provided at the address http://daisy.dii.univpm.it/dl/datasets/dl1, can con-struct a data set with a much higher number of sources, if necessary.
For our experiments, we used a server equipped with an Intel I7 Dual Core 5500U processor and 16 GB of RAM with the Ubuntu 16.04.3 operating system. Clearly, the capabilities of this server were limited. However, they were adequate for the (small) data set DS we have chosen to use in our tests.
Some important results we have found in this context are the following:
• We have defined an approach to create a structured representation of a natively unstructured data source.
• We have defined an approach to extract interschema properties and complex knowledge patterns from a data lake possibly consisting of a huge number of disparate data sources.
1.4.3 Internet of Things
Since the MIoT paradigm has been proposed for the first time by us in several papers connected with this thesis, there is no known case study or real example about it yet. As a consequence, in order to have a testbed for our experiments, we constructed a MIoT starting from some open data about things available on the Internet. In particular, we derived our data from Thingful [3]. This is a search engine for the Internet of Things, which allows us to search among a huge number of existing things, distributed all over the world. Thingful also provides some suitable APIs allowing the extraction of all the data we are looking for.
In order to construct our MIoT, we decided to work with 250 things whose data was derived from Thingful.
IoT Number of instances a.home 22 a.health 22 a.energy 22 a.transport 22 a.environment 22 b.near 14 b.mid 38 b.far 53 c.plain 44 c.hill 50 c.mountain 6
Table 1.1. Number of instances present in the IoTs of our MIoT
Our MIoT consists of 11 IoTs. We associated an object with each thing; therefore, we had 250 objects. In principle, for each object, we could have associated an instance for each dimension we aimed to investigate. However, in order to make our testbed closer to a generic MIoT, representing a real scenario, where it is not said that all the objects have exactly the same number of instances, we decided not to associate an instance with each dimension for all dimensions of our interest. Instead, we associated only one instance (distributed uniformly at random among the dimensions, and based on the features of the things of the IoTs of a given dimension) to 200 of the 250 objects. Analogously, we associated two instances (distributed by following the same guidelines mentioned above) to 35 of the 250 objects. Finally, we associated three instances to 15 of the 250 objects. At the end of this phase, we had 315 instances, distributed among the 11 IoTs of our MIoT, as shown in Table 1.1.
Some important results we have found in this context are the following: • we have defined a new crawler, specifically conceived for our MIoT; • we have defined a new approach to create topic-guided virtual IoTs. 1.4.4 Innovation Management
Data regarding patents adopted in our analyses has been taken from PATSTAT-ICRIOS database [108].
PATSTAT (i.e., EPO worldwide PATent STATistical database) is a database stor-ing raw data about patents. It was constructed by EPO in cooperation with the World Intellectual Property Organization (WIPO), OECD and Eurostat. It is currently man-aged by EPO. It stores data about all patents, from 1978 to the current year, coming


![Fig. 3.4. Results of the application of the approach of [292] to the four subjects into con- con-sideration](https://thumb-eu.123doks.com/thumbv2/123dokorg/5027304.55796/91.892.93.637.773.1035/fig-results-application-approach-subjects-sideration.webp)