Università degli Studi ROMA TRE
SCUOLA DOTTORALE IN BIOLOGIA (XXII CICLO) Sezione: SCIENZE BIOMOLECOLARI E CELLULARI
Development of methods for high through-put proteins structure and function prediction through the use of GRID computing infrastructures.
Dottorando: Docente Guida:
Dott. Giovanni Minervini Dott. Fabio Polticelli
2
Università degli StudiROMA TRE
SCUOLA DOTTORALE IN BIOLOGIA (XXII CICLO) Sezione: SCIENZE BIOMOLECOLARI E CELLULARI
Sviluppo di metodi per la predizione massiva di struttura e funzione di proteine attraverso l’utilizzo di infrastrutture di calcolo condiviso GRID.
Dottorando: Docente Guida:
Dott. Giovanni Minervini Dott. Fabio Polticelli
3
BACKGROUNDThe number of natural proteins represents a small fraction of all the possible protein sequences and there is an enormous number of proteins never sampled by nature, the so called “never born proteins” (NBPs). A fundamental question in this regard is if the ensemble of natural proteins possesses peculiar chemical and physical properties or if it is just the product of contingency coupled to functional selection. A key feature of natural proteins is their ability to form a well defined 3D structure. Thus, the structural study of NBPs can help to understand if natural protein sequences were selected for their peculiar properties or if they are just one of the possible stable and functional ensembles.
TECHNICAL IUSSUES
The structural characterization of a huge number of random proteins cannot be approached experimentally, thus the problem has been tackled using a computational approach. A large random protein sequences library (2×10⁴ sequences) was generated, discarding amino acid sequences with significant similarity to natural proteins, and the corresponding structures were predicted using Rosetta. Given the highly computational demanding problem, Rosetta was ported in grid and a user friendly job submission environment was developed within the GENIUS Grid Portal. Protein structures generated were analysed in terms of net charge, secondary structure content, surface/volume ratio, hydrophobic core composition, etc.. RESULTS
The vast majority of NBPs, according to the Rosetta model, are characterized by a compact three-dimensional structure with a high secondary structure content. Structure compactness and surface polarity are comparable to those of natural
4
proteins, suggesting similar stability and solubility. Deviations are observed in α helix-β sheet relative content and in hydrophobic core composition, as NBPs appear to be richer in helical structure and aromatic amino acids with respect to natural proteins.CONCLUSIONS
The results obtained suggest that the ability to form a compact, ordered and water-soluble structure is an intrinsic property of polypeptides. The tendency of random sequences to adopt α helical folds indicate that all-α proteins may have emerged early in prebiotic evolution. Further, the lower percentage of aromatic residues observed in natural proteins has important evolutionary implications as far as tolerance to mutations is concerned.
5
INTRODUZIONEIl numero di proteine naturali rappresenta una piccola frazione di tutte le possibili sequenze immaginabili. Esiste quindi un numero enorme di proteine potenzialmente non esplorate dalla natura, le cosiddette "Never Born Proteins" (NBPs). Una questione fondamentale, a questo riguardo, è chiarire se l'insieme delle proteine naturali possieda proprietà chimiche e caratteristiche fisiche peculiari, le quali in qualche modo rendano le proteine oggi osservabili in natura, un qualcosa di “irripetibile” o se, meno prosaicamente, esse possano essere solo il prodotto della contingenza unita ad una forte pressione evolutiva operata dalla selezione naturale. Una caratteristica fondamentale delle proteine naturali è la loro capacità di dar luogo ad una struttura tridimensionale ben definita. Lo studio della struttura fine di NBPs può aiutare a capire se le sequenze di proteine naturali siano state scelte per le loro proprietà particolari o se esse stesse rappresentino solo una delle possibili soluzioni in grado di dare luogo ad una struttura stabile e allo stesso tempo funzionale per la vita. Le NBPs proprio per la vastità numerica che ne caratterizza la loro stessa concezione rappresentano una interessante sfida per le attuali tecniche di studio.
Studiarne la struttura significa infatti escogitare un nuovo approccio che permetta di sondare “in maniera massiva” un così ampio bacino di informazioni. Le metodiche sperimentali che si basano su di un approccio computazionale possono aiutare questa esplorazione e fornire allo stesso tempo nuovi mezzi di indagine per lo studio di problemi di complessità analoga, per numero di elementi e qualità della ricerca, come lo studio massivo di interi proteomi.
APPROCCIO METODOLOGICO
La caratterizzazione strutturale di un gran numero di proteine a sequenza casuale non può essere affrontata sperimentalmente, quindi il problema è stato affrontato con un approccio computazionale. E’ stata quindi generata una grande libreria di sequenze proteiche casuali (pari a 2×10⁴ sequenze),
scartando le sequenze amminoacidiche omologhe a proteine note. Le strutture tridimensionali corrispondenti sono stati predette attraverso l’utilizzo del software Rosetta abinitio. Data la grande potenza di calcolo richiesta per questo progetto, Rosetta abinitio è stato adattato per essere usato in un sistema di calcolo parallelo condiviso: le cosidette GRID. Il porting di tale software è stata anche l’occasione per la creazione, attraverso i tool di sviluppo offetti dal GENIUS Grid Portal, di un’interfaccia grafica
6
che ne rendesse più familiare l’utilizzo in ambiente GRID. Le strutture proteiche generate sono state analizzate in termini di carica netta, nel contenuto di struttura secondaria, nel rapporto superficie/volume, composizione del nucleo idrofobico, ecc.Si è inoltre proceduto a sviluppare una metodica statistica che partendo dai risultati ottenuti dall’analisi delle proprietà strutturali, permetta di comprendere quali proprietà rendono una proteina ascrivibile al grande gruppo che forma le proteine naturali. Una siffatta infrastruttura è stata infine usata per affrontare problemi di complessità analoga come la predizione di un gran numero di proteine a funzione ignota da patogeni umani.
RISULTATI
La maggioranza delle NBPs, secondo il modello proprio di Rosetta, sono caratterizzate da una struttura tridimensionale compatta e da un peculiare alto contenuto di struttura secondaria. La struttura generale, la compattezza e la polarità di superficie sono paragonabili a quelli delle proteine naturali, suggerendone pertanto una stabilità e solubilità simili. Deviazioni significative si osservano nel contenuto relativo in α elica e struttura di tipo β e nella composizione del nucleo idrofobico. In generale è possibile affermare che le NBPs sembrano essere più ricche di struttura elicoidale e di residui aromatici rispetto alle proteine naturali. Non meno interessante e’ l’osservazione che un campione di NBPs, seppur ristretto, sembra essere caratterizzato dall’avere strutture simili a quelle di proteine esistenti. I risultati finora ottenuti applicando i protocolli sviluppati nella ricerca alle proteine putative del patogeno umano Streptococcus mutans evidenziano da un lato la maturità dell’infrastruttura stessa, dall’altro il grande vantaggio che un simile approccio può costituire nello studio di patogeni.
CONCLUSIONI
I risultati riportati in questo lavoro evidenziano come lo studio computazionale di "NBPs", anche se di natura prettamente predittiva, può fornire una panoramica utile sulle proprietà strutturali di base dei polipeptidi e sulle proprietà specifiche delle proteine naturali. Le NBPs appaiono strutturalmente molto simili alle proteine naturali, suggerendo che l’enorme spazio di sequenze NBPs possa essere sfruttato a fini biotecnologici. Una differenza importante tra NBPs e proteine naturali risiede nel diverso rapporto tra aminoacidi aromatici ed alifatici, in particolare nel minor
7
contenuto di amminoacidi aromatici osservati nelle proteine naturali. Queste informazioni possono essere molto utili nella progettazione di esperimenti di evoluzione diretta ed in generale negli studi di ingegneria proteica. Infine, questo studio dimostra che lo sfruttamento di infrastrutture GRID, per progetti di predizione massiva di strutture proteiche è fattibile; da cui è facile immaginare un suo eventuale utilizzo per la predizione della struttura del proteoma di batteri patogeni, per la selezione di nuovi target farmaceutici e negli studi di progettazione di nuove molecole di interesse biomedico.8
INDEXBACKGROUND 10
AIM OF THE WORK 16
TECHNICALISSUES 16
Amino acid sequences library generation 16 NBPs three-dimensional structure prediction 19
Module I – Input generation 19
Module II 19
Integration of Rosetta software on GRID environment 20 Three-dimentional structures analysis 21
Statistical analysis of the data 22
Reliability of three-dimensional protein structure prediction 22 software
Discrimination Tree 23
Streptococcus mutans proteins three-dimensional structure 24
prediction
Prediction of putative function 25
RESULTS 25
Integration of Rosetta Module II on the GILDA GRID 25 infrastructure
Integration on the GENIUS web portal 25
9
Comparative structural analysis 31
Comparison of Rosetta abinitio and Twostage results 36 Evolutionary Neural Network Approach 37 Implementation of the protocols to the case of real 40 proteomes: preliminary results
DISCUSSION 46
CONCLUSIONS 50
10
BACKGROUND
T
he first crystal structure of a macromolecule was solved by Kendrew in 1958, the myoglobin (Kendrew., et al. 1958). This event was a crucial step in biology: in that day, researchers, for the first time, were able to observe a protein in its real form. Fifty years later, however, the easy determination of a protein’s structure is considered an issue far from resolved. X-ray crystallography represents a very powerful way of investigation, however it has a very strong limitation: it requires a protein crystal. The techniques used for the crystallization of proteins often require significant economic and technical efforts. To obtain quality crystals apt to yield a high resolution structure it is required the availability of a highly concentrated solution of the protein of interest with a very high degree of purity. It must be also considered that crystallization experiments require long processing times, in other words is quite common that a modern crystallography laboratory spends on average months to solve a single protein structure. Considering that the number of protein coding sequences available in RefSeq Release 38 database (November 11, 2009, www.ncbi.nlm.nih.gov/RefSeq/) is equal to 9.325.214 from 9.166 different organisms and that the number of already solved protein structures is ~ 40.000 (NCBI MMDB - www.ncbi.nlm.nih.gov/sites/entrez?db=structure), it is easy to imagine that the progress of the knowledge about the structure of proteins needs new methods to obtain comparable results in a significantly shorter time. A response to this need is provided by software tools for the prediction of proteins three-dimensional structure. In the last fifteen years in various international laboratories many different software packages have been developed whose clear objective is to allow the prediction of the three-dimensional structure of a protein directly from its amino acid sequence without any prior knowledge of the evolutionary relationships linking the protein of interest to homologous with know structure. The main representatives of this family of programs are the “Rosetta abinitio software” (Bonneau et al., 2002, Rohl et al., 2004), the “i-Tasser web server” (Yang, 2008) and “BHAGEERATH web server” (Jayaram et al., 2006). These programs, albeit with limitations, are able to predict the protein fold in a much shorter time if they are compared to crystallography. From this last statement, a reader may be led to think that the structural study of proteins has finally found a fast solution. This is true only in part: the usefulness of these software tools is severely limited by their computational demanding requirements and, more complicated to solve, by11
the still limited scientific knowledge about the forces that govern the protein folding process. The predictive algorithms approach the simulation of the folding process essentially by simplifying the process through an approximation of the chemical-physical laws that govern protein folding. Moreover some of this algorithms, as the one implemented in Rosetta abinitio, combine this simulation procedures with an active search of structural properties on massive databases containing information derived from known protein structures. Computing power, storage space, and archiving of information and results represent a huge challenge even for modern computers. Historically, the first solution adopted to increase the computing power has been to create clusters of computers dedicated to the execution of large computations. A computer cluster is a group of linked computers, working together closely so that in many respects they form a single computer. The components of a cluster are commonly, but not always, connected to each other through fast local area networks. “Clusters are usually deployed to improve performance and/or availability over that of a single computer, while typically being much more cost-effective than single computers of comparable speed or availability” (Baker et al., 2001). The increase in computing power obtained with clusters, however, highlights the intrinsic limits of prediction software. The reliability of this software is good for predictions of proteins with amino acid sequence limited to 200-300 amino acids. Beyond this value the CPU time required for computation makes improper the use of ab initio software (several days of computation for each prediction). Nevertheless the protein structure predictions obtained in compliance with this limit clearly show the advantages of this “in silico” approach. The recent successes obtained by software packages such as Rosetta in CASP-5 (Critical Assessment of Structure Predictions) competitions confirm however that this kind of software tools can achieve a very high level of reliability (Chivian et al., 2003).Ab initio protein structure prediction methods allow to undertake the study of large protein sequence datasets with no homology with known natural proteins which can shed light on the nature of the protein folding process. In fact, simple calculations show that the number of known natural proteins is just a tiny fraction of all the theoretically possible sequences. On the other hand, considering random polypeptides of just 100 amino acids in length (the average length of natural proteins being 367 amino acids [Bairoch et al., 2004]), with the 20 natural amino acids co-monomers it is possible to obtain 10020 chemically different proteins. This is an astronomically large number which leads to the consideration that there is a tremendous amount
12
of information hidden in these unknown proteins. Previous studies in the field of the origin of life, have identified these sequences as "Never born proteins" or NBPs (Chiarabelli et al., 2006). These studies arised the fundamental question if the set of known natural proteins have particular features which make them eligible for selection, in terms, for example, of particular thermodynamic, kinetic or functional properties. One of the key features of natural protein sequences is their ability to fold and form a stable and well defined three-dimensional structure which in turn dictates their specific biological function (Branden et al., 1999). From this viewpoint, the study of the structural features of NBPs can help to answer the question if the natural protein sequences were selected during molecular evolution because they have unique properties and which are such properties (for instance a peculiar amino acid composition, hydrophobic/hydrophilic amino acids ratio, etc.). Attempts have been made in this direction, often using innovative experimental techniques such as phage display (Chiarabelli et al., 2006). These tests indicate that a computational approach can be extremely useful: software tools as Rosetta, if properly supported by adequate computing power, would allow to produce results otherwise obtainable only through years of experimental activity. In addition, a computational approach allows to evenly sample the protein sequences space in different regions far away enough from the ensemble of natural proteins. However, to obtain statistically significant results the size of the sequence data base to be analyzed must be sufficiently large (at least 104 to 105 sequences). This is a highly demanding problem from a computational viewpoint. In fact on a single CPU it would require years of computing time to predict the structure of such a large number of protein sequences. Fortunately, from a computational viewpoint this is an embarassingly parallel problem in that the same computation (i.e. the prediction of the three-dimensional structure of a protein sequence) must be repeated several times (i.e. on a large number of protein sequences). The use of a cluster of computers might provide a solution. However, the execution of thousands of calculations, even considering a scenario in which the code used has been heavily optimized for parallelization, requires years of computation; in addition in this same period the cluster would not be available to run other jobs. The ideal solution for this kind of problems is to use “grid computing” (GRID).GRID was developed in 1999 by Foster with the invention of the "Globus Kit" (a collection of libraries for writing highly parallel software). (Foster et al., 1999). Scientists active in the Physics of particles field had highlighted
13
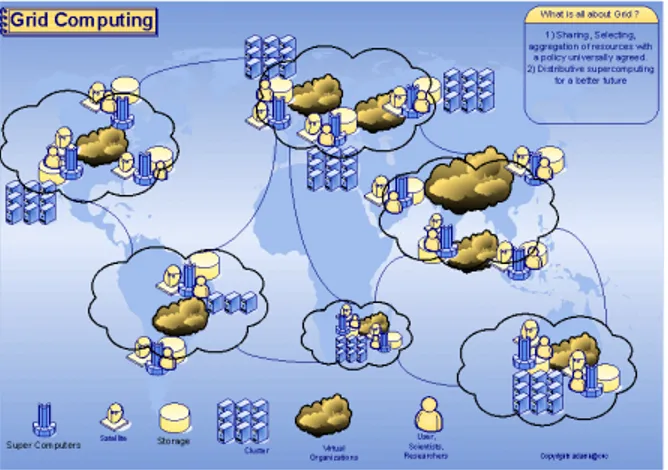
the need of an innovative approach to computation. In fact physicists needed to run simple calculations (execution time of the order of a few minutes), but in numbers equal to or greater than millions (an example being the thousands of trajectories which have to be calculated to describe the movement of individual sub-atomic particles in hadron collider experiments) (Brodkin., 2008). It is easy to understand that a single computer, however powerful, is not a good choice to tackle this problem. The GRID is based on thousands of computers connected together via Internet and managed by a dedicated software infrastructure: the middleware (Berman et al., 2003, Parvin et al., 2005). GRID is mainly formed by groups of computers called "computing elements" grouped in working nodes. The working nodes are the entities which physically perform the calculations. Data retention is handled by "storage elements" (computer with low computing power, but with very large capacity hard drives). Everything is managed by a “virtual organizations system” which underpin the management of GRID users, data traffic control and ensure privacy and safety (Chau-Hsu., 2006) (Figure 1).Although the GRID offers numerous benefits, it requires deep modifications of the software that has to be used on it. A shared environment on global scale is affected by inevitable data transmissions delays. For a software which is designed for processing sequential information this inconvenience must be intended as a lack of execution and computation failure. The
14
software which does not have been natively written for operating in a GRID environment must be adapted through the use of special developing tools. This process is called gridification (Mateos et al., 2007). With this aim several programming languages have been written; one of the most famous is the “Job Description Language” (JDL) (Tierney et al., 2001, Burke et al., 2008). The JDL is a scripting language, developed specifically for GRID, characterized by dedicated instructions for monitoring of computing resources, for allowing the jobs submission, for their identification and, not least, for checking the operator's credentials (Burke et al., 2008). JDL is however a very complex language, very powerful but not very easy to be handled by users who don’t have a strong informatics background. Important progress has been made with the introduction of appropriately programmed web interfaces, as the “Genius GRID Portal” (https://genius.ct.infn.it/, http://www.infn.it/, http://www.nice-italy.com/ ). These web portals can be seen as friendly graphical user interfaces for the utilization of GRID. The prediction of the three-dimensional structure of non natural proteins using Rosetta on a GRID environment, though yields only predictive results, allows to evenly sample the protein sequences space in different regions far away enough from the ensemble of natural proteins. The GRID infrastructure applied to the study of proteins may allow us to understand if natural protein sequences were selected during molecular evolution because they have unique physico-chemical properties or else they just represent a contingent subset of all the possible proteins with a stable and well defined fold. If the latter hypothesis were true, this would mean that the protein realm could be exploited to search for novel folds and functions of potential biotechnological and/or biomedical interest. The same protocols developed to predict the structure of an enormous number of random proteins can be very useful for the study of whole proteomes of biomedical interest. The genomes of several pathogens of medical interest are available in databases such as NCBI (NCBI genome - www.ncbi.nlm.nih.gov/projects/genome/). Frequently many pathogens proteins display little or no homology with better known proteins. In other cases the three-dimensional structure of pathogens proteins has been determined by structural genomics initiatives, but there is no information about their function. Very often there is no other information available apart15
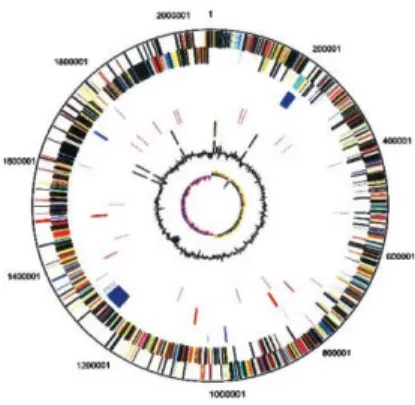
form the amino acid sequence. An example is the genome of the bacterium Streptococcus mutans (S. mutans): it contains 1.963 ORFs (open reading frames), 63% of which have been assigned putative functions based on sequences homology (Figure 2). S. mutans is the principal causative agent of human dental caries (tooth decay). Dental caries is one of the most common infectious diseases afflicting humans, and tends to remain untreated in many underdeveloped areas, leading to considerable suffering that is often alleviated only by the loss or extraction of the infected tooth (World Health Organization, Geneva 1994). Although 200–300 bacterial species have been found associated with dental plaque, only the presence of S. mutans has been consistently linked with the formation of human dental caries (Loesche., 1986). Additionally, S. mutans is occasionally associated with non-oral infections, principally sub-acute bacterial endocarditis (Hezenberg., 2000)” (Ajdić et al., 2002). Since 2002, year of the sequencing of S. mutans genome, up to now, out of the 63% of proteins with putative function a large part still retains this status (http://www.ncbi.nlm.nih.gov/sites/entrez?db=genome&cmd=Retrieve&do pt=Protein+Table&list_uids=263). Cases like this one highlight the need to have alternative methods for massive protein structures analyses.Figure 2. Circular representation of the S. mutans, strain UA159
genome. The outer two circles show the position of the probable ORFs on the complementary DNA strands. TheORFs have been color coded by functional category (from NCBI web site)
16
AIM OF THE WORKKnowledge of the three-dimensional structure of proteins is a fundamental prerequisite for the understanding of biological systems and for the development of new molecules of biological interest. Classical methods such as X-ray crystallography or NMR, while very powerful, require large investments of time and money. On the other hand, the development of software packages for ab initio prediction of protein structures has revolutionized the current scientific landscape. These software tools while very promising, however, show their limitations in speed of computation and consequently in their applicability, especially in scenarios involving high flow of data. The shared computing seems to be a good opportunity to enhance the capability of these specific software tools. Unexplored systems such as random protein sequences represent a huge pool of potential compounds for the development of new (macro)molecules, but the huge number of sequences that characterizes NBPs, however, does not allow to approach their study with existing techniques. The first objective of this research is to adapt existing software packages for the prediction of protein structure on shared computing environments. At the same time our aim is to make computing grids accessible to a public not specialized in computer sciences, through the creation of workplace-based graphical user interfaces. The realization of a platform able to handle a large flow of information finds its natural application in studies with high scientific impact such as the NBPs problem or the prediction of the entire proteome of bacterial pathogens.
TECHNICAL ISSUES
Amino acid sequences library generation
Random amino acid sequences (70 amino acids long) were generated using the utility RandomBLAST developed during this project (Evangelista et al., 2007). Briefly, RandomBLAST consists of two main modules: a pseudo random sequence generation module and a BLAST software (Altschul et al., 1990) interface module. The first module is a pseudo-random number generation wich uses the Mersenne Twister 19973 algorithm (Matsumoto et al., 1998) to generate pseudo-random numbers between 0 and 19. Random
17
numbers are translated in single character amino acid code using the conversion matrix show in Table 1 and then concatenated to reach the desired sequence length.Table 1. RandomBLAST random number to amino acid type conversion table
Each sequence generated is then given in input to the second RandomBLAST module, an interface to the blastall program which invokes the following command:
blastall -m 8 -p BLASTp -d database -b 1;
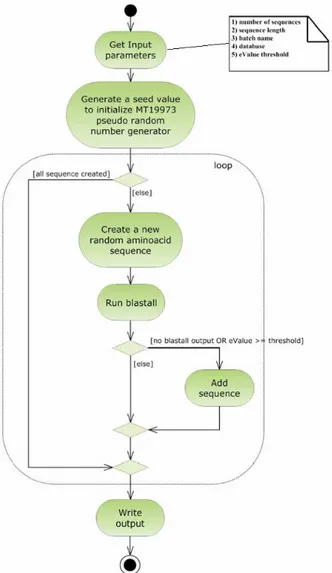
where database in our case stands for the NR database, and the parameters –m 8 and –b 1 indicate the alignment format (tabular form) and the number of sequences to be returned (just the first hit), respectively. BLASTall output is then retrieved by RandomBLAST and the Evalue extracted from it. If the Evalue is greater than or equals the threshold chosen by the user, the sequence is added to the output file. Note that in this case only the sequences that do not display significant similarity to any protein sequence present in the database are considered valid, so that, contrary to the normal BLAST usage, valid sequences are those displaying an Evalue higher than the threshold, set to a value of 1 (Karlin et al., 1990) (Figure 3). The total number of NBPs sequences generated was 20496.
18
Figure 3. Activity diagram showing the RandomBLAST workflow. The inset details the RandomBLAST input parameters
19
NBPs three-dimensional structure predictionNBPs three-dimensional structures have been predicted using Rosetta abinitio software. Rosetta abinitio is an ab initio protein structure prediction software which is based on the assumption that in a polypeptide chain local interactions bias the conformation of sequence fragments, while global interactions determine the three-dimensional structure with minimal energy which is also compatible with the local biases (Rohl et al., 2004). To derive the local sequence-structure relationships for a given amino acid sequence (the query sequence) Rosetta abinitio uses the Protein Data Bank (Berman et al., 2002) to extract the distribution of conformations adopted by short segments in known structures. The latter is taken as an approximation of the distribution adopted by the query sequence segments during the folding process (Rhol et al., 2004).
In detail, Rosetta workflow can be divided into two modules:
Module I - Input generation - The query sequence is divided in fragments
of 3 and 9 amino acids. The software extracts from the data base of protein structures the distribution of three-dimensional structures adopted by these fragments, based on their specific sequence. For each query sequence a fragments data base is derived which contains all the possible local structures adopted by each fragment of the entire sequence. The procedure for input generation is rather complex due to the many dependencies of module I. In fact, to be executed the first Rosetta abinitio module needs the output generated by the programs BLAST (Altschul et al., 1990) and PSIPRED (McGuffin et al., 2000) in addition to the non redundant NCBI protein sequence database (Wheeler et al., 2005). On the other hand this procedure is computationally inexpensive (10 min of CPU time on a Pentium IV 3,2 GHz). Thus it has been chosen to generate the fragments database locally with a Perl script that automatizes the procedure for a large dataset of query sequences. The script retrieves query sequences from the random sequence database in FASTA format and executes Rosetta abinitio module I creating an input folder with all the files needed for the execution of Rosetta abinitio module II.
Module II - Ab initio protein structure prediction – Using the derived fragments database and the PSIPRED secondary structure prediction generated by module I for each query sequence, the sets of fragments are assembled in a high number of different combinations by a Monte Carlo procedure by Rosetta abinitio module II. The resulting structures are then subjected to an energy minimization procedure using a semi-empirical force
20
field (Rohl et al., 2004). The principal non-local interactions considered by the software are hydrophobic interactions, electrostatic interactions, main chain hydrogen bonds and excluded volume. The structures compatible with both local biases and non-local interactions are ranked according to their total energy resulting from the minimization procedure. A single run with just the lowest energy structure as output takes approx. 10-40 min of CPU time, for a 70 amino acids long NBP and depending on the degree of refinement of the structure.Integration of Rosetta software on GRID enviroment
Any software to be used in a GRID environment must be prepared through a process called "Gridification”. The porting from a local working environment to a shared system requires an optimization process to operate in such an environment. Operations such as managing system calls to runtime libraries, management of I/O and memory usage must be adapted to the particolar requirements of a shared enviroment (processing unit and storage unit tipically located in different geographic areas). In a system GRID all these issues are solved by one elegant way: the program “believes” to be in a local system and all the necessary management calls are entrusted by a virtual operating system that is responsible for coordination (shared mainframe). All these aspects are managed through the use of a special programming language: Job Description Language (JDL)
(www.grid.org.tr/servisler/dokumanlar/DataGrid-JDL-HowTo.pdf). Using
ad hoc JDL files that describe necessary inputs, outputs are then generated on the resources required by the software. A typical example of a JDL file is as follows:
Executable = "/ bin / echo"; Arguments = "Hello World"; StdOutput = "message.txt"; StdError = "stderror";
OutputSandbox = ( "message.txt", "stderror"); Requirements = other.LRMS;
Type == "BPU"; Rank = other.FreeCPUs;
where “Executable” is the name of the binary file of the software ported on GRID sistem, “Arguments” is the name of eventual flags required by the binary for its execution, “StdOutput” is the name of the output file, “StdError” is an optional file where are written the error informations,
21
“OutputSandbox” is a list with the name and the number of output files produced at the end of one computation (generally one output file and one error log file), “Requirements” is a string for the hardware requirements (RAM memory amount, Hard Drive space, ecc), “BPU” is the type of CPU used by the binary file and “Rank” specifies the number of CPU necessary for job submission. In the example, the program requires a site with a generic Basic Processing Unit (BPU) tipically a x86 CPU. In this way the job will be submitted only on resources that satisfy this condition. If there is more than one resource satisfying the required conditions, then the rank is used to determine which is the most appropriate and then the one to which the job is submitted (higher values correspond to more resources suitable). JDL is based on Condor libraries (www.bo.infn.it ). To check the results of the matching resource without actually submitting a job, the edg-job-list-match command can be used. This command returns an ordered list of resources, in which the most appropriate one appears at the top.A JDL file was created to run Rosetta abinitio Module II executable and proceed with workflow execution on the EUChinaGRID (www.euchinagrid.org/) GRID
working nodes which use the gLite middleware
(http://glite.web.cern.ch/glite/).
Three-dimensional structures analysis
The analysis of the physico-chemical properties of the predicted protein structures was carried out using a collection of different tools. Given the high number of NBPs to be analysed, for each tool the analysis procedure was automated using ad hoc Perl scripts. In detail, the programs used were MSMS (Scanner et al., 1996), for molecular volume calculation, SURFace Algorithms (Sridharan et al., 1992), for surface properties analysis (overall molecular surface, per residue solvent accessibility), Freqaa (Tekaia et al., 2002), for amino acid composition analysis and DSSP (Kabsch et al., 1983) for secondary structure content analysis. Surface hydrophobicity was calculated as the ratio between the solvent exposed surface of hydrophobic amino acids and the total solvent exposed surface, both calculated using SURFace Algorithms (Sridharan et al., 1992). To compare the properties of NBPs structures to those of naturally occurring proteins structures, a dataset of natural proteins of length comparable to that of NBPs (55 to 95 amino acids long sequences as compared to NBPs 70 amino acids long sequences) was derived from the Protein Data Bank (Berman et al., 2000). The dataset was cleaned up eliminating protein fragments and proteins whose fold is determined by macromolecular complexes formation (tipically ribosomal proteins). The final natural proteins dataset was formed by 866 proteins.
22
Statistical analysis of the dataA first exploratory data analysis has been developed to see if there were any significant differences in the structure observed in the two data-sets. Initially few outliers in the data that could affect the analyses were removed, generating a dataset of 18465 NBPs and a dataset of 839 natural proteins. For these sets measures of location, index of dispersions, correlations matrix were derived, and box-plots and scatterplots were built to compare the two data sets. This study was performed on different structure-related variables, which include: volume, surface, surface/volume ratio, net charge, secondary structure content, and surface hydrophobicity. Tests on the Gaussian distribution of the variables led to reject the hypothesis of Gaussianity for the majority of the variables investigated. With a test significance level of 0.05 almost all the variables result with statistically different mean and variance for the two data-sets. The analysis has been also conducted on smaller data-sets of comparable size: a random sample of 1000 observations has been drawn from NBPs dataset and comparisons have been developed. The two analyses generated similar conclusions, presented in the Results section. The statistical software used to analyse the data was R (http://www.R-project.org).
Reliability of three-dimensional protein structure prediction software In a context of international cooperation related to the European Commission funded project EUChinaGRID and with the aim of testing the reliability of three-dimensional protein structure prediction software when used in an "exotic" context as the structures determination of random proteins, a close cooperation has been established with the research group of Prof. Irena Roterman of the Jagellonian University of Krakow (Poland). The structure of the random sequences library generated in the first phase of the research were predicted through an independent software and based on an alternative approach to that of Rosetta abinitio, currently in development by their group. The three-dimensional structures of NBPs were predicted with their “Fuzzy oil drop” method (Twostage program) (Brylinsk et al., 2006; Brylinski et al., 2006b). The resultant predictions were compared with the Rosetta abinitio output. The RMSD was calculated only for the backbone atoms. Couples with RMSD less than 6.80 Å were subjected to energy minimization using the software CHARMM (Brooks et al., 1083) in order to reduce the possible clashes between atoms introduced by the prediction software. The RMSD was recalculated for the resulting structure. The structure alignment and its graphic representation were obtained through the use of the CE protein structures alignment software (Shindyalov et al.,
23
1998).Discrimination Tree
In order to compare properties and functionalities of the random proteins with respect to natural proteins a classification tree was generated. The analysis has been conducted comparing 10 different variables: net charge, volume, surface, β turn, α helix, β strand, % α helix, % β turn, % of secondary structure content and surface hydrophobicity. A first description of the data by evaluating measures of location, dispersion indices, correlations matrices, and box-plots and scatterplots in order to evaluate differences and similarities of the two data sets was developed. With a significance level of 0.05 almost all the variables involved exhibited statistically different means and variances, and tests on the Gaussian distribution of the variables lead to reject the hypothesis of Gaussianity for the majority of the variables investigated. This exploratory data analysis shows significant differences in the structural components of the two data sets. The difference in mean and variance in the two groups of proteins, if highlighting the diversity of the two groups, on the other way prevents the study of the differences through the classical statistical methods. Especially the lack of Gaussianity makes complicated and methodologically incorrect the application of the common linear regression models which are conventionally applied to the study of biological systems. In order to discover and understand the basis of these differences a classification procedure was built by evolving populations of feedforward neural networks. We chose a class of multi-layers neural networks (Haykin et al., 2009, De March et al., 2009) and built a genetic algorithm (De Jong 2006) to evolve the best classification rule.
More specifically, a first random population of networks was generated with the topology of a 2-hidden layers neural networks. This population was formally described as a set of sequences with dichotomic variables (each sequence was a vector of zeros - ones values). Each element of the sequence describes the presence or the absence of a particular structural component of a protein. The topology of these networks, involving different variable compositions, was selected in a random way (first generation of networks), and the response of each network was derived with a two class structure: natural and synthetic proteins. Then, a genetic algorithm was built to evolve the population of networks in a number of generations with the aim of identifying a precise classification rule. Then the response of each network was evaluated deriving a net misclassification rate by 10-fold cross validation procedure: the sequences with smaller values were identified as
24
the more promising solutions. Then the classical genetic operators, such as natural selection, crossover and mutation was applied to the network population, in order to achieve the next generation of promising sequences. These genetic operators are needed to allow the proper learning, by algorithm, of the variability of the variables studied with the neural network. This process is repeated for a fixed number of times or until convergence is reached (end of the learning phase).Streptococcus mutans proteins three-dimensional structure prediction
To evaluate the usefulness of the structure prediction computing platform developed in the study of bacterial proteomes, a feasibility study was carried out on the proteome of the human pathogen S. mutans. S. mutans protein sequences were retrieved from the NCBI web site, project genome section
(http://www.ncbi.nlm.nih.gov/sites/entrez?db=genome&cmd
=Retrieve&dopt=Protein+Table&list_uids=263). The entire S. mutans
proteome as of 20 march 2009 has approximately 800 protein noted as putative proteins for which do not exist three-dimensional structures or information of homology with known proteins. From this subset of putative proteins a reduced library was extracted consisting of proteins with amino acid sequence length between 25 and 200. During the development of this work a new version of the Rosetta software (Rosetta 2.0) has been released. This version is basically a rewrite of the original Fortran code in C++ programming language. Rosetta 2.0 is characterized by having a better performance and a greater ease of use. The new version differs from the first also for the integration of a module for clustering of the predicted structures. Through this procedure it is possible to isolate from a large set of intermediate models, the prediction that best describes all the predictions produced (in other words “the most similar between the group”). It was therefore decided to use the new version to conduct the prediction of the three dimensional structure of S. mutans proteins. To maximize the reliability of the used protocol, different calculations were carried out on samples of natural proteins whose structure was already present in the NCBI database. These preliminary tests showed that to obtain a reliable prediction (global variation compared to crystal structure with average RMSD value less than 3Å) about 990 intermediate structures are required. This value was chosen as the best compromise between computing time and similarity of the proposed model. The protocol used for the prediction of S. mutans proteins therefore takes the following form:
25
1) generation of fragments via the Rosetta fragment module;2) prediction of 990 intermediate models;
3) clustering of the structures and extraction of the ideal model; 4) refinement of the model.
The computational time needed for the prediction of a single structure with this protocol is of the order of about a week per structure.
Prediction of putative function
The assignment of a putative function was conducted through the use of the Dali web server, which allows the comparison of the predicted structures with all the protein structures present in the Protein Data Bank and the retrieval of protein structures which display significant structural similarity, and hence similar function, with the input structure (Holm et al., 2008). RESULTS
Integration of Rosetta Module II on the GILDA GRID infrastructure
Single job execution on Grid Infrastructure - A single run of Rosetta
abinitio Module II consists of two different phases. In the first phase an initial model of the protein structure is generated using the fragment libraries and the PSIPRED secondary structure prediction. The initial model is then used as input for the second phase in which it will be idealised. A shell script has been prepared which registers the program executable (pFold.lnx) and the required input files (fragment libraries and secondary structure prediction file) on the LFC catalog, calls the Rosetta abinitio Module II executable and proceeds with workflow execution. A JDL file was created to run the application on the EuChinaGrid working nodes which use the gLite middleware (gLite middleware - http://glite.web.cern.ch/glite/).
Integration on the GENIUS web portal - A key issue to attract the biology
community towards the exploiting of the GRID paradigm is to overcome the difficulties connected with the use of the grid middleware by users without a strong background in informatics. This is the main goal that has to be achieved in order to disseminate the use of GRID services by biology applications. To achieve this goal and allow a wide biologists community to run the software using a user friendly interface, Rosetta abinitio application
26
has been integrated on the GENIUS (Grid Enabled web eNvironment for site Independent User job Submission) GRID Portal (GENIUS Portal – https://genius.ct.infn.it/), a portal developed by a collaboration between the italian INFN Grid Project (INFN Grid Project – http://www.infn.it/ ) and the italian web technology company Nice (Nice – http://www.nice-italy.com/). Thanks to this GRID portal, non-expert users can access a GRID infrastructure, execute and monitor Rosetta abinitio application only using a conventional web browser. All the complexity of the underlying GRID infrastructure is in fact completely hidden by GENIUS to the end user. In our context, given the huge number of NBPs sequences to be simulated, an automatic procedure for the generation of parametric JDL files has been set up on the GENIUS Grid Portal. With this procedure, exploiting the features introduced by the last release of the gLite middleware, users can create and submit parametric jobs to the GRID. Each submitted job independently performs a prediction of the protein structure. Hereafter is described in detail the workflow adopted to run Rosetta abinitio application on GENIUS. After the user has correctly initialized his personal credentials on a MyProxy Server (security check), he can connect to the GENIUS portal and start to set up the attributes of the parametric JDL file that will be created “on the fly” and then submitted to the GRID. First the user specifies the number of runs, equivalent to the number of amino acid sequences to be simulated (Figure 4A). Then, the user specifies the working directory, the name of the shell script (Rosetta abinitio executable) to be executed on a GRID resource, loads a .tar.gz input file for each query sequence (containing the fragment libraries and the PSIPRED output file) and specifies the output files (initial and refined model coordinates) in parametric form (Figure 4B). The parametric JDL file is then automatically generated and visualised in order to be inspected by the user and submitted (Figure 4C).27
Figure 4. Screenshots of the GENIUS GRID portal showing services for the specification of the number of structure
predictions to run (top panel), of the input and output files (middle panel) and for the inspection of the parametric JDL file (bottom panel) (from Minervini et al., 2007).
28
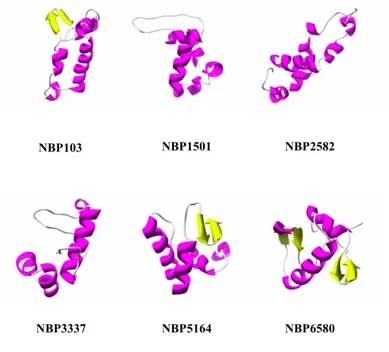
The status of the parametric job as well as the status of individual runs of the same job can be also checked from within the GENIUS portal. When the prediction is done it is also possible, using the portal, to inspect the output produced in graphics form. In addition, in order to allow the user to analyse the predicted NBP structural model, the JMOL Java applet (http://www.jmol.org/) has been embedded into the GENIUS portal. Figure 5 shows some, randomly chosen, examples of the approx. 2×10⁴ NBPsthree-dimensional structures predicted using Rosetta on grid (Rohl et al., 2004).
Figure 5. Schematic representation of the three-dimensional structure of randomly chosen NBPs, α helices are coloured in
magenta, β strands in yellow (from Minervini et al., 2009).
Amino acid composition analysis
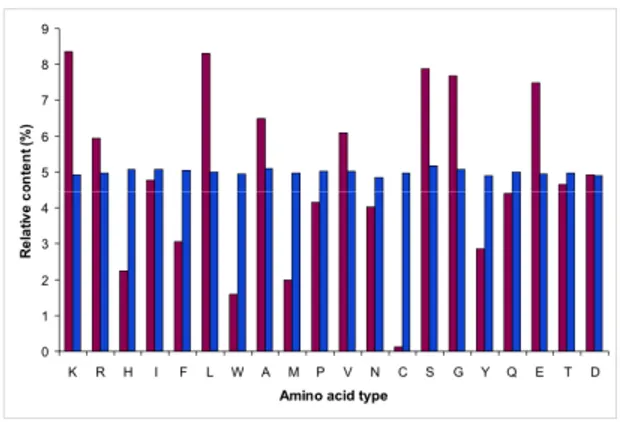
Figure 6 shows the amino acid composition of natural and random protein sequences datasets. For random proteins dataset, each amino acid relative
29
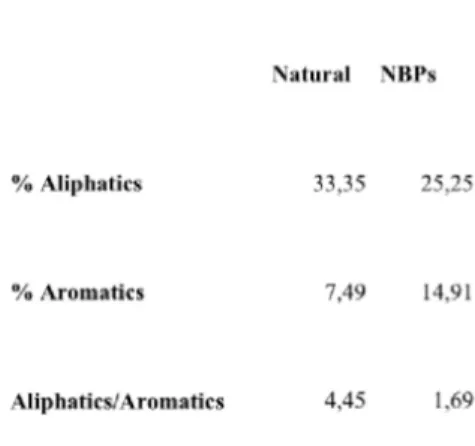
content is about 5%, an obvious consequence of the random nature of these amino acid sequences. Nonetheless, interesting differences are observed when random sequences composition is compared to that of natural proteins. In detail, for the natural proteins dataset five amino acids are significantly over represented: Lys (8.35%), Leu (8.30%), Ser (7.88%), Gly (7.69%) and Glu (7.48%), while three amino acids are under represented: Trp (1,58%), Met (1,98%) and Cys (0,13%) (Figure 6). These differences are not a peculiar characteristic of the subset of natural proteins chosen in this work. In fact similar amino acid composition is observed for the UniProt dataset containing all the known protein sequences (Bairoch et al., 2004) (Figure 6), indicating that the natural proteins subset used in this work is representative of all natural proteins, at least as far as amino acid composition is concerned. Notable differences are observed for Lys and Cys residues which display the highest and lowest percentage in the natural dataset. The former finding can be explained considering that a consistent number of natural proteins with a length in the 55-95 residues range display nucleic acid binding activity and thus a basic character. Cys residues percentage is less straightforward to explain even though it is probably connected to the high reactivity of this amino acid whose presence in natural proteins is tightly evolutionary controlled. Turning to the random proteins dataset, these display a significant excess of aromatic amino acids and a strikingly lower content in Leu, as also evidenced by the low ratio between aliphatics and aromatics as compared to the natural dataset (Table 2).30
Figure 6. Amino acid composition of NBPs and natural proteins A) Comparison between the amino acid composition of NBPs
(blue bars) and that of selected natural proteins of comparable length (purple bars; see Methods). B) Comparison between the amino acid composition of the natural proteins subset used in this work (purple bars) and that of the whole UniProt dataset (Bairoch et al., 2004) (green bars) (from Minervini et al., 2009).
31
Table 2. Hydrophobic amino acids relative content of natural proteins and NBPs (from Minervini et al., 2009).
Comparative structural analysis
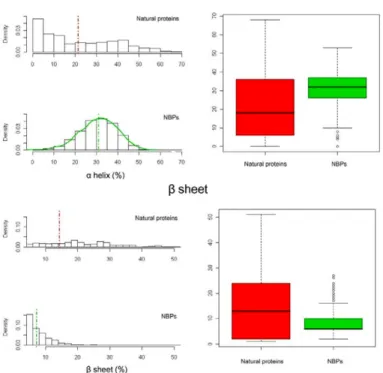
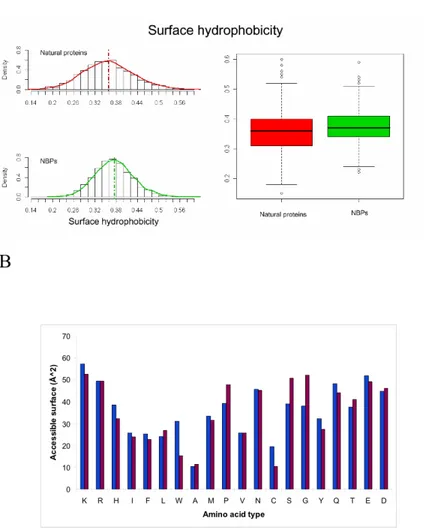
Several structure-related parameters (volume, surface, surface/volume ratio, secondary structure content, and surface hydrophobicity) have been computed for the two datasets in order to compare their statistical and structural properties (Table 3). As a general consideration, the average value of the analysed structural parameters and the corresponding standard deviation values are statistically different between NBPs and natural proteins with a significance level of 0.05. In particular natural proteins are characterised by a higher standard deviation whereas NBPs seem to be narrowly distributed around the experimental average. Despite the differences observed in amino acid composition between the two datasets, the structural analysis of NBPs reveals that these are in most cases characterized by a well ordered structure. In fact, secondary structure content of NBPs appears to be comparable to that of natural proteins, with an average total secondary structure content (including α helix, β sheet and β turn) slightly higher than 60% for both datasets (Table 3). However, NBPs appear to be less compact than natural proteins, as evidenced by the higher average volume (9294.0 Å and 8630.0 Å for NBPs and natural proteins, respectively, Table 3) and lower surface/volume ratio (0.43 Å and 0.46 Å for NBPs and natural proteins, respectively, Table 3) (Figure 7A). Interestingly, NBPs display a significantly higher α helix content, and a corresponding lower β sheet content, with respect to natural proteins (Figure 7B), in the absence of any clear correlation between amino acid composition and amino acids propensities for formation of a specific
32
secondary structure. Surface hydrophobicity of the two datasets has also been calculated and results to be very similar (Figure 8A), indicating a predicted water solubility of NBPs structures comparable to that of natural proteins. Interestingly, comparison of the amino acid composition of the two datasets with data relative to solvent accessibility of different amino acids types highlights how aromatic amino acids are more represented in the hydrophobic core of NBPs with respect to natural proteins. As an example, Trp residues are approx. three times more frequent in NBPs with respect to natural proteins (Figure 6A). However, solvent accessible surface of NBPs Trp residues is, on average, only twice that of natural proteins Trp residues (Figure 8B), indicating that a higher proportion of Trp residues is buried within the hydrophobic core of NBPs. Similar considerations apply to Phe and Tyr residues (compare Figures 6A and 8B), leading to the conclusion that aromatic residues contribute to NBPs hydrophobic core formation to a higher degree than in natural proteins.Table 3. Average values of the structure-related parameters calculated for natural proteins and NBPs (from Minervini et al.,
34
Figure 7. Structural properties of NBPs and natural proteins A) Surface, volume and surface/volume ratio distribution for
NBPs and natural proteins; B) Secondary structure content of NBPs and natural proteins. In this and in the following figure, boxplots are shown in the right panels (from Minervini et al., 2009)
35
Figure 8. Surface properties of NBPs and natural proteins. A) Surface hydrophobicity of NBPs and natural proteins; B) Amino
36
Comparison of Rosetta abinitio and Twostage resultsIn the framework of an international collaboration within the EU funded EUChinaGRID project (http://www.euchinagrid.org), NBPs structures predicted with Rosetta abinitio were compared to those predicted with a different software based on the “fuzzy oil drop” method (Twostage program) (Brylinski et al., 2006; Brylinski et al., 2006b). Table 4 clearly shows that RMSD values obtained are never lower than 5.86 Å which represents the best value produced by the pair of predictions for the NBPs sequence 7033. Although this is not an exciting result, it is important in that highlights the challenging conditions in which the two software packages were tested. For both methods, the predicted structure is formed largely by alpha helices (Figure 9, F1d and Figure 9, F1e). The related topology maps (Figure 9, F1a and Figure 9, F1b) show that both predictions are characterized by the presence in the C-terminus region of two segments of alpha helix (Rosetta, residues 43-50 and 51-61; Twostage, 43-49 and 62-58), the first of which can be viewed as the central axis of the molecule. Around this central axis are located two other alpha-helical regions interspersed by short loops, which seem to embrace the center with the shape of a ring (Rosetta, 20-28 and 29-36; Twostage, 21-29 and 35-39). In total disagreement however, is the prediction for the N-terminus region for which Rosetta predicts the presence of a short beta-sheet while Twostage identifies a further stretch of alpha helix (Rosetta, 5-2 and 8-12; Twostage, 9 -14). The overlap of the predicted structures relative to sequence number 7033 (Figure 9, F1f), illustrates some agreement between the two predictions. The structural alignment (Figure 9, F1c) clearly shows the presence of a good structural similarity and if the region of disagreement at the N-terminus is excluded, the calculated RMSD value decreases to ~4.39 Å, reinforcing the agreement between the two methods.
37
Figure 9. Schematic representation of topology maps, structural alignment and graphics representation of predicted structures
for sequence n° 7033. F1a and F1b, topology maps; F1c, structural alignment between structures predicted with two different methods; F1d and F1e, structures obtained with Rosetta and Twostage, respectively; F1f, superimposition of the two proposed predictions (from Minervini et al., 2008).
Evolutionary Neural Network Approach
The application of an Evolutionary Neural Network Approach (ENNA) to classify random versus natural protein sequences yielded interesting results. In figure 10 is reported, for 10 generations, the best sequence response value (black line) and mean sequence response value (blue line) in terms of misclassification rate, and the number of times in which each sequence element is selected in the last generation. More specifically in Figure 10, is showed how the error rate of discrimination between the two groups decreases dramatically at the tenth generation. This indicates that the algorithm developed is able, after ten cycles of learning, to distinguish the two groups with good confidence. Figure 10 also shows the average rate of correct classification obtained in comparison with a single sequence of known source which is used as benchmarck. The results show that when using a particular set of structural components, the method used is able to classify the proteins in a quite precise way. The best set of selected
38
variables provides a classification accuracy equal to 89%: by evaluating the properties related to these variables it is thus possible to identify a natural protein from a random one and predict which protein structures potentially display specific and relevant functionalities. Furthermore a high degree of reliability of the components identified is observed, because of the high probability with which they are selected (as shown in figures 10b and 11). The small number of the selected structural components is also a relevant result and can be a very useful insight for protein engineering. Comparison with the classification tree approach (Hastie et al., 2009) shows the better performance of the evolutionary approach. The decision tree was built by the C4.5 algorithm using 10-fold cross validation and fixing to 10 the minimum number of observations per leaf. The decision tree has a classification accuracy of 90%.Figure 10. a) Best and mean misclassification rates in 10 generations; b) Number of times in which each variable is selected in
the last generation.
The classification tree has confirmed that is possible to distinguish natural proteins from NBP. Analysis of the variables that best discriminate the two groups shows that the set of natural proteins is significantly different for the variables volume, surface, helix and strand (Figure 11). It is very interesting to note that a small group of NBPs (approximately 300 proteins) has characteristics consistent with the average properties of natural proteins.
39
This group whose members were identified as "pseudo-natural proteins” is composed of random proteins which are identified by the classification algorithm as natural proteins. On this restricted set of pseudo-natural proteins the protocols developed for the study of S. mutans proteins are currently being applied. The first encouraging results (under validation) show that these particular NBPs not only exhibit chemical-physical properties comparable to those of natural proteins, but also general fold similar to proteins that actually exist in nature as is the case of protein_263 showed in Figure 12.Figure 11. Variables that best discriminate the NBPs group from the natural proteins group; vol stands for volume, surf for
40
Figure 12. Structural superimposition between protein_263 (turquoise) and cristal structure of a core domain of stomatin from
Pyrococcus horikoshii (purple, PDB code 3BK6).
Implementation of the protocols to the case of real proteomes: preliminary results
The usefulness of the structure prediction computing platform developed in this thesis for the study of bacterial proteomes was tested using the human pathogen S. mutans as a test case. The three dimensional structure of about 200 S. mutans proteins was predicted, which represent 10% of the entire proteome of the bacterium. This value takes on a greater significance when we consider that it represents about 30% of the proteins annotated as putative proteins in the bacterial genome. All predicted models are currently under verification and the assignment of putative functions to the proteins is
41
currently underway. To verify the reliability of the described approach, the structure of 5 additional proteins of S. mutans, for which is available the experimentally determined three-dimensional structure, have been predicted. All the predicted models show a good degree of agreement with the relative crystal structure and the average RMSD value is less than 3Å An example of this preparatory predictions is showed in Figure 13. The model obtained for the DnaD-like replication protein (PDB code 2ZC2, RMSD 2,20 Å) well explains the level of accuracy obtainable.Figure 13. Superimposition between the crystal structure of the DNAD-like replication protein from Streptococcus mutans
UA159 (cyan, PDB code 2ZC2) and the model obtained with Rosetta abinitio (RMSD 2,20 Å).
For the same group was also tested the accurancy of the function prediction offered by the utilization of DALI web server when it is used on a theoretical model. In figure 14 is possible to see how the abinitio model of 2ZC2 is well recognized as DNA-D domain.
42
Figure 14. The results N°1-16 show how the correct function recognition can be obtained with DALI web server even when it
is applied to theoretical models
As an example of the results being obtained on S. mutans proteins with unknown structure and only putative function, the prediction of the structure of SMU.28 is shown in figure 15. SMU.28 is assigned to be a multidrug ABC transporter on the basis of its sequence homology with the protein Sav1866from Staphylococcus aureus(PDB code 2ONJ). The comparison between the model obtained for SMU.28 and the crystal structure of Sav1866 shows that strong structural correlation exists (Figure 15). In this case, the assignment of function obtained by structural homology by DALI server, confirms the putative function assigned to the hypothetical protein SMU.28 (Figure 16).
43
Figure 15. Superimposition between the crystal structure of the multidrug ABC transporter Sav1866 from Staphylococcus
44
45
An encouraging result for the validation of this approach is provided also by a publication appeared during the development of this research in which it is presented the crystal structure of the putative S. mutans protein SMU.440 obtained with standard protocols (Nan et al., 2009). The figures 17A and 17B show the superimposition of the crystal structure 3IJT and the model predicted using the protocols developed in this researchFigure 17.Superimposition between the crystal structure of the putative protein SMU.440 (cyan) from S. mutans (PDB code 3IJT) and the model obtained with the protocols developed in this research (green). A) front view; B) rear view.
46
DISCUSSIONMeaningful interpretation of the results described in the present work rely heavily on the validity of the structure predictions obtained using Rosetta. However, the Rosetta model has been shown to perform fairly well and even yield near-atomic resolution structures in a number of cases (Bradley et al., 2005). Results shown in Figure 18 for a sample of natural proteins confirm that Rosetta predictions are in most cases fairly accurate in terms of overall fold, secondary structure content and topology. In some cases the agreement between the experimental and predicted structures is even surprising, as is the case of the predicted structure of the protein nusa (indicated in figure 4 with the PDB code 1UL9) which displays an overall backbone RMSD of only 1.74 Å with respect to the experimentally determined structure.
47
Figure 18.Sample natural proteins predicted three-dimensionalstructures. Schematic representation of the experimental (left panel) and predicted (right panel) three-dimensional structures of randomly chosen natural proteins. α helices are coloured in magenta, β strands in yellow. Protein Data Bank identification codes are indicated on the left for reference. (from Minervini et al., 2009).