UNTvTRSmA
DEGLI
STUDI
»TMTSSINA
DrrARrn{ENro
DrMnorcnva Cr,nnca
E SrnnrmnNTALEDorronaro
nrRrcnncl
nv§crnxzn
BronnrDrcIIECr,nucm
rcSrunrurxtnr,r
Coordinatore: Ch.mo Prof. F. Squadrito)OCfl
CICLONON.INYASTVE
MYOCARDIAL WORK II\DICES
BY
PRESSURE.STRAIN
LOOPS :A
NEW TOOL TO
STUDY
LEFT VENTRICLE PERTORMANCE
Tesi di Dottorato di:
Dott.ssa Roberta MANGANARO
/'\
(i
\7'C rr. m o
lio
f,^S'ripi qir,4'- \
\
-/
/i'
--
l''-,I§,
l1 t SD MED 11 Anno Accademic o 2018 12019A mio padre e mia madre
The present PhD thesis is the result of my research activity conducted mainly at the Cardiology Department of the CHU Sart Tilman, Liège (Belgium), under the supervision of the Head of the Department, Prof. P. Lancellotti.
Index
Introduction………page 1
Aims………page 4
Papers
Paper 1………page 5
Paper 2………page 19
Paper 3………page 36
Discussion………page 55
References………...page 58
Introduction
The assessment of left ventricle (LV) systolic function is an essential part of every echocardiographic exam. For this purpose, the main parameter usually evaluated in clinical practice is LV ejection fraction (EF). However, its value has been widely questioned during the past 15 to 10 years because of intrinsic limitations, (1) especially for identifying subtle LV systolic dysfunction. More recently, global longitudinal strain (GLS) was introduced as a reliable tool for studying LV mechanics, allowing to overcome EF limitations. (2-5) Although GLS can identify subtle abnormalities in LV systolic function at an early stage, when EF is still in normal ranges, it suffers from being load-dependent. An increase in afterload may decrease GLS, leading to misinterpretation of LV contractile function.
An alternative approach is the estimation of regional myocardial work which is the result of both deformation and opposing force. LV pressure-volume analysis incorporates load and, as shown in experimental studies, LV pressure-volume area reflects stroke work as well as myocardial oxygen consumption. (6-7) Figure 1A illustrates the estimation of LV work by LV pressure-volume area. Similarly, it has been demonstrated that LV work can be obtained by LV pressure-strain curve (Figure 1B).
Figure 1. (A) Schematic representation of LV pressure-volume relations: the pressure-volume loop
area indicated by the pressure-volume area (PVA) represents external myocardial work (EW), while the triangular area on the left represents potential energy (PE). (B) LV pressure-strain loop from a patient with cardiomyopathy: comparison between LV pressure measured by high-fidelity micromanometer and LV pressure estimated by echocardiography. The area of the LV pressure-strain loop reflects segmental work. P, pressure; V, volume; V0, unstressed volume; ESPVR, end-systolic pressure-volume relationship; EDPVR, end-diastolic pressure-volume relationship. Adapted from Boe et al. Eur Heart J Cardiovasc Imaging 2018.
Work assessment was previously dependent on the use of invasive pressure measurements, so it was not feasible in clinical routine. Russel et al. recently validated a non-invasive method for myocardial work (MW) estimation by pressure-strain loops (PSLs). (8) According to this method, MW is the result of myocardial strain by speckle tracking echocardiography ( STE) and non-invasively estimated LV pressure (LVP). In particular, Russel et al. obtained an empiric reference curve for LVP by collecting invasive LVP data from a number of patients during various haemodynamic conditions. (8) The curves were normalized by stretching or compressing the LVP curves along the time and pressure axes to produce a standard LVP curve. Patient-specific non-invasive LVP curve can be obtained by the empiric reference LVP curve after measuring valve events times (mitral valve closure, aortic valve opening, aortic valve closure, mitral valve opening) by echocardiography and adjusting the standard LVP curve to the duration
of isovolumic contraction, LV ejection, and isovolumic relaxation. Moreover, the systolic brachial cuff pressure is used as a substitute of peak LVP and the LVP curve is scaled accordingly. (8-9) The patient-specific, non-invasive LVP curve are used in combination with each of the individuals segmental strain curves previously obtained by STE in order to calculate non-invasive LV PSLs. (8-9) Strain and pressure data are synchronized using the R wave on ECG as a common time reference. The area of the loop serves as an index of myocardial work (mmHg %). Work is calculated from mitral valve closure until mitral valve opening. The method has been included in echocardiographic software, making MW calculations commercially available. Interesting findings have been showed for PSLs in the field of cardiac resynchronization therapy. (10-12) The patterns of MW indices in hypertensive, ischemic and not ischemic cardiomyopathies have been also described. (13) Moreover, only one study was conducted till now in patients with non-obstructive hypertrophic cardiomyopathy (HCM), showing the role of MW as a reliable tool to estimate LV performance and functional capacity (14).
Aims
In order to have more insights on the novel non-invasive MW indices, we proposed:
1. To establish normal reference ranges of MW indices in healthy adults and to examine the influence of age and gender on normal reference limits. This study was part of the European Association of Cardiovascular Imaging (EACVI) Normal Reference Ranges Study (NORRE) study. It is the first one study, to date, to provide reference ranges for non-invasive MW indices (Paper 1).
2. To investigate main correlations between MW indices and LV size, parameters of LV systolic and diastolic function in the same NORRE population (Paper 2).
3. To evaluate MW indices in a population of patients with HCM, including also the obstructive form. In particular we proposed a method to obtain MW in obstructive HCM, we evaluated MW according to hypertrophy distribution and investigated main correlations between MW indices and LV size and function and left atrial longitudinal strain in this population (Paper 3).
Papers
Paper 1
Echocardiographic reference ranges for normal non-invasive myocardial work indices: results from the EACVI NORRE study
(Published data: Manganaro R. et al. Eur Heart J Cardiovasc Imaging 2018; 20 (5):582-590)
Introduction
Myocardial strain analysis has emerged in the last decade as a reliable tool for studying myocardial mechanics, adding information on cardiac performance when compared with traditional parameters of left ventricle (LV) systolic function, such as ejection fraction (EF). (2-5)However, their relative load dependency makes the myocardial deformation indices unable to account for changes in pre- and afterload. Myocardial work (MW) is emerging as an alternative tool for studying LV myocardial systolic function, because it incorporates both deformation and load into its analysis. In this context, MW could be considered as an advancement of myocardial strain, allowing to investigate LV performance also in cases of changes in afterload that could lead to misleading conclusions if relying only on strain analysis. Conditions of increased afterload can in fact negatively impact on myocardial strain even if MW is normal. MW assessment was initially calculated using invasive pressure measurements, which limited its widespread use in clinical practice. (15-16)Recently, Russell et al.(8) demonstrated that pressure–strain loops (PSLs) could estimate LV performance in a non-invasive manner, deriving LV pressure (LVP) curves from non-invasively acquired brachial artery cuff pressure. To date, the technique has been applied in myocardial ischaemia and in
results. (9-11, 17) The NORRE (Normal Reference Ranges for Echocardiography) study is the first European, large, prospective, multicentre study performed in 22 laboratories accredited by the European Association of Cardiovascular Imaging (EACVI) and in one American laboratory, which has provided reference values for all 2D echocardiographic (2DE) measurements of all cardiac chambers, (18) Doppler parameters, (19) aortic dimensions, (20) 3D echocardiographic measurements of the LV volumes and strain, (21) 2DE measurement of LV strains and twist, (22) and 2D and 3D measurement of left atrial function. (23)The present study aimed (i) to establish normal reference limits for MW indices in healthy adults and (ii) to examine the influence of age and gender on normal reference ranges.
Methods
Patient population
A total of 734 healthy European subjects constituted the final NORRE study population. The local ethics committees approved the study protocol. Only patients whose echocardiographic exams were acquired using GE echocardiographic ultrasound system (n= 378), which is the only to date provided with a software for calculating MW, were included. After the exclusion of patients that had incompatible image format and/or poor-image quality and/or whose blood pressure at the time of echocardiographic examination was not available, the final study population consisted of 226 (31%) normal subjects.
Echocardiographic examination
A comprehensive echocardiographic examination was performed using state-of-the-art echocardiographic ultrasound system (GE Vivid E9; Vingmed Ultrasound, Horten, Norway) following recommended protocols approved by the EACVI. (24-25) All echocardiographic images were recorded in a digital raw-data format and centralized for further analysis, after anonymization, at the EACVI Central Core Laboratory at the University of Liege, Belgium.
2D MW analysis
Quantification of MW was performed using commercially available software package (Echopac V.202, GE). It was measured from PSLs areas, which were constructed from non-invasive LVP curves combined with strain acquired with speckle tracking echocardiography (STE), as proposed by Russell et al. (8)Global Longitudinal Strain (GLS) was obtained as previously reported. (22) After calculating GLS, inserting values of brachial blood pressure and indicating the time of valvular events by echocardiography, the software derived non-invasive PSLs. Strain and pressure data were synchronized by aligning the valvular event times, which were set by pulse-wave Doppler recordings at mitral valve and aortic valve level and then confirmed by 2DE evaluation of the apical long-axis view. The area of the loop served as an index of regional and global MW (Figure 1A). Work was evaluated from mitral valve closure to mitral valve opening. A bull’s eye with the segmental and global work index (GWI) values was also provided (Figure 1B). Moreover, additional indices of MW were obtained as follows (Figure 1C and D): global constructive work (GCW, work performed during shortening in systole adding negative work during lengthening in isovolumetric relaxation); global
wasted work (GWW, negative work performed during lengthening in systole adding work performed during shortening in isovolumetric relaxation); and global work efficiency (GWE, constructive work divided by the sum of constructive and wasted work).
Figure 1. Measurement of Myocardial Work parameters by 2D echocardiography. LV
pressure-strain loop (A); bull’s eye of GWI (B); bar graph representing GCW and GWW (C); results from Myocardial Work analysis (D). LV, left ventricle; GWI, Global Work Index; GCW, Global Constructive Work; GWW, Global Work Waste; GWE, Global Work Efficiency.
Statistical analysis
Normality of the distribution of continuous variables was tested by the Kolmogorov–Smirnov test. All data were expressed as mean ± standard deviation (SD) or median (interquartile range) as appropriate. The 95% confidence interval was calculated as ±1.96 SDs from the mean. The lowest (2.5th percentile) and
highest (97.5th percentile) expected values for GWW and GWE were estimated in 1000 bootstrap samples to generate sampling distribution. Differences between groups were analysed for statistical significance with the unpaired t-test for normally distributed continuous variables and the Mann–Whitney U test for non-normally distributed continuous variables. Comparison of continuous variables according to age groups was done with the one-way analysis of variance test. When a significant difference was found, the post hoc testing with Bonferroni comparisons to identify specific group differences was used. Correlation between continuous variables was performed using Pearson’s or Spearman’s correlation coefficient. Multivariable linear regression analyses were performed to examine the independent correlates between MW indices and baseline parameters. Intra-observer and inter-Intra-observer variability was assessed in 20 randomly selected subjects using the Bland–Altman analyses. P < 0.05 was considered as statistically significant. All statistical analyses were carried out using SPSS version 20 (SPSS Inc., Chicago, IL, USA).
Results
Demographic data
Table 1 summarizes the demographic data of the NORRE population analysed in the present study. A total of 85 men (mean age 45 ± 14 years) and 141 women (mean age 44 ± 13 years) were included. 2DE MW indices obtained from the study population are displayed in Table 2. The lowest expected values of MW indices were 1270 mmHg% in men and 1310 mmHg% in women for GWI, 1650 mmHg% and 1544 mmHg% for GCW, and 90% and 91% for GWE, respectively. The highest expected value for GWW was 238 mmHg% in men and 239 mmHg% in women.
Table 1. Characteristics of the population
Parameters Total (n=226) Male (n=85) Female (n=141) P value
Age, years 45±13 45±14 44±13 0.6
Height, cm 170±10 178±8 164±7 <0.001
Weight, kg 68±12 78±9 62±9 <0.001
Body surface area, m² 1.8±0.2 1.9±0.1 1.7±0.1 <0.001
Body mass index, kg/m² 23±3 24±2 23±3 <0.001
Systolic blood pressure, mmHg 116±12 122±9 113±12 <0.001
Diastolic blood pressure, mmHg 73±8 75±8 72±9 0.01
Glucose, mg/dl 91±11 94±7 89±12 0.001
Cholesterol, mg/dl 182±31 187±29 180±32 0.019
Table 2. 2DE parameters of Myocardial Work
Total Mean ± SD or Medial (IQR) Total 95% CI or limits of normality ± SEa,b Male Mean ± SD or Medial (IQR) Male 95% CI or limits of normality ± SEa,b Female Mean ± SD or Medial (IQR) Female 95% CI or limits of normality ± SEa,b P value* GWI, mmHg% 1896± 308 1292 to 2505 1849± 295 1270 to 2428 1924 ±313 1310 to 2538 0.07 GCW, mmHg% 2232 ±331 1582 to 2881 2228± 295 1650 to 2807 2234 ±352 1543 to 2924 0.9 GWW, mmHg% 78.5 (53 to 122.2) 226 ± 28a 94 (61.5 to 130.5) 238 ± 33a 74 (49.5 to 111) 239 ± 39a 0.013 GWE, % 96 (94 to 97) 91 ± 0.8b 95 (94 to 97) 90 ± 1.6b 96 (94 to 97) 91 ± 1b 0.026
GWI, Global Work Index; GCW, Global Constructive Work; GWW, Global Work Waste; GWE, Global Work Efficiency; CI, Confidence Interval; SD, standard deviation; IQR, interquartile range; SE, standard error; a Highest expected value; b
Lowest expected value.
Age and MW indices relationship
Relationships between age and MW indices are shown in Table 3 and Figure 2. GWI and GCW increased with age in women (R2 = 0.06, P = 0.002 and R2 = 0.04, P = 0.007, respectively) along with systolic and diastolic blood pressure (R2 = 0.16, P < 0.001 and R2 = 0.09, P = 0.001, respectively). In the subgroup 20–40 years, GWW was higher in men than in women and the opposite occurred for GWE (P = 0.01 and P = 0.04, respectively), while no other gender differences were found in the different age subgroups.
Table 3. 2DE parameters of Myocardial Work and blood pressure values according to age and
gender
Age 20-40 (n=95) Age 40-60 (n=97) Age ≥ 60 (n=34) P value Male
Female Male Mean ± SD or Medial (IQR) Female Mean ± SD or Medial (IQR) Male Mean ± SD or Medial (IQR) Female Mean ± SD or Medial (IQR) Male Mean ± SD or Medial (IQR) Female Mean ± SD or Medial (IQR) Male Female R p R p GWI, mmHg% 1758±270 1800±251 1900±317 2027±341 1866±286 2002±270 0.2 <0.001 0.16 0.1 0.25 0.002 GCW, mmHg% 2186±240 2109±289 2267±327 2329±365 2226±328 2338±386 0.5 0.001 0.09 0.3 0.22 0.007 GWW, mmHg% 99 (68 to 144.5) 90 (48 to 145)* 89 (58 to 122.5) 76 (51 to 118) 85 (49 to 129) 90 (48 to 145) 0.5 0.6 -0.13 0.2 0.06 0.4 GWE, % 95 (93 to 97) 95 (94 to 97)* 96 (95 to 97) 96 (95 to 97) 96 (94 to 97) 95 (94 to 97) 0.6 0.8 0.12 0.2 -0.03 0.7 SBP, mmHg 120±10 108±10* 124±8 115±13* 121±7 122±12 0.1 <0.001 0.12 0.3 0.4 <0.00 1 DBP, mmHg 73±9 69±8* 76±6 74±9 74±8 76±8 0.1 0.002 0.12 0.2 0.3 0.001
SBP, systolic blood pressure; DBP, diastolic blood pressure. Other abbreviations as in Table 2.
Figure 2. Bar graphs showing average MW parameters by 2D echocardiography analysis according
to gender and age categories. *P-value differences between gender.
Repeatability and reproducibility
Intra-observer and inter-observer variability for MW indices are summarized in Table 4. Intra-observer and inter-observer analyses showed good repeatability and reproducibility in MW indices (Table 4, Figures 3and 4).
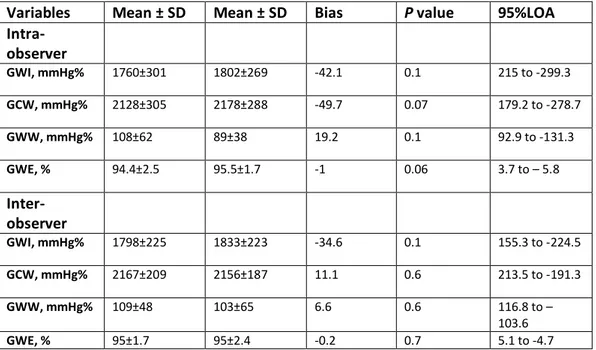
Table 4. Repeatability and reproducibility of 2D echocardiographic data
Variables Mean ± SD Mean ± SD Bias P value 95%LOA
Intra-observer GWI, mmHg% 1760±301 1802±269 -42.1 0.1 215 to -299.3 GCW, mmHg% 2128±305 2178±288 -49.7 0.07 179.2 to -278.7 GWW, mmHg% 108±62 89±38 19.2 0.1 92.9 to -131.3 GWE, % 94.4±2.5 95.5±1.7 -1 0.06 3.7 to – 5.8 Inter-observer GWI, mmHg% 1798±225 1833±223 -34.6 0.1 155.3 to -224.5 GCW, mmHg% 2167±209 2156±187 11.1 0.6 213.5 to -191.3 GWW, mmHg% 109±48 103±65 6.6 0.6 116.8 to – 103.6 GWE, % 95±1.7 95±2.4 -0.2 0.7 5.1 to -4.7
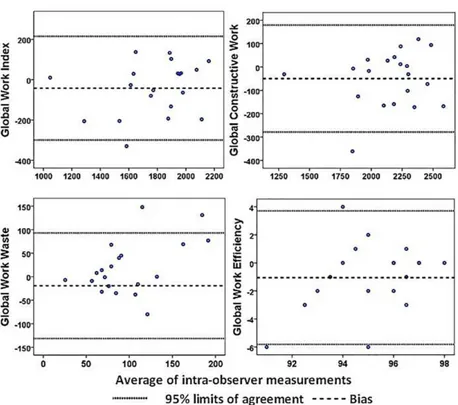
Figure 3. Bland-Altman analysis for assessing intra-observer variability of Global Work Index,
Global Constructive Work, Global Work Waste and Global Work Efficiency. Dotted lines represent bias and 95% limits of agreement for measurements performed in 20 patients.
Figure 4. Bland-Altman analysis for assessing inter-observer variability of Global Work Index, Global
Constructive Work, Global Work Waste and Global Work Efficiency. Dotted lines represent bias and 95% limits of agreement for measurements performed in 20 patients.
MW indices and baseline parameters relationship
Multivariable analysis for MW indices showed that GWI and GCW increased with systolic blood pressure (b-coefficient = 0.67, P < 0.001 and b-coefficient = 0.61, P < 0.001, respectively, Table 5). There was a significant increase in GWI and GCW according to age in univariable analysis but no association was
observed after adjustment for confounders. Higher values of GWE in women than in men were observed only by univariable analysis (Table 5).
Discussion
The present prospective, EACVI, multicentre study provides contemporary normal references values for 2DE measurements of non-invasive MW indices in a large cohort of healthy volunteers over a wide range of ages. 2DE analysis was performed using an EchoPAC workstation, which is the only system that currently provides software to calculate MW. The MW, derived from LVP/volume or pressure/length loops, has been investigated for almost 40 years, (6, 26-28)and has been recently shown to also provide similar physiological information to pressure/strain loops. (8, 16, 29) Russell et al. (8-17), more recently, introduced a method for calculating non-invasive MW, by STE and estimation of LVP from brachial artery cuff pressure. Moreover, these authors recently demonstrated a strong correlation of LV-PSLs area with regional glucose metabolism, assessed by fluorine 18-fluoro-deoxyglucose-positron emission tomography.
The present NORRE sub-study is the first one, to date, to provide reference ranges for 2DE non-invasive MW in a multicentre study design. In our population of healthy individuals, univariable analysis denoted age-related changes in GWI and GCW. However, when analysing for gender-groups, both the previous indices increased with age in women, while no differences were found in men. This finding can be easily explained when considering the significant increase of both systolic and diastolic blood pressure, even if still in the normal range, according to age in women while no significant differences were found in men. Both GWI and GCW were in fact strongly correlated to blood pressure, as previously demonstrated. The increase in systolic blood pressure translates into an increase in afterload, which probably shifts LV work to a higher level of energy. Moreover, multivariable analysis revealed significant correlation only with systolic blood pressure for both
GWI and GCW, with no gender and age-related changes. Univariable analysis for GWW and GWE showed lower and higher values in women than in men, respectively, with no significant differences according to age. Specifically, when age and gender are considered, GWW and GWE were only different in the subgroup of 20–40 years olds. Again, this is highly related to the effect of blood pressure, which was higher in male, accounting for higher values of GWW. In the same sub-group, no differences were observed for GCW between men and women, while GWE was lower in men, as expected if considering that GWE is indirectly derived from the ratio of constructive and wasted MW. These results were, however, not confirmed in multivariable analysis.
Our data, thus, provide evidence of the absence of a strong dependence of MW on age and gender, while they highlight the association between GWI and GCW with systolic blood pressure. Moreover, MW takes into account deformation as well as afterload, potentially being superior to strain in assessing cardiac performance. As previously demonstrated, an increase in afterload may lead to reduction in systolic strain in the presence of preserved or even increased MW. (9)
To date, MW has been investigated in the field of CRT, showing promising results as a reliable predictor of response to CRT. (10-11, 17) Preliminary interesting results have also been found in coronary artery disease. Boe et al. (9) showed increased sensitivity and specificity in identifying acute coronary occlusion in patients with non-ST-segment elevation myocardial infarction using regional cardiac work index, compared with all other echocardiographic parameters, including strain imaging. More recently, Chan et al. (13) reported the results of MW indices in three cardiovascular conditions, e.g. hypertension, ischaemic, and not-ischaemic dilated cardiomyopathy. Particularly, as in our study, they confirmed the high impact of blood pressure on MW indices by showing a significant increase
in GWI in hypertensive patients when compared with controls, despite a normal global longitudinal strain. So, likely, in conditions of high arterial pressure, the LV works at higher energy level to compensate the increased afterload, as reflected by the higher GWI. Moreover, in the population of ischaemic and not-ischaemic dilated cardiomyopathy, they found a significant increase in GWW, with an impairment of myocardial performance, as expressed by reduced values of both GWI and GWE, along with global longitudinal strain. The prognostic significance of wasted work in dyssynchronous ventricles was described in previous studies, while the potential role of GWI and GWE in dilated cardiomyopathies with overt LV systolic dysfunction probably needs to be further investigated. However, it can be postulated that they could offer interesting results and additional information about cardiac performances at a very early stage of the disease, when LV is only mildly dilated and an overt systolic dysfunction is not observed, as well as in every condition of heart failure with preserved left ventricular EF. Therefore, in clinical practice, MW could play a promising role in the serial assessment of patients with or at risk of developing cardiovascular disease as in those with hypertension or cancer. (30) In particular, GWI and GCW could find more applications as indices of myocardial performance, being an expression of positive LV work. They provide complementary information to the ones offered by EF and global longitudinal strain. Moreover, the assessment of GCW could play an important role in identifying responders to CRT, as an index of contractile reserve, fundamental for the success of the electrical therapy. On the contrary, but for the same purpose, GWW, which is an index of energy loss, as result of dyssynchronous and remodelled LV, could be an additional tool to identify possible responders to CRT. MW indices could also be helpful to examine the impact of treatment on LV
MW, reinforcing the possibility of a promising application of this new advanced echocardiographic parameter in clinical practice.
Limitations
This study presents several limitations. Only one-third of the patients included in the NORRE database were analysable by the current available software. Also, whether the NORRE study results can be extrapolated to non-Caucasian European individuals is still unknown.
Conclusion
The EACVI NORRE study provides applicable 2DE reference ranges for MW indices. Multivariable analysis did not show that age and gender were independently associated with MW indices.
Paper 2
Correlation between Non-Invasive Myocardial Work Indices and Main Parameters of Systolic and Diastolic function: Results from the EACVI NORRE study.
(Data under review: Eur Heart J Cardiovasc Imaging)
Introduction
Myocardial deformation analysis, by tissue Doppler imaging (TDI) and/or speckle tracking echocardiography (STE), developed in the last decade as a reliable tool for assessing left ventricle (LV) systolic function.(31-32) In addition to traditional parameters, such as ejection fraction (EF), myocardial strain (MS) allows the detection of early subclinical LV dysfunction in a variety of cardiac diseases.(5, 33-38) However, its relative load-dependency makes it unable for MS to account for changes in pre- and afterload. Non-invasive myocardial work (MW) was recently proposed as a new tool to study LV performance which takes into account myocardial deformation and afterload. Russel et al., recently developed a non-invasive method to calculate MW using LV pressure-strain loops (PSLs) obtained from STE. These authors demonstrated that regional differences in MW assessed by PSLs have a strong correlation with myocardial glucose metabolism as evaluated with fluoro-deoxyglucose positron emission tomography.(8) The application of these concepts to myocardial ischaemia and the assessment of cardiac resynchronization therapy (CRT)- responders has been evaluated, showing good results.(9-13, 17)
The NORRE (Normal Reference Ranges for Echocardiography) study is the first European, large, prospective, multicentre study performed in 22 laboratories accredited by the European Association of Cardiovascular Imaging (EACVI) and in 1 American laboratory, which has provided reference values for all 2D echocardiographic (2DE) measurements of the 4 cardiac chambers, (18) Doppler parameters, (19) aortic dimensions, (20) , 3D echocardiographic measurements of LV volumes and strain, (21) 2DE measurement of LV strains and twist, (22) 2D and 3D measurement of left atrial function (23) and, more recently, 2D measurement of MW indices. (39) The present study aimed to evaluate the correlation between indices of non-invasive MW and LV size, traditional and advanced parameters of LV systolic and indices of diastolic function by 2DE.
Methods
Patient population
A total of 734 healthy European subjects constituted the final NORRE study population. The local ethics committees approved the study protocol. Since GE echocardiographic system is the only equipped with a software package to calculate MW, only patients scanned with this system, (n= 378) were included. After the exclusion of patients that had incompatible image format and/or poor-image quality and/or whose blood pressure at the time of echocardiographic examination was not available, the final study population consisted of 226 (31%) normal subjects.
Echocardiographic examination
A comprehensive echocardiographic examination was performed using a state-of-the-art echocardiographic ultrasound system (GE Vivid E9; Vingmed Ultrasound,
Horten, Norway) following recommended protocols approved by the EACVI. (24-25) All echocardiographic images were recorded in a digital raw-data format (native DICOM format) and centralized for further analysis, after anonymization, at the EACVI Central Core Laboratory at the University of Liege, Belgium. LV end-diastolic and end-systolic volumes (EDV and ESV, respectively) were measured and indexed to body surface area (BSA), and EF was calculated using biplane Simpson’s method. (40) LV mass was calculated from linear measurements obtained from parasternal views and indexed to BSA. Mitral annular plane systolic excursion was measured by the use of M-mode echocardiography in an apical view at the septal and lateral mitral annuli.
The left ventricle outflow tract (LVOT) diameter was measured at the aortic valve annulus, 0.5–1 cm below the aortic cups from a zoomed parasternal long-axis acoustic window. LVOT velocity-time integral was measured in the apical 5-chamber view using pulsed-wave Doppler just proximal to the aortic valve. Stroke volume (SV) by Doppler (LVOTarea × LVOT velocity-time integral), cardiac output
(CO) (SV × heart rate), and cardiac index (CI) (CO/BSA) were calculated. Transmitral flow pattern with E and A wave velocities was obtained with the sample volume positioned at mitral leaflet tips. Systolic (s’) and early diastolic mitral annular velocity (e’), at both the septal and lateral side, were obtained using pulse wave (PW) tissue doppler imaging (TDI); moreover isovolumetric contraction time (IVCT), isovolumetric relaxation time (IVRT) and ejection time (ET) were measured by PW TDI in order to calculate the Tei index. (41) Biplane left atrial volume (LAV) was calculated using the Simpson’s biplane method and indexed to BSA. Arterial elastance (Ea) and end-systolic elastance (Ees) were calculated according to Chen et al; subsequently Ea/Ees ratio was obtained and used as an
2D LV strain and Myocardial work analysis
Quantification of 2D strain was performed using commercially available software (Echopac V.202, GE). Analysis was performed in all three apical views (LV four-, two-, and three-chambers views) as well as three short-axis views (LV basal, mid, and apical views). The reference point was set at the onset of the QRS complex. End-systole was identified as the time in which the LV cavity was the smallest. The endocardial border was traced in end-systole and the region of interest was adjusted to exclude the pericardium by attentively aligning the epicardial border. The integrity of tracking was visually confirmed as well as ascertained from the credibility of the strain curves, in addition to the automated tracking detection in the software. If necessary, the region of interest was readjusted. Peak systolic circumferential and peak systolic radial strain were measured at the basal, midventricular, and apical levels in each wall and averaged into a global value for each short-axis level and type of strain.
MW was obtained using a vendor specific module by PSLs areas, which were constructed from non-invasive LV pressure (LVP) curves combined with strain acquired with STE, as previously reported. (8-39) Peak systolic LVP was assumed to be equal to brachial systolic blood pressure (SBP) measured by cuff manometer. Therefore, a LVP curve was obtained using an empiric, normalized reference curve that was adjusted according to the duration of the LV isovolumetric and ejection phases, defined by the mitral and aortic event times, as set by echocardiography. Strain and pressure data were synchronized by aligning the valvular event times. Global work index (GWI) was obtained as total work within the area of the LV PSLs, calculated from mitral valve closure to mitral valve opening.
Moreover, additional indices of MW were calculated as follows: global constructive work (GCW), work performed during shortening in systole adding negative work during lengthening in isovolumetric relaxation; global wasted work (GWW), negative work performed during lengthening in systole adding work performed during shortening in isovolumetric relaxation; global work efficiency (GWE), constructive work divided by the sum of constructive and wasted work.
Statistical analysis
Normality of the distribution of continuous variables was tested by the Kolmogorov-Smirnov test. Continuous variables were expressed as means ± standard deviation (SD) or median (interquartile range) as appropriate. Differences between groups were analysed for statistical significance with the unpaired t-test for normally distributed continuous variables and the Mann–Whitney U test for non-normally distributed continuous variables. Correlation between continuous variables was performed using Pearson’s or Spearman’s correlation coefficient as appropriate. Multivariable linear regression analyses were performed to examine the independent correlates between MW indices and standard and advanced echocardiographic parameters. For multiple linear regression models, multicollinearity was also examined by computation of variance inflation factor. In case of collinear variables, the variable with the highest correlation coefficient was included. P< 0.05 was considered as statistically significant. All statistical analyses were carried out using SPSS version 21 (SPSS Inc., Chicago, IL, USA).
Results
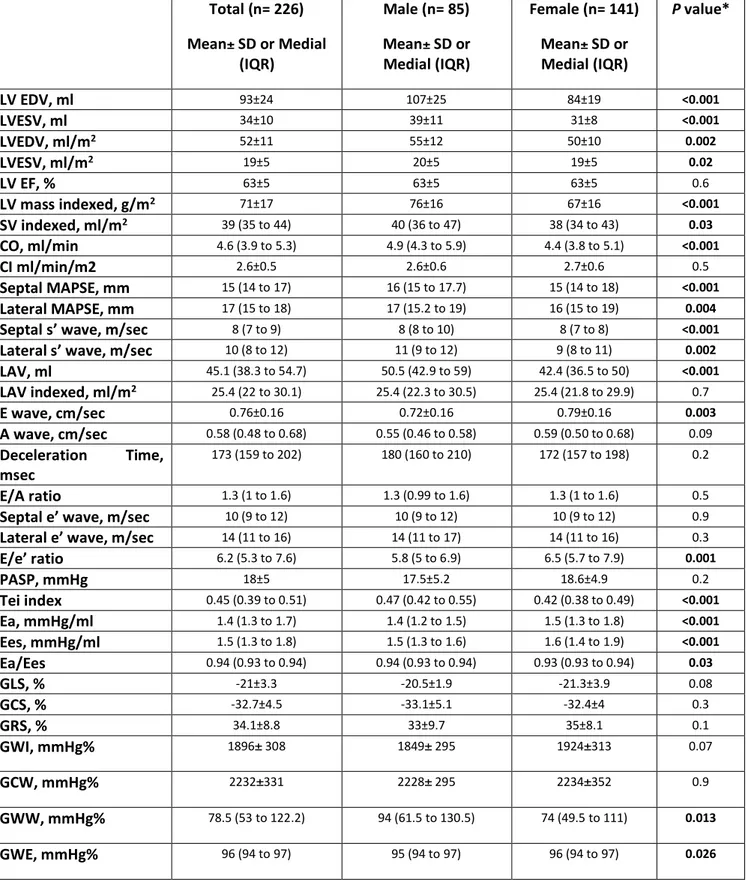
A total of 85 men (mean age 45±14 years) and 141 women (mean age 44±13 years) were included. Other demographic data of the population analysed in the present study were previously reported. (39) Standard and advanced 2DE parameters of the study population are displayed in Table 1. LV mass and volumes were greater in men compared with women, even after normalization for BSA; the same was observed for SV, CO and CI. No significant differences were found for EF and all average strain components. Indices of VAC were slightly higher in women.
Table 1. Standard and advanced echocardiographic characteristics of study population Total (n= 226) Mean± SD or Medial (IQR) Male (n= 85) Mean± SD or Medial (IQR) Female (n= 141) Mean± SD or Medial (IQR) P value* LV EDV, ml 93±24 107±25 84±19 <0.001 LVESV, ml 34±10 39±11 31±8 <0.001 LVEDV, ml/m2 52±11 55±12 50±10 0.002 LVESV, ml/m2 19±5 20±5 19±5 0.02 LV EF, % 63±5 63±5 63±5 0.6 LV mass indexed, g/m2 71±17 76±16 67±16 <0.001 SV indexed, ml/m2 39 (35 to 44) 40 (36 to 47) 38 (34 to 43) 0.03 CO, ml/min 4.6 (3.9 to 5.3) 4.9 (4.3 to 5.9) 4.4 (3.8 to 5.1) <0.001 CI ml/min/m2 2.6±0.5 2.6±0.6 2.7±0.6 0.5 Septal MAPSE, mm 15 (14 to 17) 16 (15 to 17.7) 15 (14 to 18) <0.001 Lateral MAPSE, mm 17 (15 to 18) 17 (15.2 to 19) 16 (15 to 19) 0.004
Septal s’ wave, m/sec 8 (7 to 9) 8 (8 to 10) 8 (7 to 8) <0.001
Lateral s’ wave, m/sec 10 (8 to 12) 11 (9 to 12) 9 (8 to 11) 0.002
LAV, ml 45.1 (38.3 to 54.7) 50.5 (42.9 to 59) 42.4 (36.5 to 50) <0.001 LAV indexed, ml/m2 25.4 (22 to 30.1) 25.4 (22.3 to 30.5) 25.4 (21.8 to 29.9) 0.7 E wave, cm/sec 0.76±0.16 0.72±0.16 0.79±0.16 0.003 A wave, cm/sec 0.58 (0.48 to 0.68) 0.55 (0.46 to 0.58) 0.59 (0.50 to 0.68) 0.09 Deceleration Time, msec 173 (159 to 202) 180 (160 to 210) 172 (157 to 198) 0.2 E/A ratio 1.3 (1 to 1.6) 1.3 (0.99 to 1.6) 1.3 (1 to 1.6) 0.5
Septal e’ wave, m/sec 10 (9 to 12) 10 (9 to 12) 10 (9 to 12) 0.9
Lateral e’ wave, m/sec 14 (11 to 16) 14 (11 to 17) 14 (11 to 16) 0.3
E/e’ ratio 6.2 (5.3 to 7.6) 5.8 (5 to 6.9) 6.5 (5.7 to 7.9) 0.001 PASP, mmHg 18±5 17.5±5.2 18.6±4.9 0.2 Tei index 0.45 (0.39 to 0.51) 0.47 (0.42 to 0.55) 0.42 (0.38 to 0.49) <0.001 Ea, mmHg/ml 1.4 (1.3 to 1.7) 1.4 (1.2 to 1.5) 1.5 (1.3 to 1.8) <0.001 Ees, mmHg/ml 1.5 (1.3 to 1.8) 1.5 (1.3 to 1.6) 1.6 (1.4 to 1.9) <0.001 Ea/Ees 0.94 (0.93 to 0.94) 0.94 (0.93 to 0.94) 0.93 (0.93 to 0.94) 0.03 GLS, % -21±3.3 -20.5±1.9 -21.3±3.9 0.08 GCS, % -32.7±4.5 -33.1±5.1 -32.4±4 0.3 GRS, % 34.1±8.8 33±9.7 35±8.1 0.1 GWI, mmHg% 1896± 308 1849± 295 1924±313 0.07 GCW, mmHg% 2232±331 2228± 295 2234±352 0.9 GWW, mmHg% 78.5 (53 to 122.2) 94 (61.5 to 130.5) 74 (49.5 to 111) 0.013 GWE, mmHg% 96 (94 to 97) 95 (94 to 97) 96 (94 to 97) 0.026
SD, standard deviation; IQR, interquartile range; LV, left ventricle; EDV, end-diastolic volume; ESV, end-systolic volume; EF, ejection fraction; SV, stroke volume; CO, cardiac output; CI, cardiac index MAPSE, mitral annular plane systolic excursion; LAV, left atrial volume; PASP, pulmonary arterial systolic pressure; Ea; arterial elastance; Ees, end-systolic elastance; GLS, global longitudinal strain; GCS, global circumferential strain; GRS, global radial strain; GWI, global work index; GCW, global constructive work; GWW, global work waste; GWE, global work efficiency. *P-value differences between gender.
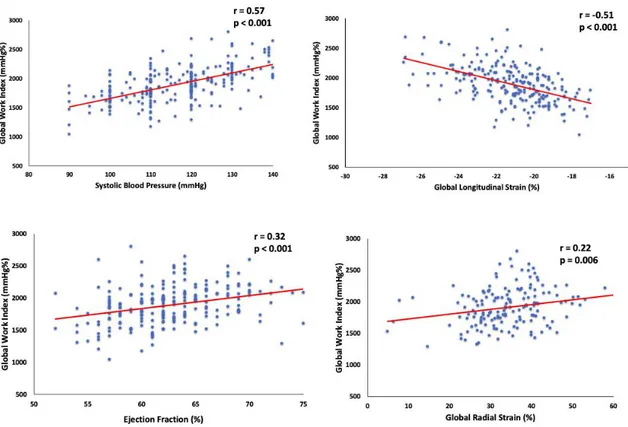
Correlations between GWI and 2DE parameters
As expected, GWI showed a good correlation with SBP and global longitudinal strain (GLS) (r= 0.57, p <0.0001 and r=-0.51, p < 0.001, respectively), a moderate correlation with EF and Ea/Ees (r=0.32, p < 0.001 and r=0.29, p <0.001) and a weak correlation with LV mass indexed to BSA, SV indexed to BSA, CO, CI, lateral s’ wave, E/e’ ratio and global radial strain (GRS) (Table 2). On multivariable analysis, GWI was significantly correlated with GLS (standardized beta-coefficient= -0.23, p< 0.001), EF (standardized coefficient= 0.15, p= 0.02), SBP (standardized beta-coefficient=0.56 p< 0.001) and GRS (standardized beta-coefficient= 0.19, p=0.004) (Figure 1, Table 2).
Table 2. Univariable and Multivariable Analysis for GWI
Variable Univariable Analysis
Coefficient p Multivariable Analysis Standardized p β-coefficient SBP, mmHg EDV, ml ESV, ml EDV indexed, ml/m2 ESV indexed, ml/m2 EF, % LV mass indexed, g/m² SV indexed, ml/m² CO, ml/min CI, ml/min/m2 Septal MAPSE, mm Lateral MAPSE, mm Septal s’ wave, cm/sec Lateral s’ wave, cm/sec LAV ml
LAV indexed ml/m2
E wave, cm/sec A wave ,cm/sec
Deceleration Time, msec E/A ratio
Septal e’ wave, cm/sec Lateral e' wave, cm/sec E/e’ ratio PASP, mmHg Tei index Ea, mmHg/ml Ees, mmHg/ml Ea/Ees GLS, % GCS,% GRS,% 0.57 <0.001 0.09 0.1 -0.07 0.2 0.11 0.1 -0.08 0.2 0.32 <0.001 0.15 0.02 0.26 <0.001 0.14 0.03 0.19 0.004 -0.012 0.7 -0.015 0.8 -0.06 0.3 -0.13 0.04 0.12 0.08 0.19 0.006 0.12 0.07 0.17 0.009 -0.05 0.3 -0.06 0.3 -0.13 0.05 -0.03 0.05 0.23 0.001 0.06 0.4 -0.07 0.2 0.08 0.2 0.09 0.1 0.29 <0.001 -0.51 <0.001 -0.15 0.05 0.22 0.006 0.56 <0.001 0.15 0.02 -0.23 <0.001 0.19 0.004
Correlations between GCW and 2DE parameters
GCW showed a good correlation with SBP and GLS (r= 0.64, p <0.001 and r=-0.51, p < 0.001, respectively), a moderate correlation with EF and Ea/Ees (r=0.26, p < 0.001 and r=0.29, p <0.001) and a weak correlation with LV mass indexed to BSA, EDV indexed to BSA, SV indexed to BSA, CO, CI, lateral s’ wave, LAV and LAV indexed to BSA, E/e’ ratio, GRS and global circumferential strain (GCS) (Table 3). On multivariable analysis, GCW was
0.001), SBP (standardized beta-coefficient=0.71 p< 0.001), GRS (standardized coefficient= 0.11, p=0.01) and GCS (standardized beta-coefficient= -0.10, p=0.02) (Figure 2, Table 3).
Table 3. Univariable and Multivariable Analysis for GCW
Variable Univariable Analysis
Coefficient p Standardized p Multivariable Analysis β-coefficient SBP, mmHg EDV, ml ESV, ml EDV indexed, ml/m2 ESV indexed, ml/m2 EF, % LV mass indexed, g/m² SV indexed, ml/m² CO, ml/min CI, ml/min/m2 Septal MAPSE, mm Lateral MAPSE, mm Septal s’ wave, cm/sec Lateral s’ wave, cm/sec LAV ml
LAV indexed ml/m2
E wave, cm/sec A wave ,cm/sec
Deceleration Time, msec E/A ratio
Septal e’ wave, cm/sec Lateral e' wave, cm/sec E/e’ ratio PASP, mmHg Tei index Ea, mmHg/ml Ees, mmHg/ml Ea/Ees GLS, % GCS,% GRS,% 0.64 <0.001 0.13 0.06 -0.01 0.8 0.14 0.04 -0.02 0.6 0.26 <0.001 0.17 0.008 0.25 <0.001 0.16 0.01 0.19 0.005 -0.02 0.7 -0.006 0.9 -0.05 0.4 -0.14 0.03 0.17 0.01 0.23 0.001 0.05 0.4 0.11 0.09 -0.02 0.7 -0.06 0.3 -0.15 0.01 -0.07 0.2 0.2 0.003 0.03 0.6 -0.03 0.5 0.08 0.2 0.08 0.2 0.29 <0.001 -0.51 <0.001 -0.16 0.04 0.19 0.01 0.71 <0.001 -0.55 <0.001 -0.10 0.02 0.11 0.01 Abbreviations as in Tables 1-2.
Correlations between GWW and GWE and 2DE parameters
On multivariable analysis, GWW was significantly correlated with the Tei index (standardized beta-coefficient: 0.17, p=0.01) and inversely correlated with EF (standardized beta-coefficient= -0.14, p =0.03). The opposite occurred for GWE (standardized beta-coefficient= -0.20, p=0.004 and
Table 4. Univariable and Multivariable Analysis for GWW
Variable Univariable Analysis
Coefficient p Standardized p Multivariable Analysis β-coefficient SBP, mmHg EDV, ml ESV, ml EDV indexed, ml/m2 ESV indexed, ml/m2 EF, % LV mass indexed, g/m² SV indexed, ml/m² CO, ml/min CI, ml/min/m2 Septal MAPSE, mm Lateral MAPSE, mm Septal s’ wave, cm/sec Lateral s’ wave, cm/sec LAV ml
LAV indexed ml/m2
E wave, cm/sec A wave ,cm/sec
Deceleration Time, msec E/A ratio
Septal e’ wave, cm/sec Lateral e' wave, cm/sec E/e’ ratio PASP, mmHg Tei index Ea, mmHg/ml Ees, mmHg/ml Ea/Ees GLS, % GCS,% GRS,% 0.12 0.07 0.04 0.5 0.14 0.03 -0.008 0.9 0.12 0.06 -0.17 0.01 0.03 0.6 0.05 0.4 0.04 0.5 -0.02 0.7 0.01 0.8 -0.01 0.8 -0.08 0.2 -0.01 0.8 0.11 0.1 0.06 0.3 -0.11 0.1 -0.03 0.5 0.07 0.2 -0.05 0.4 -0.12 0.05 -0.07 0.9 -0.03 0.6 -0.04 0.6 0.24 <0.001 -0.05 0.4 -0.05 0.4 -0.04 0.5 0.09 0.1 0.03 0.6 -0.4 0.6 -0.14 0.03 0.17 0.01 Abbreviations as in Tables 1-2.
Table 5. Univariable and Multivariable Analysis for GWE
Variable Univariable Analysis
Coefficient p Standardized p Multivariable Analysis β-coefficient SBP, mmHg EDV, ml ESV, ml EDV indexed, ml/m2 ESV indexed, ml/m2 EF, % LV mass indexed, g/m² SV indexed, ml/m² CO, ml/min CI, ml/min/m2 Septal MAPSE, mm Lateral MAPSE, mm Septal s’ wave, cm/sec Lateral s’ wave, cm/sec LAV ml
LAV indexed, ml/m2
E wave, cm/sec A wave ,cm/sec
Deceleration Time, msec E/A ratio
Septal e’ wave, cm/sec Lateral e' wave, cm/sec E/e’ ratio PASP, mmHg Tei index Ea, mmHg/ml Ees, mmHg/ml Ea/Ees GLS, % GCS,% GRS,% 0.004 0.9 -0.02 0.6 -0.15 0.03 0.01 0.8 -0.14 0.04 0.20 0.004 0.01 0.8 -0.03 0.6 -0.02 0.7 0.03 0.6 0.009 0.9 0.02 0.7 0.08 0.2 -0.008 0.9 -0.07 0.3 -0.02 0.7 0.11 0.9 0.02 0.7 -0.09 0.1 0.05 0.4 0.12 0.07 0.03 0.6 0.02 0.7 0.03 0.7 -0.26 <0.0001 0.07 0.2 0.07 0.3 0.08 0.2 -0.019 0.003 -0.06 0.4 0.06 0.4 0.18 0.009 -0.20 0.004 Abbreviations as in Tables 1-2
Discussion
Reference ranges for MW indices have been recently provided by the previous NORRE study. (39) Correlations between MW and demographical variables were also investigated, showing the absence of a strong dependence of MW indices on age, gender and BMI.(39) Hence, due to the growing interest in MW, the present NORRE sub-study sought to evaluate the correlations existing between the new indices of MW and LV dimensions, standard and advanced 2DE parameters of LV systolic function and indices of diastolic function.
We did not find a strong correlations between MW indices and LV size. On univariable analysis GWW and GWE were indeed weakly correlated with ESV, whereas GWI and GCW were weakly correlated with LV mass indexed to BSA. The latter finding could be due to the fact of a major contractile mass being involved in the production of positive work. (43) However, in pathological cardiac hypertrophy, a reduction of MW indices was recently reported. (14) Despite the physiological interest, we have to acknowledge that all these associations are not strong, not observed for all MW indices, and not confirmed in multivariable analysis. Probably, these data could be explained when considering that the study population was entirely composed by healthy subjects, leading to restricted LV size values ranges. In cardiac disease, such as cardiomyopathies and heart valve disease, instead changes in both LV size and function are often observed. (44-46) Thus, LV remodeling and dysfunction are usually strictly correlated, the one affected by the other and viceversa, especially in advanced cardiovascular diseases. On the contrary, in normal subjects, it is not really surprising to find only a mild association between LV size and indices of MW, being both in a normal range.
Regarding LV systolic function, we tested correlations with traditional parameters and with MS, which is an established advanced index to study LV systolic function.
While associations with GLS were obviously expected, we also found an intriguing significant correlation between both GWI and GCW with GRS. Furthermore, GCW was significantly correlated even with GCS. As known, due to the complex architecture of myocardial fibers the LV systolic motion is the result of three principal components: base to apex longitudinal shortening, epicardium toward endocardium radial thickening and circumferential rotation and shortening. (31) Our findings, thus, highlights as likely all the components of myocardial deformation contribute to generate MW, so it, and in particular GCW, could be supposed to globally reflect LV mechanics and performance. In our analysis, GWI and GCW were also significantly correlated with parameters that traditionally reflect LV systolic performance, namely EF, SV, CO and CI. These data are perfectly in accordance with the physiological substrate of GWI and GCW. In a normal heart, indeed, all myocardial segments contract in a synchronized manner resulting in positive work, the constructive work, which by definition is the work contributing towards LV ejection. (11) Accordingly, GCW, as index of contractile and viable myocardium, has been proposed as a potential parameter to identify CRT responders by Galli et al. (10-11) The same authors showed preliminary results of GCW’ s application even in non-obstructive hypertrophic cardiomyopathy, as a reliable tool to estimate LV performance and functional capacity. (14)
Among diastolic parameters, GWI and GCW correlated with LA size and E/E’ ratio, though only on univariable analysis. Probably this finding should be interpreted in the context of normal ranges of both the diastolic parameters. In our population, in fact, increasing values of LA size and E/e’ were not an expression of diastolic disfunction, being both in the normal range. Besides, this association was not confirmed in multivariable analysis; so according to our data correlation of MW
exception was the Tei index. A significant association between Tei index and both GWW and GWE was found. It is a combined index of global systolic and diastolic function, which relies on measure of the same part of cardiac cycle analysed by MW: from mitral valve closure to mitral valve opening, namely mechanical systole including isovolumetric relaxation time. Higher values of Tei index are secondary to prolonged IVCT and/or IVRT respect to ET; it could be translated in a higher wasted work, due mainly to myocytes’ shortening in a prolonged IVRT, and consequent lower efficiency.
Finally, as MW has been recently proposed as a potential new method of estimation of VAC, (47) we aimed to test its correlation with the main index of VAC, Ea/Ees ratio, calculated by echocardiography. (42, 48) It is the result of complex formulas including SV, EF, SBP and DBP (all parameters correlated with GWI and GCW) and accounting for time too. (42) So, the significant correlation with Ea/Ees ratio and its easier measurement could reinforce its application also as an alternative index of VAC. However, more studies are needed to evaluate the performance of MW and its role as an established tool for studying VAC needs to be further investigated and validated.
Our data, hence, support the role of MW as a reliable parameter of myocardial systolic performance, in addition to traditional ones and MS. MW, indeed, adjusting myocardial deformation for LV pressure dynamics, could offer further information for the evaluation of cardiac performance in conditions of subclinical LV disfunction as well as in heart failure with preserved EF (HFpEF). In this field preliminary data have been recently obtained, depicting the superiority of GCW respect to GLS as a better determinant of exercise capacity in patients with HFpEF. (49) Therefore, besides its promising application in patients candidates to CRT, MW could be investigated in the subset of patients at risk of development or at an
early stage of cardiovascular disease, as for example patients under cardiotoxic treatment.
Limitations
Only 31% of the patients included in the NORRE study have been available for MW analysis, due mainly to the possibility of application of MW only to exams acquired through GE echocardiographic ultrasound system, adding the dependency on image quality and blood pressure availability. Moreover, whether the NORRE study results can be extrapolated to non-Caucasian European individuals is still unknown.
Non-invasive LVP estimation by brachial cuff pressure is imprecise, representing a limitation of LV PSLs as obtained by Russel et al. Nevertheless, it was recently demonstrated that, despite discrepancies between cuff pressure and invasive pressure, MW analysis was accurate, due to temporal integration and less pressure differences from aortic valve opening to closure.(50)
Based on our findings the current software is indeed promising, but further studies in larger populations with various forms of heart diseases, comparing the results of this software against invasively obtained PV loops and calculations of cardiac work parameters, are required before introducing it into daily clinical use.
Conclusion
The NORRE study shows good correlations of GWI with EF and GRS, and of GCW with GRS and GCS, as well as with GLS. Weak correlations are observed between MW indices and LV size. MW is a promising tool to study myocardial systolic performance, however further investigations are needed before introducing into
Paper 3
Myocardial Work analysis in hypertrophic cardiomyopathy: low work or high work?
(data not published)
Introduction
Non-invasive myocardial work (MW) indices have been recently introduced as novel parameters of left ventricle (LV) performance. Russel et al. validated a method of MW estimation by pressure-strain loops (PSLs), which takes into account deformation, i.e. global longitudinal strain (GLS) by speckle-tracking echocardiography (STE), as well as afterload, by non-invasively estimated LV pressure (LVP) curves.(8) Moreover, they found a correlation with myocardial metabolism, as expressed by the uptake of fluoro-deoxy-glucose at myocardial positron emission tomography scan. Myocardial strain (MS) has been extensively introduced to overcome the intrinsic limitation of ejection fraction (EF), allowing an early detection of LV subclinical systolic disfunction in different heart diseases.(31, 38, 51-52) Due to the known load-dependency of MS, MW has, thus, been proposed as a further potentially superior index of myocardial performance. Interesting findings have been showed for PSLs in the field of cardiac resynchronization therapy.(10-12) The patterns of MW indices in hypertensive, ischemic and not ischemic cardiomyopathies have been also described.(9, 13) Till now, only one study investigated MW in non-obstructive hypertrophic cardiomyopathy (NOHCM), showing interesting results.(14)
Hypertrophic cardiomyopathy (HCM) is a congenital disease characterized by different patterns of LV hypertrophy, with histological findings of myocyte’s
hypertrophy and disarray and interstitial fibrosis.(53) LV longitudinal strain (LS) has been extensively investigated, showing impairment of LV mechanics even in the presence of preserved EF and correlation with adverse outcomes.(54-56). Moreover, left atrial (LA) remodeling usually occurs in HCM and a prognostic value of worse LA LS has been previously demonstrated.(57, 58)
This study aimed to: (i) describe MW in a population of patients with HCM; (ii) hypothesize a method to estimate MW also in obstructive hypertrophic cardiomyopathy (OHCM); (iii) evaluate regional MW according to hypertrophy distribution; (iiii) evaluate the correlations of MW indices with LV size and function and LA LS in this population.
Methods
Study population
Fifty-four patients affected by HCM and referred to our Cardiology Department were enrolled. The diagnosis of HCM was based on the presence of LV hypertrophy (15 mm) not explained by loading conditions, accordingly to international guidelines.(53) Patients with more than mild valve disease, ischemic heart disease, previous myomectomy and/or alcohol septal ablation were excluded. Ten patients were excluded for suboptimal quality of STE image analysis. The final study population consisted of 44 patients, which were subsequently divided in two groups: non-obstructive ( NOHCM, n = 30, 68%) and obstructive patients ( OHCM, n = 14, 32%). All patients underwent clinical examination and two-dimensional (2D) standard and STE-echocardiography. Twenty healthy subjects, matched for age and sex, formed the control group.
Standard echocardiography
Echocardiography examinations were performed using a Vivid (E9 or E95) ultrasound system (GE Healthcare, Horten, Norway) and digitally stored in a dedicated software for offline analysis (EchoPAC, V. 202, GE Healthcare). LV volumes and EF were obtained according to Simpson’s biplane method.(40) Maximal LV wall thickness (MWT) was measured in the basal, mid, and apical short axis views at end-diastole. LA diameter was obtained as recommended and biplane LA volume (LAV) was calculated using the Simpson’s biplane method and indexed to body surface area (BSA).(59) Mitral flow peak early (E) and late (A) diastolic filling velocities, E/A ratio, and deceleration time were measured as markers of diastolic function.(59) Spectral tissue Doppler imaging was used to obtain peak early diastolic mitral annulus velocity (e’) and E/e’ ratio. The LV pressure gradient was estimated by continuous-wave Doppler recordings at LV outflow tract (LVOT). LVOT obstruction (LVOTO) at rest was defined as a maximal gradient ≥ 30 mmHg.(53)
Left ventricle and left atrial longitudinal strain
LV and LA LS were obtained by STE technique. Analysis of LV LS was performed using semiautomatic tracking on high frame rate (70-90 frames/s) apical views (four, two, and three chambers). Adequate tracking was verified and was manually corrected if necessary. Endocardial and epicardial strain were measured on the endocardial and epicardial ROI border, respectively, whereas the mid-myocardial strain, namely the GLS, was the average value of the transmural wall thickness. Regional multilayer strain of the hypertrophic area (HA) and of the no-hypertrophic
area (NHA), as average of segmental multilayer strain in hypertrophic segments and in no-hypertrophic segments respectively, were also calculated.
LA strain was obtained as previously reported.(23, 60) The LA endocardial border was manually traced, delineating a region of interest that consisted of 6 segments in apical 4-chamber view and 6 segments in apical 2-chamber view.Peak atrial LS during the reservoir phase was calculated by averaging the positive peak values obtained in 4- and 2-chamber views during LV end-systole.
Myocardial Work
MW was measured from PSLs areas, which were constructed from non-invasive systolic LVP curves combined with strain acquired with STE as previously described.(8, 39) Peak LVP was assumed to be equal to brachial systolic blood pressure (SBP) measured by cuff manometer. Therefore, a LVP curve was obtained using an empiric, normalized reference curve that was adjusted according to the duration of the LV isovolumetric and ejection phases, defined by the aortic and mitral event times, as set by echocardiography.
The reliability of this non-invasive LVP curve was previously validated.(8) The area of the loop served as an index of regional and global MW (GWI). Additional indices of MW were obtained: global constructive work (GCW), positive work contributing to LV ejection, performed during shortening in systole adding negative work during lengthening in isovolumetric relaxation; global wasted work (GWW), negative work, representing energy loss, performed during lengthening in systole adding work performed during shortening in isovolumetric relaxation; and global work efficiency (GWE), constructive work divided by the sum of constructive and wasted work. Regional WI of the HA and of the NHA, as
average of regional WI in hypertrophic segments and in no-hypertrophic segments respectively, were also calculated.
MW has not been investigated in patients with OHCM to date, probably due to the concerns regarding estimation of LVP curve by brachial SBP in the presence of LVOTO at rest. For this purpose, in the OHCM group we proposed to realize a double MW analysis, in order to speculate which could be the best in these patients: 1) as traditionally reported, by only SBP; 2) by adding peak systolic LVOT gradient at rest to SBP, as a surrogate of LVP.
Statistical Analysis
Normality of the distribution of continuous variables was tested by the Shapiro-Wilk test. Continuous variables were expressed as means ± standard deviation (SD) or median (interquartile range) as appropriate, categorical variables were presented as percentages . Differences between two groups were analysed for statistical significance with the unpaired t-test for normally distributed continuous variables and the Mann–Whitney U test for non-normally distributed continuous variables. One-way analysis of variance (ANOVA) test or Kruskal-Wallis test were used to compare 3 groups, as appropriate. When a significant difference was found, post hoc testing with Bonferroni comparisons for ANOVA for identified specific group differences was used. Differences between HA and NHA in the whole population were evaluated using t-test for paired data or the Wilcoxon test as appropriate. Correlation between continuous variables was performed using Pearson’s or Spearman’s correlation coefficient as appropriate. Inter- and intra-observer reproducibility regarding measurement of LA and LV mechanics parameters were
evaluated using an intraclass correlation coefficient; readers were blind to the results.
P < 0.05 was considered as statistically significant. All statistical analyses were carried out using SPSS version 21 (SPSS Inc., Chicago, IL, USA).
Results
Whole patients population vs controls
Demographical and clinical variables of the HCM study population are described in Tables 1-2.
Table 1. Clinical variables of HCM patients
Clinical Variables
HCM
patients
( n = 44)
Hypertension, n (%) 16 (36) Diabetes mellitus, n (%) 6 (14) Dyslipidemia, n (%) 14 (32) Smoking, n (%) 7 (16) NYHA class, I, n (%) II, n (%) III, n (%) IV, n (%) 17 (39) 20 (46) 1 (3) 0 (0) Maron type, I, n (%) II, n (%) III, n (%) IV, n (%) 5 (11) 14 (32) 19 (43) 6 (14) OHCM, n (%) 14 (32) Family history of HCM, n (%) 6 (18) Family history of SCD, n (%) 5 (11)History of ventricular arrhythmias, n (%) sustained ventricular tachycardia, n (%) non sustained ventricular tachycardia, n (%)
4 (9) 2 (5) 2 (5)
History of atrial fibrillation, n (%) 8 (18)
History of unexplained syncope, n (%) 3 (7)
Beta-blockers, n (%) 25 (57)
Ca-channel antagonists, n (%) 5 (11)
Diuretics, n (%) 9 (21)
Disopyramide, n (%) 1 (2)
HCM, hypertrophic cardiomyopathy; OHCM, obstructive hypertrophic cardiomyopathy; SCD, sudden cardiac death
The most frequent hypertrophy type according to Maron’s classification was the III one ( n = 19, 43%), followed by the type II ( n = 14, 32%), while the types I and IV were the least frequent ( n = 5, 11% and n = 6, 14%, respectively).
Table 2. Baseline characteristics and standard echocardiographic parameters.
Variables
HCM
patients
(n=44)
Controls
(n=20)
p-value
Male, n (%) 29 (65.9) 13 (65) 0.9 Age, years 53 20 52 17 0.8 BSA, m2 1.86 0.27 1.81 0.22 0.4Systolic blood pressure,
mmHg 130 19 122 12 0.07
Diastolic blood pressure,
mmHg 72 11 75 7 0.2
Heart Rate, b/m’ 64 9 67 10 0.2
Interventricular septum, mm 18 (16-21) 8.2 (8-9.7) <0.001
Posterior wall, mm 11 (9-13) 10 (8.1-10.7) 0.05
Maximum wall thickness,
mm 18 (16-22) 10 (9-10) <0.001 LV end-diastolic diameter, mm 42 6 45 4 0.03 LV end-systolic diameter, mm 27 7 30 4 0.02 LV end-diastolic volume, ml 87 31 102 23 0.03 LV end-systolic volume, ml 32 13 38 12 0.07 LV end-diastolic volume indexed, ml/m2 46 14 56 10 0.002 LV end-systolic volume indexed, ml/m2 17 6 22 7 0.005 LV Ejection Fraction ,% 63 8 64 5 0.7
Left atrium diameter, mm 40 5 35 4 <0.001
Left atrium volume indexed,
ml/m2 43 17 26 7 <0.001
E/A ratio 1.09
(0.89-1.57) 1.23 (0.98-1.43) 0.6
Deceleration time, msec 237 95 193 44 0.02
E’ average, m/sec 7.5 2.5 12 3.4 <0.001
E/E’ ratio 11 4 6 2 <0.001
Pulmonary arterial systolic
pressure, mmHg 29 7 17 3 <0.001
LVOT gradient at rest, mmHg 10 (6.7-33.5) - -
Values are mean SD or median (interquartile range)
HCM, hypertrophic cardiomyopathy; BSA, body surface area; LV, left ventricle; LVOT, left ventricle outflow tract.
diameters, compared to controls (Table 2). No significant difference was found between groups for EF.
Diastolic function was worse in HCM patients, as showed by significant higher E/e’ ratio, LAV indexed to BSA and systolic pulmonary artery pressure (p < 0.001 for all, Table 2).
LV multilayer strain analysis showed significantly reduced LS in HCM patients at every layer ( p < 0.001 for all, Table 3). LA LS was also significantly impaired in patients group ( p < 0.001, Table 3).
As shown in Table 3, patients had significant lower GWI, GCW and GWE and significant higher GWW respect to controls, regardless of which type of MW analysis was conducted in OHCM patients.
Table 3. Advanced echocardiographic parameters in all HCM population compared to controls.
Variables
All HCM
Patients (n=44)
Controls
(n=20)
p-value
Global LS, % -16.1 3.8 -21.3 1.9 < 0.001 Endocardial LS,% -18.7 4.3 -24.2 2.2 < 0.001 Epicardial LS,% -13.9 3.4 -19 1.8 < 0.001 LA LS, % 23.6 12 38.7 8.8 < 0.001 GWI, mmHg% 1604 (1226-1769) 2005.5 (1668-2175) <0.001 GCW, mmHg% 1751 518 2284 339 <0.001 GWW, mmHg% 98 (73.2-190.5) 71.5 (50-137.7) 0.01 GWE,% 91 (85.2-95) 96.5 (94.2-97) < 0.001 GWILVOT, mmHg% 1696 (1338-2111) 2005.5 (1668-2175) 0.04 GCWLVOT, mmHg% 1924 586 2284 339 0.003 GWWLVOT, mmHg% 115 (78-212) 71.5 (50-137.7) 0.003 GWELVOT,% 91 (85.2-94.7) 96.5 (94.2-97) < 0.001Values are mean SD or median (interquartile range)
LS, longitudinal strain; LA, left atrium; GWI, global work index; GCW, global constructive work; GWW, global work waste; GWE, global work efficiency; LVOT; GWILVOT, GWI obtained
adding LVOT peak gradient to systolic blood pressure (SBP) in obstructive patients; GCWLVOT,
GCW obtained adding LVOT peak gradient to SBP in obstructive patients; GWWLVOT, GWW
obtained adding LVOT peak gradient to SBP in obstructive patients; GWELVOT, GWE obtained