University of Naples
Federico II
Dynamic simulation of
polygeneration systems
for buildings
RESEARCH DOCTORATE IN INDUSTRIAL ENGINEERING XXX CYCLEDOCTORATE THESIS
Maria Vicidomini
TUTORS PROF. FRANCESCO CALISE PROF. MASSIMO DENTICE D’ACCADIAPROF. ADOLFO PALOMBO
Electricity Cool Heat
Polygeneration
Fossil energy Renewable energy3 of 208
U
NIVERSITY
O
F
N
APLES
F
EDERICO
II
S
CHOOL
O
F
D
OCTORATE
I
N
I
NDUSTRIAL
E
NGINEERING
R
ESEARCHD
OCTORATEI
NI
NDUSTRIALE
NGINEERINGXXX
C
YCLED
OCTORATET
HESISDynamic simulation of polygeneration systems for buildings
TUTORS CANDIDATE
PROF.FRANCESCO CALISE MARIA VICIDOMINI
PROF.MASSIMO DENTICE D’ACCADIA PROF.ADOLFO PALOMBO
DOCTORATE COORDINATOR PROF.MICHELE GRASSI
5 of 208
To my daughter Dèsirèe
I am proud of many things in my life,
but nothing beats being your mother
7 of 208
CONTENTS
Aim of the thesis ... 1
Outline of the thesis ... 3
Chapter 1 Introduction ... 5
1.1 International energy framework ... 5
1.2 Energy consumption in buildings ... 11
Chapter 2 Building Integrated Solar Thermal Systems ... 15
2.1 Classification, description and application of BISTSs ... 16
2.1.1 Domestic hot water production ... 17
2.1.2 Space heating and ventilation ... 18
2.1.3 Cooling ... 19
2.2 BIPVT (Building Integrated PhotoVoltaic and Thermal collectors) ... 20
2.3 BIPVT system experimental and simulation studies ... 21
2.3.1 BIPVT experimental works ... 22
2.3.2 BIPVT simulation studies ... 32
2.3.3 The state of the art of the BIPVT collectors: analysis ... 43
Chapter 3 Polygeneration ... 45
3.1 Inputs to polygeneration systems ... 46
3.2 Conversion technologies ... 64
3.3 By-products of polygeneration systems ... 83
Chapter 4 Polygeneration systems for building ... 87
4.1 Dynamic simulation of polygeneration systems coupled to BIPVT solar collectors for several building applications: energy, exergy, economic and environmental analysis ... 88
Study 1 ... 88
Study 2 ... 110
Study 3 ... 128
4.2 Dynamic simulation of a natural-gas-driven BCCHP system ... 145
Study 4 ... 145 Study 5 ... 160 CONCLUSION ... 180 LIST OF PUBLICATIONS ... 182 NOMENCLATURE ... 185 BIBLIOGRAPHY ... 187
Aim of the thesis
This thesis aims at investigating the polygeneration systems for buildings by dynamic simulation models. In particular, different polygeneration systems, supplied both by the solar renewable energy source and by natural gas, were examined.
Solar polygeneration systems were investigated by considering a new configuration of solar technology with respect to traditional one, based on the Building Integrated Solar Technologies (BISTSs), that today in EU Countries is often recommended or mandatory for new buildings. In particular, BISTSs (e.g. BI Solar Thermal Collectors BISTC, BI PhotoVoltaic panels BIPV, BI PV Thermal collectors BIPVT, etc.) replace partly or totally the building envelope elements (opaque roof and façades and transparent/semi-transparent elements, sunshades and sunscreens, balcony, etc.), by addressing both the functional and aesthetic aspects.
In more detail, the thesis aims to:
• investigate the thermal and electric performance of BIPVT collectors with water as working fluid, since very few works are available in literature concerning this technology respect the more diffused systems based on BIPV or air BIPVT;
• assess the active and passive effects of different BIPVT system layouts on the building energy demand and consumption, avoiding focusing only on the BIPVT system itself, and analysing the whole building-plant system;
• analyse the BIPVT collectors electricity production when they are coupled to electricity storage batteries, in order to obtain a grid-independent system;
• analyse the heat production of BIPVT collectors when they are coupled to low temperature heat-driven chillers, as adsorption chillers;
• find out the set of building/plants design and operating parameters which maximize the system energy, exergy, environmental and economic performance, by comprehensive parametric analysis; • outline design guidelines related to the system layouts and building envelope features as a function of weather conditions.
The general purpose is to fill some knowledge gaps found in literature regarding BISTSs, from both numerical and/or experimental points of view, providing a contribution to their diffusion.
Natural gas polygeneration systems were investigated by adopting an innovative approach based on detailed dynamic simulations, able to predict the real time-dependent operation of the polygeneration systems preceding their installation, to optimize the configurations and to enhance their energetic, economic and environmental performance. The application of this methodology to polygeneration systems based on fossil fuels, in this case natural gas, is very attractive in order to overcome the main drawbacks of this technology due to the scarce reliability of the feasibility analyses. In fact, a number of profitable polygeneration systems are discarded in a preliminary design phase, whereas several apparently profitable systems are realized, revealing a poor energy and economic performance over their operating lifetime. This is mainly due to the dramatic simplifications used in the prediction of the performance of the systems to be evaluated. By
considering this aspect and the knowledge gaps emerged from the literature review, in this thesis the following points were investigated:
• the coupling of polygeneration plants and buildings, as a unique system, analysed through a detailed model of the hydronic system strictly related to a building dynamic simulation model; • a detailed thermo-economic comparison among the different conventional, innovative /optimized control strategies, considering the real-time operation of the controllers and of the whole system, and taking into account the temperature fluctuations in every component, as well as the effects of varying set-point temperatures and/or activation periods;
• investigating high capacity polygeneration systems (for industrial and hospital applications) that with respect to the micro-polygeneration systems don’t suffer for the low operating hours and for the high capital costs typical of residential application.
Outline of the thesis
The thesis is outlined as follows:
Chapter 1: This chapter provides information about the energy and environmental issues in the
worldwide framework, mainly focusing on the energy consumption of the buildings sector. The most recent international regulations adopted to reduce the energy consumption and to increase building energy performance are also reported.
Chapter 2: In this chapter, the description and classification of Building Integrated Solar
Thermal Systems (BISTSs) is reported. These systems are integrated into building envelope and can be used in both the construction of new buildings and the refurbishment of existing buildings, enhancing their energy performance. The real applications and simulation works concerning the several technologies and configurations of such innovative collectors are reported, mainly focusing on the BI PhotoVoltaic Thermal (BIPVT) collectors.
Chapter 3: In this chapter, the work concerning the simulation of polygeneration systems is
presented. By reading this chapter, the reader will understand that the possible layouts of polygeneration systems are virtually infinite, since the polygeneration can use different inputs (fossil and renewable), conversion technologies and can produce several outputs: energy (power, heating and cooling) and / or other products (hydrogen, syngas, biodiesel, fertilizers, drinking water, etc.).
Chapter 4: In this chapter, the performances of BIPVT collectors and natural gas
polygeneration plants are analysed in specific cases in which they are coupled to buildings with different uses. In particular, in this chapter suitable dynamic simulation models, developed in TRNSYS 17 environment, are presented and adapted for different cases studies, calculating the energy, exergy, economic and environmental performance of the investigated systems for various time basis.
Chapter 1 Introduction
1.1 International energy framework
In the last year as in next future, the total primary energy supply (TPES) is growing, fact highlighted by several factors: the global economy growth at an average rate of 3.4%/year; expansion of population that from 7.4 billion today will be more than 9 billion in 2040; the urbanization process. To face this demand the production estimated at 2015 was 13790 Mtoe (Figure 1).
Figure 1. Total production by region [1].
At a regional level, the OECD economies produced 4 160 Mtoe, 30% of global energy, with a share of the US and Canada for almost 2500 Mtoe. Non-OECD Asia accounted for 29%, around 3980 Mtoe. This value is mainly supported by India and China. Only China produces about 2500 Mtoe, achieved by an increase of crude oil, natural gas, hydro, nuclear and power renewables productions: +1.5%, +3.4%, +6.0%, +28.9% and +14.8% respectively, respect 2014. China produces almost half of the world coal, and 29% of hydro. Instead, other biggest energy producers in this region, Indonesia and Thailand, driven by coal and natural gas, respectively, reduce their total production. Third is the Middle East with 1880 Mtoe, supported instead by an increase of crude oil production. With 1830 Mtoe, 1120 Mtoe and 816 Mtoe in 2015, respectively for non-OECD Europe and Eurasia, Africa and non-OECD Americas, they produce the similar levels of energy of 2014. Between 1971 and 2015, world TPES multiplied up to 2.5 times and also changed structure (Figure 2):
Figure 2. Total primary energy supply by fuel [1].
• oil fell from 44% to 32% of TPES. Of the world crude oil production Saudi Arabia, The Russian Federation and the US contributed about 40%;
• natural gas grew from 16% to 22% with the Russian Federation and the US accounting for 40% of the world natural gas;
• nuclear from 1% to 5%, with US and France accounting a combined production of 50% of the global one.
In 2016, production growth of fossil fuels significantly decreased, -1.3% compared to 2015 – Figure 3, although the increase of natural gas production with +0.7%, except in OECD where it was stable at 1 080 Mtoe, and of crude oil with +0.1%. This is mainly due to coal reduction -4.5%, strong in OECD countries (-95 Mtoe) and China (-110 Mtoe).
Figure 3. Annual average change in fossil fuels production by fuel [1].
In fact, power generation from coal decreases for the three last years, reaching 39.3% of the electricity produced globally in 2015 (Figure 4). Although its share of over 40% in 2016., it will be replaced by renewable energy.
Generation from gas grew slowly to reach 22.9% in 2015. The recovery from the declines of the previous two years is due to natural gas-fired power generation in OECD countries (+7.1%) and in US. Conversely in Europe, where the gas generation remains well below its peak in 2008, despite strong growth in 2015 and 2016. Reductions in Japanese and Korean gas-fired power generation led a 5.7% decline in 2015. Outside the OECD, gas generation is estimated to remain strong in 2015 and 2016.
Figure 4. World electricity generation mix 1971-2015 [1].
The share of renewables is about 22.8% in 2016, which initially was dominated by hydropower with around 70%, but recent growth is due to the development of wind, bioenergy and solar PV, with 16%, 9% and 5%. In 2016, a global increase up to 24% of global power output was estimated. Hydropower additions are estimated to have decreased for the third consecutive year since 2013, with fewer projects becoming operational in China (12.5 GW) and in Brazil (5 GW). In 2016, onshore wind capacity grew by 50 GW, about 15% less versus 2015. This decline was mainly due
to China, which connected 19 GW of new onshore wind capacity, significantly less than 32 GW in 2015. The European Union added over 11 GW, led by Germany and France, followed by the US (8.2 GW), India (3.6 GW) and Brazil (2.5 GW). Annual grid-connected solar PV capacity in China more than doubled in 2016 versus 2015, with 34.5 GW becoming operational. In the US, solar PV annual additions doubled, with over 14 GW coming on line in 2016, followed by Japan (7.5 GW). The European Union’s annual solar PV market contracted by a third to 5.5 GW in 2016 as growth slowed in the United Kingdom. India’s annual solar PV additions doubled, with 4 GW.
Nuclear production steadily increased in the 1970s and 1980s, before plateauing at around 17% of world electricity. A decline saw since the 2000s. 2016 brought only 3 GW of new construction, sign of a reduction of the future growth in this sector.
Power production from oil has peaked at almost 25% of power production in 1973, just before the oil crisis, then it reduces less than 5%, becoming the least used.
In Figure 5, the top ten energy consumers at 2015 in terms of TPES are reported. China accounted for 22% of global TPES with 19% of the world’s population while the US accounted for 16%, with 4% of the world’s population. India (18% of population) and the Russian Federation ranked third and fourth, respectively. Japan, the second largest OECD consuming country, was in fifth position. Together, these five countries accounted for more than half the global TPES in 2015. In 2015, the top five countries in terms of TPES accounted for less than half of world population (47% and 45% respectively) but consumed 52% of total world energy.
Between 1971 and 2015, total final consumption (TFC) more than doubled (Figure 6).
Figure 5. TPES-top ten countries in 2015.
Figure 6. TFC from 1971 to 2015 [1].
Energy use in transport significantly increased, from 23% of TFC in 1971 to 29% in 2016. Nevertheless, in industry remained the largest consuming sector, with 37%, followed by the residential sector, 22%. World 37.36% China 21.79% US 16.03% India 6.24% Russian Federation 5.20% Japan 3.15% Germany 2.26% Brazil 2.18% Canada 2.00% 1.98%Korea France 1.81%
Future scenario
For the prevision of 2040, growing energy needs will be satisfied mainly by i) natural gas (up to 45%), ii) the energy efficiency improvements (key factor because without them, the projected rise in final energy use would more than double), iii) use of renewables sources (up to 40%).
In fact, in the New Policies Scenario by 2040, natural gas generation will become the second-largest fuel in the global mix after oil. This will happen in resource-rich regions, such as Middle East by substituting the oil, and in the US, also without national policies limiting the use of coal. 80% of the projected growth takes place in developing economies, led by China, India and other countries in Asia. The competition of natural gas is not just with coal but also to renewables, which in some countries become a cheaper form of new power generation, than gas by the mid-2020s, pushing gas-fired plants towards a balancing rather than a baseload role. Efficiency policies also play a part in constraining gas use: while the electricity generated from gas grows by more than half to 2040, related gas use rises by only one-third, due to high efficiency of these plants. A new gas type is emerging, the US liquefied natural gas (LNG), helping to accelerate a shift towards a more flexible, liquid, global market. Ensuring that gas remains affordable and secure, beyond the current period of ample supply and lower prices, is critical for its long-term prospects. LNG accounts for almost 90% of the projected growth in long-distance gas trade to 2040. The amount of liquefaction sites worldwide doubles to 2040, with the main additions coming from the US and Australia, followed by Russia, Qatar, Mozambique and Canada.
In next future renewable energies will be the least-cost source for power production, covering two-thirds of global investment in power plants to 2040. Rapid deployment of solar PV, led by China and India, helps solar become the largest source of low-carbon capacity by 2040. In the European Union, renewables account for 80% of new capacity and wind power becomes the leading source of electricity soon after 2030, due to strong growth both onshore and offshore. Policies continue to support renewable electricity worldwide, increasingly through competitive auctions rather than feed-in tariffs, and the transformation of the power sector is amplified by millions of households, communities and businesses investing directly in distributed solar PV. Growth in renewables is not only due to the power sector, but also to provide heat and mobility. In Brazil, the share of direct and indirect renewable use in final energy consumption rises from 39% today to 45% in 2040.
Although nuclear production reduction, in this sector, China continues to lead a gradual rise in output, overtaking the US by 2030 to become the largest producer of nuclear-based electricity.
Oil demand continues to grow to 2040, but with a steadily decreasing trend.
The reduction of coal use in power mix is mainly observed in India, by dropping from three-quarters in 2016 to less than half in 2040. Without large-scale carbon capture and storage, global coal consumption unavoidably will stop.
The growing electrification of energy also changes the global energy system, making up 40% of the rise in final consumption to 2040. Such rising is due to several factors: many millions of households add electric appliances (with an increasing of “smart” devices) and install cooling systems; adoption of electric device in supplying heat and mobility; the decarbonising of power supply; the increase of global investments in electricity sectors which overtook that of oil and gas for the first time in 2016. The electrification also explains the reason of industrial initiatives and the policy support, pushing to the global spreading of the electric vehicles (EVs) fleet. (up to 280 million at 2040 from 2 million in 2016.
A significant changing in the energy system, in order to reach a worldwide low-carbon reality, is pursued by China, with emphasis in energy policy on electricity, natural gas and cleaner, high-efficiency technologies. Energy high-efficiency regulation explains also the slowdown of energy demand growth, from less than 2% per year since 2012, to an average of 1% per year to 2040. Without new efficiency measures, end-use consumption in 2040 would be 40% higher. In order to pursue this changing, one-third of the world’s new wind power and solar PV will is installed in China. China also accounts for more than 40% of global investment in EVs and provides a quarter of the projected rise in global gas demand and its projected imports of 280 billion cubic metres (bcm) in 2040 making China one of main country of global gas trade. China overtakes the US as the largest oil consumer around 2030, and its net imports reach 13 million barrels per day (mb/d) in 2040. But stringent fuel-efficiency measures for vehicles (both car and trucks), and a shift which sees one-in-four cars being electric by 2040, means that China is no longer the main driving force of global oil use, growth that instead will be larger in India post-2025. China remains a significant presence in coal markets, but projections suggest a reduction.
The US reach a level 50% of combined production of oil and gas; already a net exporter of gas, the US becomes a net exporter of oil in the late 2020s. The 8 mb/d rise in US oil output from 2010 to 2025 (Figure 7) would match the highest sustained period of oil output growth by a single country in the history of oil markets. Expansion on this scale is having wide-ranging impacts within North America, fuelling major investments in petrochemicals and other energy-intensive industries. By the mid-2020s, the US become the world’s largest LNG exporter.
Figure 7. Oil and gas production in the US [2].
Up until the mid-2020s, oil demand growth remains robust, but then slows markedly, as greater efficiency and fuel switching reduce oil use for passenger vehicles (although, the global car fleet doubles from today to reach 2 billion by 2040). A significant influence from other sectors, as petrochemicals, aviation and shipping, supports the oil demand up to 105 mb/d by 2040. In the late 2020s, the switch to electric cars could lower oil prices lower. Energy policy support a rapid expansion in the global electric car fleet, approaching almost 300 million cars by 2040 (Figure 8). Although the growing electrification of energy in India and Indonesia, with over 100 million people/year have gained access to electricity since 2012, around 675 million people – 90% of them in sub-Saharan Africa – remain without access to electricity in 2030 and 2.3 billion continue to use biomass, coal or kerosene for cooking. Household air pollution from these sources is currently linked to 2.8 million premature deaths per year, and several billion hours are spent collecting firewood for cooking.
Figure 8. Electric car fleet, 2016-2040 [2].
Policy attention to air quality is rising and global emissions of all the major pollutants reduce in 2040 (Figure 9, left), but their health impacts remain severe. Premature deaths worldwide from outdoor air pollution rise from 3 million today to more than 4 million in 2040 in the New Policies Scenario, even though pollution control technologies are applied more widely and other emissions are avoided, because energy services are provided more efficiently or (as with wind and solar) without fuel combustion.
Figure 9. Change in air pollution emissions by region (left), three speeds of CO2 emissions in the New Policies Scenario (right) [2].
Global CO2 emissions increase slightly to 2040 in the New Policies Scenario. This outcome is far from enough to avoid severe impacts of climate change, but there are a few positive signs. Projected 2040 emissions in the New Policies Scenario are lower by 600 million tonnes than the last year ones (35.7 Gt versus 36.3 Gt). In China, CO2 emissions are projected to plateau at 9.2 Gt by 2030 before starting to reduce (Figure 9, right). Worldwide emissions from the power sector are limited to a 5% increase between now and 2040, also if electricity demand grows by 60%.
Sustainable energy development
Key elements to achieve a sustainable economic-energy development are the climate stabilisation, cleaner air, universal access to modern energy and also the reducing energy security risks. Fundamental to these elements is i) the maintaining of the world average temperature rise well below 2°C as a long-term goal; ii) the limitation of the increase to 1.5°C, since this would significantly reduce the risks and impacts of climate change; iii) the achievement of a peak in global CO2 emissions as soon as possible, for then proceeding to a rapid reductions in accordance with the
most advanced scientific solutions available (actions consistent with the Paris Agreement (December 2015)).
To pursued the decline in CO2 emissions and limit climate risks further, in the Sustainable Development Scenario, low-carbon sources double their share in the energy mix to 40% in 2040, all avenues to improve efficiency are pursued, coal demand goes into an immediate decline and oil consumption peaks soon thereafter. Power generation is all decarbonised, based by 2040 on generation from renewables (over 60%), nuclear power (15%) as well as a contribution from carbon capture and storage (6%) – a technology that plays an equally significant role in cutting emissions from the industry sector. EVs are more and more significant at this aim, but decarbonising of transport sector also requires much more stringent efficiency measures, particularly for road transport. In this scenario, renewables and efficiency are the key mechanisms to drive forward the low-carbon transition and reduce pollutant emissions. The provision of highly efficient appliances, combined with decentralised renewables, also play a major role in extending full access to electricity and clean cooking, especially in rural communities and isolated settlements that are hard to reach with the grid.
As oil and coal use reduces, and renewables strongly increase, natural gas becomes the largest single fuel in the global mix in the Sustainable Development Scenario. Anyway, securing clear climate benefits from use of natural gas depends on carried out action to minimise the losses of methane – a potent greenhouse gas – to the atmosphere. Consumption of natural gas rises by nearly 20% to 2030 in the Sustainable Development Scenario and remains close at this level to 2040. The contribution of gas varies widely across regions, between sectors and over time in this scenario. In energy systems heavily depending on coal (as in China and India), where renewable alternatives are less readily available (particularly in some industrial sectors), or where seasonal flexibility is required to integrate high shares of variable renewables, gas plays an important role. Reducing the methane losses is essential to support the environmental case for gas: these emissions are not the only anthropogenic emissions of methane, but they are probably among the cheapest ones to abate. The cost analysis of abating of methane, suggest that 40-50% of the yearly total methane emissions (76 million tonnes/year) in oil and gas operations, can be mitigated at no net cost, because the value of the captured methane could cover the abatement measures. Implementing these measurements could have the same impact on reducing the average global surface temperature rise in 2100, as closing all existing coal-fired power plants in China.
1.2 Energy consumption in buildings
During the past decades, several countries focused on improve building energy performance, but average energy consumption per person in the global buildings sector still remains practically unchanged since 1990 at just less than 5 MWh/year per person [3], with a total energy consumption representing almost one-third of global final energy consumption. As a result of increasing floor area growth, buildings final energy consumption grew steadily from 33055 TWh in 2010 to 34444 TWh in 2016. The global equivalent CO2 emissions related at this consumption accounts for nearly 20%. Building sector reached in 2013 a peak of 9.5 GtCO2-eq decreased to 9.0 Gt in 2016, therefore, building consumption reduction will play a critical role in achieving the goal stated by the Paris Agreement to remain well below 2°C. Anyway, the growing population, as well as rapid growth in purchasing power in emerging economies and many developing countries, suggest that energy demand in buildings could increase by 50% by 2050 [4].
In OECD countries, average energy consumption per person started to fall from a peak of 12 MWh in 2010, but this decline may be partly explained by warmer winters in recent years, as space heating accounts for 45% of OECD building final energy use. A significant impact to the energy consumption increase is also due to the global use of electricity in buildings, grew on average by 2.5% per year since 2010, and in non-OECD countries increased by nearly 6% per year.
The energy consumption is subdivided as reported in Figure 10, corresponding to 11.8 petawatt-hours [P1Wh] for heating (56%), 5 PWh for hot water (23%), 2.6 PWh for lighting (12%) and 1.8 PWh for cooling (9%) [5].
Figure 10. Building energy consumptions.
Energy demand for lighting and space cooling in buildings grew considerably over the last decade, particularly due to improved access to electricity, increasing of families wealth and demand of thermal comfort, resulting in greater energy demand in developing countries. Globally, cooling and lighting demand both grew by roughly 2% per year since 2005, while in non-OECD countries the average annual growth rate was more than 5% [6]. Globally growing is of 50% between 1990 and 2016. Space heating and hot water energy demand grew at a slower rate, about 0.5% per year since 2010. This lesser rate is due in part to shifts away from traditional use of biomass in non-OECD countries, while energy efficiency progress (e.g. condensing boiler and heat pump adoption in many OECD countries) also helped to improve energy demand in those end uses. One major change expected is a shift from heating to cooling demand. In fact, whereas there are important challenges and actions to improving building heat demand in most developed economies, space cooling demand will rise steadily nearly in all regions, and in particular in rapidly emerging economies with warmer climates Figure 11. Decisive policy action aiming at reducing the overall primary energy consumption in buildings is needed, in order to improve global average energy use per person by at least 10% by 2025 using energy-efficient and low-carbon building technologies. In this sector, some progress has been seen since the Paris Agreement in 2015, with nearly 90 countries, 3 000 city-level and 500 private sector building commitments, industry and professional bodies have mobilised to support high-performance buildings, including initiatives to implement net-zero/carbon-neutral building programmes. Therefore, thanks to continued adoption and enforcement of building energy codes and efficiency standards, global buildings sector energy intensity (measured by final energy per square metre) is reduced by 1.3% per year between 2010 and 2014. 1 1 PWh = 1 million of GWh or 1 000 TWh 56% 23% 12% 9% Heating Hot water Lighting Cooling
Figure 11. Projected global energy demand for heating vs cooling [5].
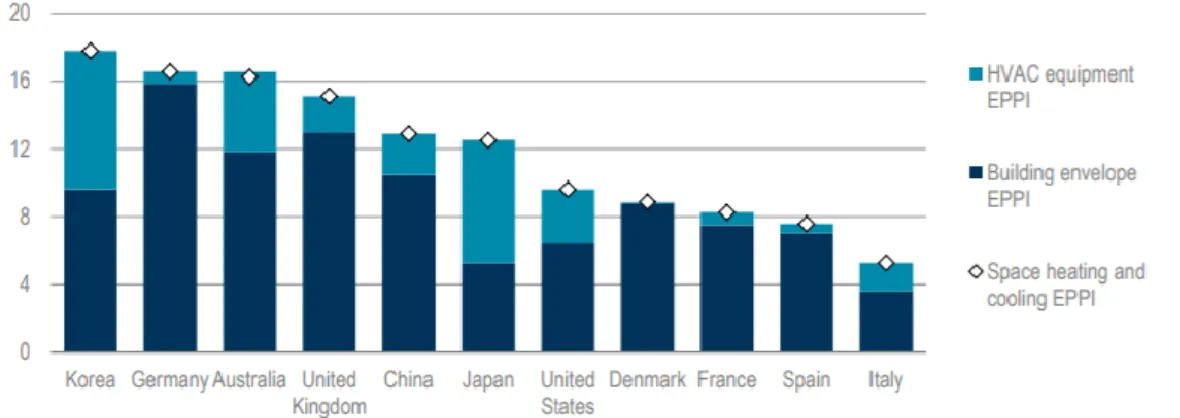
Progress on energy efficiency policies for buildings continues to increase, though the share of progress on building envelopes and heating, ventilation and air conditioning (HVAC) equipment. For example, in some countries, such as Denmark and Germany, building envelope policy has been the key driver for policy progress, while in other countries, such as Japan and Korea, HVAC equipment has been a key driver (Figure 12).
Figure 12. Share of space heating and cooling efficiency policy progress since 2000 from building envelopes vs. HVAC equipment [7].
A combination of both envelope and equipment policies is critical for the transition to sustainable buildings. Highly efficient building envelopes enable the use of higher-efficiency equipment and energy sources, such as low temperature waste heat, heat pumps and renewable energy.
Energy efficiency in buildings is reached through the development of new policy codes for efficient buildings in several parts of the world. Mexico took two major steps in the last year, including publishing the first national building energy efficiency code in collaboration with the International Code Council, and launching a building energy code roadmap that provides national targets in three-year increments to 2050. California is leading the way in the US, with the latest 2016 Building Energy Efficiency Standards. On 19 June 2017, India released a national model code that can be adopted and enforced by state and local governments to improve the efficiency of non-residential buildings.
Further efficiency improvements of 10-20% are available in most countries from products already being sold in the market, including energy savings of over 75% by switching from halogen lighting to LED lighting. The market for efficient lighting will continue to grow and 90% of all
indoor lighting will be efficient by 2022, due to a combination of improved policy and decreasing cost of efficient lighting.
More energy can be saved by switching between types of water heater, by increasing the efficiency of each equipment type; heat pumps enable energy savings of 60% to 85% compared with typical instantaneous and storage heaters. Japan’s Top Runner programme and Australia’s white certificate schemes have enabled the water heating markets in both countries to have increasing sales of highly efficient heat pumps, with over 500 000 heat pump water heaters sold in Japan alone each year. Heat pumps are increasingly recognised as a solution for many building energy needs. For years, less sophisticated heat pumps did not efficiently operate in cold climates. Conversely, today heat pumps can operate much more efficiently with a heating capacity output higher than 70% in temperatures of -25°C. Cold climate heat pumps could shift significant portions of global heating energy use away from less efficient electric and fuel heating systems in mixed and cold climates. In district energy systems, large-scale heat pumps are improving the efficiency of space heating, water heating, cooling and refrigeration. Heat pumps are an increasingly cost-effective way to meet both energy efficiency targets and countries’ emissions reductions targets.
Two key international agreements – the Paris climate change agreement and the Montreal Protocol on ozone depletion – are targeting energy efficiency in buildings as a means to achieve broader goals. The result could be a significant boost for energy efficiency efforts worldwide. The launch of the Global Alliance for Buildings and Construction (GABC) at the COP21 climate summit in 2015 and the Kigali Amendment to the Montreal Protocol in 2016 have motivated funders and other interested parties to support efforts to increase energy efficiency [7].
Energy efficiency efforts are being added to the existing Montreal Protocol network due to the Kigali Amendment to reduce the use of ozone depleting hydrofluorocarbons for cooling, the fastest growing end-use in buildings, To follow the efficiency target, the rate of annual building energy renovations also needs to improve considerably, from rates of 1% to 2% of existing stock per year today to more than 2% to 3% per year by 2025 [8].
Chapter 2 Building Integrated Solar Thermal Systems
In UE, the building sector accounts for approximately 40% of the total end use of energy and it is responsible for more than 30% of greenhouse gas emissions in OECD Countries [9]. At the same time, residential and commercial buildings show a high potential of energy savings, which may contribute to a wide reduction of global energy consumptions. To this scope, developed Countries are promoting building energy efficiency policies and their implementation through efficient, affordable, and high impact technologies. As a consequence of the recent global agreements regarding the reduction of climate changes, new and more challenging goals for pollutant emission and energy consumptions are being established [9]. In Europe, such targets mainly regard the greenhouse gas emissions reduction, the energy efficiency improvement and the renewables share (20% by 2020 and 27% by 2030).
In this framework, the European Directive 2010/31/EU for building energy efficiency promoted the development of building effective energy options based also on renewable energy applications [10]. Among the available renewable technologies, those based on solar energy are considered among the most promising for energy saving and carbon emissions reduction. The solar source can be suitably exploited through suitable Solar Thermal Collectors (STC) and PhotoVoltaic (PV) panels, which today are the most practical options for the building applications of renewable energy sources. Anyway, such devices are usually installed on building roofs without to be architectonically integrated into the building envelope (standalone configuration). In order to increase the application of solar energy in buildings, as required by Energy Performance of Buildings Directive (EPBD), aiming at obtaining buildings with a nearly zero energy consumption (for public buildings by 2018, and for commercial and residential buildings by the year 2020), the architectonic integration of solar systems into building elements (roofs, façades, windows, tiles, balcony railings, sunshades and sunscreens, etc.) is more and more diffused. In fact, in EU Countries, the Building Integration of Solar Thermal Systems (BISTSs) is often recommended or mandatory for new buildings in order to address both the functional and aesthetic aspects [11]. In the next future, building envelop elements will be required to be partly or totally replaced by the solar energy system components (integrated in building opaque and transparent / semi-transparent façades, double skin façades, sunshades and sunscreens, balcony, etc.).
BISTSs (e.g. BISTC, BIPV panels, BIPVT collectors, etc.) represent a valuable and effective measure to help and achieve the energy efficiency goal, by cutting energy consumption in buildings while boosting the share of renewables, also required by the nearly zero energy building target [12]. These are a valid option for increasing the energy performance of the building, by satisfying the building heating, cooling and domestic hot water requirements and by also having an aesthetic and functional role. In this contest, the functionality is in the thermal and acoustic insulation, shading, construction stability, and means that a BISTS is not just an added element, but it replaces the building element (for example the roof) and its dismounting expects that the building element will be totally or partly replaced by conventional building component. In addition, a building integration of a solar system consists also of a design improvement by giving to the building a more elegant look by achieving an aesthetic harmony with the building architecture [13]. Therefore, size, shape,
colour of BISTS are significant elements which must be taken into account. In addition, integration leads also to reduce the need of land and the related costs as well as for solar collectors support structures or of several building elements, such as tiles and cladding elements.
Aim of this chapter is to briefly present the state of the art of BISTSs, which include BISTCs for heat production, BIPV panels for electricity production, and BIPVT collectors for combined production of heat and electricity.
In particular, special attention in this work thesis was paid to BIPVT collectors, technology investigation. In addition, in this chapter, literature works concerning the simulation and experimentation of such systems, are also reported.
Therefore, by reading this chapter it is possible to understand how this integration occurs and which are the consequences on the building-plant performance.
A very significant issue of the BISTSs, in the framework of the evaluation of the building-plant performances, concerns the passive effects of such systems on the energy demand of the building for space heating and cooling.
In particular, as for the conventional stand-alone solar systems (no integrated in the building), the useful outputs of the BISTSs (electricity and/ or heat) are used to satisfy the energy demand of the building by reducing the energy demanded to the conventional systems. These are simply the active
effects of their function, certainly useful and positive, on the building energy demand. But, the
evaluation and the analysis of their passive effects are equally important and can be observed only performing a global evaluation of the whole building-plant system.
The passive effects come from the contact of the back surface of the collector (PV panel, PVT collector or STC collector) with the external surface of the roof and/or façade of the building. In particular, this contact leads to a useful passive effect during the winter season, and to an unwanted passive effect during the summer season, due to the fact that the back surface temperature of the collector is averagely higher than the outdoor air temperature where the building is located. The higher temperature of the external surface of the building results in a higher mean radiant temperature of the internal surface, which, in turn, decreases the space heating demand and increases the cooling one. About how much the unwanted summer overheating effects are higher / lower than the useful winter ones, depends on the considered weather location, thermal features of the building, heat transfer fluid, etc. Note that the unwanted summer effect is practically certain in the case of water as heat transfer fluid. In case of air systems, the summer effect could be also useful in term of reduction of the cooling energy. This depends on the flux of the air flowing through the cavity. In fact, for systems adopting the forced convection (ventilated façades) a cooling positive passive effect of the building is obtained. In this thesis the evaluation of the passive effects of BISTSs was deeply investigated, by evaluating also how the magnitude of these passive effects is affected by some design parameters of the building envelope, in order to obtain interesting guidelines for the design of such innovative systems.
2.1 Classification, description and application of BISTSs
BISTSs can be classified across a range of operating and system features and layout details. Anyway, the main classification criterion of all solar thermal systems, and therefore, also of the BISTSs, is based on the type of the adopted heat transfer fluid (air, water, water-glycol, oil, etc.) and the final use of the collected energy (Domestic Hot Water, DHW, production and/or space heating & cooling, electricity and/or process heat production, etc.). In Figure 13 a simple BISTSs classification scheme is reported.
Figure 13: Building Integrated Solar Thermal Systems classification
2.1.1 Domestic hot water production
A popular application of BISTC and BIPVT collectors is the production of DHW, typically at 50-60°C. The key element for this application is classically a flat plate or a vacuum tube collector with water as the Heat Transfer Fluid (HTF). Often as HTF is adopted air, by using an air-to-water heat exchanger. A suitable thermal storage tank (typically, 150 to 400 l for a single-family), installed between the solar collector system and the user is often implemented. An auxiliary heating system is always used to guarantee the DHW production in case of scarce (or absence of) solar radiation.
HTFs are transported either naturally (passive systems) or by forced circulation (active systems). Natural water circulation occurs by natural convection in thermosiphon systems or in Integrated Collector Storage (ICS) system. In thermosiphon system, the hot water naturally rises to the top of the water storage tank and returns from the tank bottom to the solar collector as inlet fluid. In the ICS, the water storage (50-100 l/m2) is included into the collectors, by obtaining an optimal configuration in case of façade or roof integration. In case of forced circulation systems, pumps or fans are used. Forced circulation can be open or closed. The first possibility allows one to use water as HTF without the problem of freezing of cold climate operation, since during night time the collectors are drained of the water which is stored into a suitable vessel.
In the close circulation, the fluid of collector loop is normally pressurized, so that to increase its boiling temperature, and therefore, the system operating temperatures. Anyway, the fluid is always in the collector, and therefore, a freezing protection is necessary. One option is the use of water-glycol mixtures as HTF (passive freezing protection). Note that such mixture has a lower freezing point (depending on the glycol concentration).
Another option is an active freezing protection, where circulating water in the collector field in winter time is heated by an auxiliary heating system or by the hot water from the storage tank. A further important issue to be considered for the health of the users is due to the legionellae problem occurring when water temperatures are around 30-35°C. This is avoided by a regularly heating of the stored water for a short period of time (about 30 mins) above a critical temperature (about 50-70°C for legionellae), by preventing excessive bacteria population growth.
Building Integrated Solar Thermal Systems (BISTSs) Building Integrated Solar Thermal Collectors (BISTCs) Water heating -space heaing -space cooling -DHW Air heating - space heating/ventilation - heat process -DHW Building Integrated PhotoVoltaic Thermal collectors (BIPVT) Building Integrated PhotoVoltaic panels (BIPV) Electricity -space heating / cooling -electric devices
2.1.2 Space heating and ventilation
BISTSs offer a wide range of system configurations for space heating applications. This technology results to be useful to reduce the energy demand of the building for space heating (active
effect), but also to reduce the peak load of the conventional heating system. This last function is due
to the useful passive effect of the integration of the solar system into building element. Note that this positive contribution to the reduction of the energy consumption for space heating is obtained although the seasonal mismatch between the heating season and the maximum heat production from the solar system (occurring during the summer season)
Between the several configurations, for example, BIPVT or BISTC collectors may be used as
active solar systems for space heating production by using water or air as HTF.
In case of water as HTF, the basic configuration consists of BIPVT or BISTC collectors coupled to a water heat storage which supplies HVAC systems (fan coil unit, radiant floor system, air handling units, etc.)
In case of air as HTF, BIPVT or BISTC, coupled to an auxiliary heated air system, can be used to preheat the fresh air or (Figure 14), in case of air production at high temperature, directly used to provide space air heating and/or ventilation to the building.
Figure 14: Solar air heating façade BISTS with auxiliary heating system.
The collector outlet air can be used to provide heat to other traditional building heating systems (e.g. heat pumps), by increasing their operational energy efficiency.
Another potential solution to reduce the space heating load of the building is represented by
passive solar systems, like solar collector-storage walls, direct-gain windows or sunspaces [14],
where solar gains are captured directly by the building structural elements.
Collector-storage walls consists of a single glazing layer covering the external walls of buildings. The efficiency of such technology is limited by the high thermal losses, therefore, to avoid them, Transparent Insulation Materials (TIMs) were developed (since ´80). With a transparent insulating element covering the outside of a massive wall, this portion of the building can be converted to a large solar wall heating area. Solar energy is converted to heat at the absorber and conducted with a time delay of some hours - depending on thickness and type of building material - through the massive wall to the indoor space. Windows and solar walls with transparent insulation operate differently with respect to the solar radiation, as the direct solar gain through the window can be of use immediately, whilst the indirect gains from the solar wall reaches the space to be heated a number of hours later, thereby extending the passive solar heating period considerably.
The most cost effective and widely deployed passive system is the direct-gain window. Solar radiation enters a room and is converted to useful heat by being absorbed by the building structure.
Most traditional buildings use windows, but the aim for which they are designed and included into external façades is only for obtaining the daylight and visual contact with the external environment, by neglecting their significant function with respect to the solar gain. These solar gains are, therefore, normally neglected in statistics relating to renewable energy contributions.
Often the needs of the space heating are well suited to the ventilation needs. In fact, as it is well-known, in order to provide fresh air for the occupants and guarantee acceptable indoor air parameters (oxygen, CO2 and moisture), the building needs to be ventilated by exchanging indoor air with the outdoor one. In many climates, it is necessary to heat this ventilating air prior to its supply into the building. This air may be preheated by a solar thermal system in order to reduce the building heating load. Unglazed façade collectors are an interesting option and many examples especially for commercial and industrial buildings exist. The systems may be combined with heat recovery heat exchangers to provide additional heat to the fresh air supply stream from the building exhaust air stream. The Solar Wall® is a perforated wall used as a solar absorber. Air flowing through the wall is heated during the solar collection mode and can be used in conjunction with the building ventilation system. The same systems operating at night can be used for building cooling.
2.1.3 Cooling
In cooling dominated climates buildings, BISTSs are very promising, since they can also extract heat from buildings. However, this depends on the kind of BISTS technology, the adopted HTF, the operating temperatures, but undoubtedly on the weather location where the building is located.
Generally, as above-mentioned, a passive effect of the BISTSs on the energy demand for space cooling is the overheating of the indoor space, caused by the higher temperature of the internal surface where the STSs is integrated. This is an unwanted negative passive effect occurring in summer season.
Anyway, BISTS are implemented also for the purpose of cooling the building by applying several methods, which are both passive, as shading elements, ventilation, night-time radiation cooling, or active, supplying heat directly to ‘sorption’ equipment. This last application can be a promising solution for space cooling purposes, since during the summer season cooling energy demands are typically simultaneous to the solar radiation. This is based on the technology of Solar Cooling using absorption [15], adsorption [16] or desiccant evaporative [17] cooling (DEC) systems, according to the level of the obtained solar collector outlet temperature.
Absorption chillers are commonly used in combination with high temperature solar collectors [18] (evacuated tube or concentrating solar collectors), capable to provide relatively low (80-95°C) [19] or high (> 130°C) [20] driving temperatures. In this last case, it is possible to use double effect absorption chillers, with Coefficient Of Performance (COP) higher than 1. Low temperatures (45-65°C) can be obtained by flat-plate PhotoVoltaic - Thermal (PVT) collectors [21], which can drive adsorption chillers [22], increasing the range of applications of SC systems [23]. Anyway, lower temperatures influence the chiller COP. Typically, the COP of an adsorption chiller with heat supplied from flat plate solar collectors is around 0.5-0.6.
In case of DEC systems, the solar energy is used to regenerate a desiccant material that dehumidifies moist air by vapour adsorption; the resulting dry and warm air is cooled in a sensible heat exchanger and then in a direct evaporative cooler.A disadvantage of DEC systems is the high consumption of the water that occurs in system. However, the required heat temperature in such systems is low and can be easily supplied by flat plate solar collectors.
2.2 BIPVT (Building Integrated PhotoVoltaic and Thermal collectors)
Among the available solar technologies, nowadays the combination of STCs and PV panels (i.e. BIPVT system) represents the most interesting application for the building integration. Their integration occurs into different traditional building envelope components (tilted roof, flat roof, skylight, façade cladding, façade glazing) which have constructive and functional capacity. Therefore, these systems are not simply added to the building (BAPVT ‐ Building Added PVT systems), but they are designed to displace traditional building components totally or partially, assuring a cross-functional role. For example, a BIPVT skylight is considered to be part of the building envelope, a solar generator of heat and electricity, and a daylighting element. The advantages of BIPVT systems are numerous:
1. BIPVT systems are capable to simultaneously produce useful low temperature thermal energy and electricity [24] used to balance the building demand of the related electric devices (heat pumps, electric heaters, lights, etc.);
2. BIPVT systems can be used as complimentary exterior building material and component solutions; with respect to stand-alone applications,
3. BIPVT systems potentially reduces the building construction capital cost, including land costs for ground-installations;
4. BIPVT systems are able to solve the issue regards the competition for suitable roof or façade area between STCs and PV panels.
However, the BIPVT systems have certain disadvantages that must be taken into account: 1. The orientation of the BIPVT systems is not always the optimal one (conversely, selected for the stand-alone PVT collectors). The selected orientation depends on the orientation of the available free surface where the PVT systems are integrated.
2. The tilt of the BIPVT systems is not always the optimal one. For example, in case of vertically aligned BIPVT collectors (integration into the building façade), the solar incident angle is not optimal, especially during the summer season when the sun is relatively high in the sky
3. The area of the BIPVT systems depends on the free surfaces available on roofs and façades. Regarding the 4th point, the solution of the BIPVT collectors can offer an alternative option for the production of solar thermal heat at levels similar to conventional STC and generate electricity similar to standard PV panels. Anyway, careful design is necessary as the thermal applications often require higher operating temperatures, whereas the PV module efficiency drops with increasing temperature. In residential applications (where low-temperature heat is required), the thermal energy obtained by a BIPVT system is delivered to users through a suitable working fluid and it usually exploited in different ways, as for example: i) for supplying Solar Heating (SH) [25], Solar Cooling (SC) [26] and Solar Heating and Cooling (SHC) systems [27]; ii) for preheating heat pumps water-sources [28]; iii) for DHW preparation [29].
BIPVT collectors can be divided into air or water types, according to the thermal fluid used to remove the heat from the BIPV panel. The choice depends upon the mounting location and its application, varying according with the building demands (space heating, DHW) and/or with strategies for enhancing the module efficiency (cooling, ventilation). For residential applications, the most used BIPVT system is the water cooled one, due to the possibility to utilize the obtained thermal energy for DHW preparation, instead for space heating application, the most commonly used BIPVT is the air cooled on. In this application, the air directly cools the PV cells by flowing
through the cavity behind the PV panel with a twofold benefit: the air preheating by heat recovery and the PVT collector cooling. With this last aspect in mind, the common approaches to mitigate/reduce the BIPVT temperature fall in two categories: natural ventilation and active heat recovery [30] or forced/mechanical ventilation. This positive cooling effect of BIPVT collectors leads also to higher electric efficiencies compared to those reached by BIPV panels (because of lower operating temperatures of the PVT cells) [31] and the simultaneous production of low-temperature heat and electricity . In fact, it is well known that the PV electric efficiency decreases in case of high PV operating temperatures. In case of BIPV, the PV operating temperature may significantly increase with respect to a stand-alone one [32]. The heating effect is determined by the reduction of the back losses due to the PV installation within building envelope. Note that the passive effect of the integration on the indoor spaces is different by comparing both the systems, BIPV panels and BIPVT collectors, in summer and winter seasons. In fact, for the first system, without any air cavity between the PV panels and the external surface of the building, all the heat is transferred to the building with the consequential increase of the indoor air temperature. This effect is positive/useful during the winter season and negative/undesired during the summer one. The undesired effect may be mitigated using a BIPVT collector, in order to extract the heat from the whole building-plant system with air or water.
Although BIPVT collectors, as well as all the BISTSs, have been used since decades, they are still far from a massive commercialization, due to their technological and economic issues (e.g. perceived low reliability, lack of pre-packaged fully-integrated for plug-and-play installation, lack of well-validated design tools with multiple capabilities) [33]. Therefore, the development of new techniques for their building integration, emphasizing their active and passive effects on the overall building energy demand, is crucial in order to promote the utilization of such technology [11].
2.3 BIPVT system experimental and simulation studies
In the last decades, both from numerical and/or experimental point of view, a number of studies focused on different aspects of BIPVT collectors. A detailed discussion of such applications is reported in several review papers, such as [34, 35]. From the experimental point of view, several analyses on BIPVT systems were completed with the twofold aim to aid the design of prototypes and to validate the developed simulation models, also useful for assessing the BIPVT systems performance [36]. Instead, from the numerical point of view, the majority of simulation papers available in literature (carried out through several commercial and suitably developed dynamic energy performance simulation models) is focused on several thermal and electric aspects of roof and façades integration of PVT collectors (i.e. the most common applications of this technology [33]), by analysing the active effect of the building integration on the building energy consumptions and on the electricity and heat production of these collectors.
This section aims at presenting the current literature works concerning the study of BIPVT collectors, by focusing on both experimental works and simulation ones. After this detailed review (subsections 2.3.1 and 2.3.2) concerning the state of the art of the BIPVT collectors, the main lack of the knowledge about this topic will be highlighted and listed (subsection 2.3.3), from a positive and critical perspective, also in order to clarify the aims of this thesis.
2.3.1 BIPVT experimental works
The available experimental studies are related to both small scale indoor [37] and large outdoor [38, 39] applications, and real scale experimental buildings [40].
In reference [37], the tests performed on a module of a double-skin PVT façade (Figure 15) by transient indoor and outdoor measurements is discussed. This consists of a vertically placed monocrystalline PV panel (1.50 m × 0.99 m), with an air–gap in-between. The external heating of the panel is achieved by means of four 500 W halogen lamps. Although the aim of this work is to study a BIPV system, any building wall part is taken into account. Instead, the attention is focused on air flow and heat transfer coefficients calculation in the cavity, and its modelling in ANSYS CFX environment. Three characteristic modes of operation have been dealt with: Mode 1 with cooling by natural convection and Mode 2 and 3 with fan cooling with forced convention, flow rate 110 m3/h and 190 m3/h fans were tested, respectively. The results achieved by Computational Fluid Dynamics (CFD) computation are summarised in Table 1. In natural convection case for the indoor test with heated PV panel, an average value of h = 3.7 W/m2K is obtained, which amounts to a Nu = 21. The same computation for the respective outdoor test (different panel temperatures and air inlet conditions) gives h = 4.1 W/m2 K. Significantly higher convection coefficients are predicted for outdoor tests with the low or the high capacity fan (10.4 and 10.6 W/m2 K, respectively).
Figure 15. Experimental layout [37].
Table 1. Comparison of average values of wall heat transfer coefficients computed by CFD.
Test conditions Wall Heat transfer coefficient (W/m2K)
Natural convection INDOORS 3.7
Natural convection OUTDOORS 4.1
110 m3/h fan OUTDOORS 10.4
190 m3/h fan OUTDOORS 10.6
Koyunbaba et al. [38] validated their simulation model with the experimental results of a model BIPV Trombe wall built in Izmir, Turkey. The system consists of 4 semi-transparent PV modules (each one 0.50 m wide, 2.56 m high and 1.00 m) having nominal power of 27 W each, with an air gap of 0.50 m. The system has two opened vents when the air temperature in the inter-space is higher than the indoor air temperature. The cold indoor air leaves the room from the bottom air vent while the hot air in the cavity is transferred to the room from the top air vent. The air flow in the
inter-space is driven based on thermosyphon effect which helps removing heat from the PV module and the thermal mass. The vents are closed when the indoor air temperature is higher than the inter-space temperature to prevent reverse air flow at night. They performed an energy transient analysis aiming at determining the BIPV Trombe wall performance, integrated to the façade of a room. CFD was applied to predict the temperature and velocity distribution in the test room model. The simulation results and the measured values (in days of February 4–7, 2008) of surface temperatures of PV module and outlet air temperatures (Figure 16), as well as the thermal wall/ indoor/ inter-space/ inlet temperature, were compared and it was observed that they are in good agreement. The experimental results also show that 10% of solar radiation transmittance was supplied by using a semi-transparent amorphous (a-Si) solar cell. Thus, an increased thermal energy input to the system is obtained compared to other BIPV systems. Meanwhile, the experimental daily average electric and thermal efficiency of this system can reach 4.52% and 27.2%, respectively. In addition, as well known, it is resulted that as the surface temperature of the PV module decreases, the electric efficiency increases.
Figure 16. Experimental and simulation results of PV module and outlet air temperatures [38]. Natural convection inside the air gap of BIPV-PCM device was experimentally and numerically investigated by Aelenei et al. [41]. A suitable prototype (0.73 m×1.75 m, Figure 17), was installed on the main façade of SolarXXI office building in Lisbon in January 2013.
Figure 17. Prototype (left) system configuration (right).
It consists of a PV panel and an inner gypsum layer (incorporating PCM). When prototype is exposed to sunlight, PV panels absorb solar radiation and generate heat, which is then stored by the PCM gypsum layer. During the night, the melted PCM solidifies and delivers the heat back keeping the system warm for a longer period of time. The system is designed to be integrated within the
building envelope and store the thermal energy directly into the building wall structure. The external and internal frame of the prototype is equipped with a ventilation system that can provide, if necessary, indoor or outdoor ambient air into the gap. Calculated thermal and overall (electric and thermal) efficiencies are about 10 and 20%, respectively.
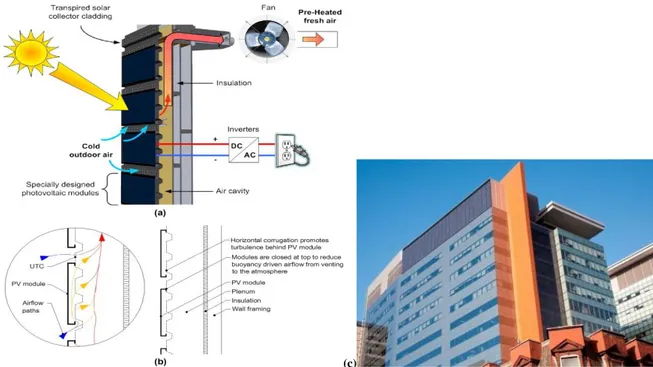
The combination of BIPVT and Unglazed Transpired Collector (UTC) systems for building façades is investigated in reference [40]. The basic concept of this system and the demonstration project located on the roof of a full-scale office building in Montreal (Canada), are depicted in Figure 18. Here, polycrystalline PV panels are attached on 70% of top surface of a UTC (black galvanized steel with horizontal corrugations) by achieving a BIPVT system. The horizontal corrugation of UTC was chosen to facilitate the closing of a gap between the upper frame of the PV panel (Figure 18 b) and the UTC, in order to reduce heat losses by natural convection, while inducing turbulence behind the panels and increasing the mixing vs. vertically oriented corrugations.
(c)
Figure 18. a) BIPVT system and (b) detail showing attachment of PV modules and airflow paths around the bottom frame of a PV module and into the transpired collector (c) BIPVT
demonstration project [40].
The heat extract by BIPVT system may be utilized for space heating or possibly to heat water through a heat pump or air-to-water heat exchanger. The experiment carried out in this work aims at comparing the performance of: i) UTC and ii) innovative BIPVT system. In Figure 19, the experimental results obtained regarding the UTC thermal efficiency, combined BIPVT efficiency (thermal plus electric) and equivalent thermal BIPVT efficiency (thermal plus electric multiplied by heat pump COP equal to 4) as a function of mass flow rate, are reported. Note that the reported results are the average among the 30 min data collected for each flow rate between 1130 h and 1330 h, local time. BIPVT system equivalent thermal efficiency varies from about 50 to 63% and it is about 17% and 7% higher than that of the UTC at the low and high flow rate, respectively. This is because the electricity produced at all flow rates is relatively constant, and in turn, when converted into an equivalent thermal energy, represents a more significant portion with respect to the actual
thermal energy at low flow rates. Authors state that an annual energy analysis is required, taking into account that the produced heat is useful throughout the year or in the heating season only.
Figure 19. UTC thermal efficiency, combined BIPVT efficiency (thermal plus electric) and equivalent thermal BIPVT efficiency as a function of mass flow rate [40].
On real scale experimental buildings, influences of BIPVT system configurations on the thermal and electric performances were also experimentally assessed for different roof integration layouts [42] and air gap heights [43]. For example, in reference [42] a full scale test of a new solar collector (flat heat pipe) was carried out in Cardiff, UK. Three identical systems, were simultaneously compared: i) a solar/thermal; ii) uncooled PV and iii) PVT system. The novel flat heat pipe collector, named “heat mat” (Figure 20), was designed and built to be integrated into roof buildings and to become an energy-active system, by producing electricity and heat for the building. The tests showed that the thermal efficiency of i) and iii) configurations are around 64% and 50%, respectively. This is due to the higher reflection by the glass cover of the PV layer. The effect of cooling in configuration iii) leads to an increase of 15% of the electric efficiency with respect to the one of configuration ii), as well as a reduction of the temperature, varying between 28 and 33°C vs. 40 and 58°C of configuration ii.
Figure 20. The heat mats' based solar roof installation [42].
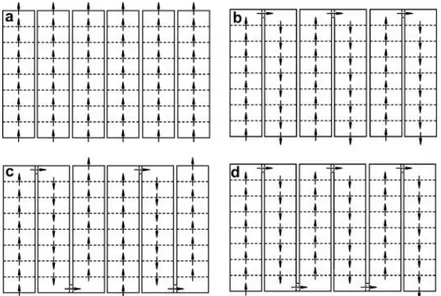
D’Orazio et al. [43] analysed the performance of three mono-crystalline silicon cells PV modules installed in a real scale experimental building over a traditional clay tile pitched roof in Italy. The analysed configurations (Figure 21, above) are the following: Type A, fully integrated PV module installed at the same level of the roof covering with an air gap of 0.04 m between panel and insulation; Type B, partly integrated PV module installed over the roof with an air gap of 0.2 m
between the panel and the tile covering; Type C, fully integrated PV module mounted directly in contact with roof insulation.
Figure 21. PV modules (above) and stratigraphy of the roofs with the measurements probes (below) [43].
Aim of this work is the comparison between different air gap heights on the performance of the analysed PV modules. Anyway, it is worth to note that: i) the roofs are different from each other due to the presence of a ventilation duct between the traditional clay tile covering and insulation (A and B roofs are ventilated, while C is not ventilated, Figure 21); ii) the three modules were formed by a different number of PV cells, and therefore, by different peak powers (for Type B, 60 cells and 0.21 kW, while for the Types A and C, 50 cells and 0.185 kW). Three summer day were analysed: a sunny day without wind, a cloudy day and a sunny day with wind. On a sunny and non-windy day, the peak cell temperature of Type B is lower than that of Type A and C (65.5°C vs. 77.3°C and 78.8°C, respectively). When fully integrated PV modules are considered with the structure of the panel remaining in contact with roof insulation, an overheating of module is obtained. On a sunny day with wind (4.15 m/s) a general reduction in cell temperature (54.3°C, 47.5°C and 64.6°C) of Types A, B and C was observed. In this day, the module A and B have a substantial reduction in air gap temperature (less than 40°C and 30°C, respectively), while in Type C the air temperature is close to the back temperature of the panel (60.9°C). On a day with poor solar irradiance, the difference in the performance between the three systems are negligible. Finally, experimental results demonstrate that although the PV module temperature of Type B is lower than other full-building integrated modules, the difference in the electricity produced by the BIPV modules, estimated for the entire monitoring period, is less than 4%.
All such studies mainly aim at investigating possible passive and active strategies necessary to lower the cells temperature, and therefore, to maximize the heat recovery, as well as the electric performance. This is obtained through different novel and modified operation strategies, such as: increase of the flow velocity inside the absorber channel [44], optimization of forced air cooled channels [45], development of suitable water cooled devices [46].
![Figure 26. Thermal efficiency of one-inlet and two-inlet semi-transparent (left and right) and opaque BIPVT systems (right) [48]](https://thumb-eu.123doks.com/thumbv2/123dokorg/2768906.1218/38.892.157.682.224.433/figure-thermal-efficiency-inlet-transparent-opaque-bipvt-systems.webp)
![Figure 32. Cross-section view of BISPVT and BIOPVT collectors for roof and façade integration with air duct [54]](https://thumb-eu.123doks.com/thumbv2/123dokorg/2768906.1218/43.892.308.669.107.361/figure-cross-section-bispvt-biopvt-collectors-facade-integration.webp)
![Figure 43. Effect of poly HE on PV exergy and PV energy efficiency (right) [73].](https://thumb-eu.123doks.com/thumbv2/123dokorg/2768906.1218/51.892.221.763.114.313/figure-effect-poly-pv-exergy-energy-efficiency-right.webp)
![Figure 50. Power outputs for different agricultural wastes per t/year [81].](https://thumb-eu.123doks.com/thumbv2/123dokorg/2768906.1218/59.892.255.718.854.1060/figure-power-outputs-different-agricultural-wastes-t-year.webp)
![Figure 68. Bioethanol conversion for H2 production with direct bioethanol chemical looping (Case 3) [140]](https://thumb-eu.123doks.com/thumbv2/123dokorg/2768906.1218/78.892.260.636.353.627/figure-bioethanol-conversion-production-direct-bioethanol-chemical-looping.webp)
![Figure 69. The schematic of the trigeneration system [143].](https://thumb-eu.123doks.com/thumbv2/123dokorg/2768906.1218/79.892.337.619.391.728/figure-schematic-trigeneration.webp)

