2016
Publication Year
2020-05-22T09:50:34Z
Acceptance in OA@INAF
ALMA Resolves the Torus of NGC 1068: Continuum and Molecular Line Emission
Title
García-Burillo, S.; Combes, F.; Ramos Almeida, C.; Usero, A.; Krips, M.; et al.
Authors
10.3847/2041-8205/823/1/L12
DOI
http://hdl.handle.net/20.500.12386/25070
Handle
THE ASTROPHYSICAL JOURNAL LETTERS
Journal
823
ALMA RESOLVES THE TORUS OF NGC 1068: CONTINUUM AND MOLECULAR LINE EMISSION
S. García-Burillo1, F. Combes2, C. Ramos Almeida3,4, A. Usero1, M. Krips5, A. Alonso-Herrero6, S. Aalto7, V. Casasola8, L. K. Hunt8, S. Martín9,10, S. Viti11, L. Colina6,12, F. Costagliola7,13, A. Eckart14, A. Fuente1, C. Henkel15,16,
I. Márquez17, R. Neri5, E. Schinnerer18, L. J. Tacconi19, and P. P. van der Werf20
1
Observatorio de Madrid, OAN-IGN, Alfonso XII, 3, E-28014-Madrid, Spain;[email protected] 2
LERMA, Obs. de Paris, PSL Research Univ., Collège de France, CNRS, Sorbonne Univ., UPMC, Paris, France 3IAC, Vía Láctea, s/n, E-38205 La Laguna, Tenerife, Spain
4
Departamento de Astrofísica, Universidad de La Laguna, E-38205, La Laguna, Tenerife, Spain 5
IRAM, 300 rue de la Piscine, Domaine Universitaire de Grenoble, F-38406 St. Martin d’Hères, France
6
CAB(CSIC-INTA), Ctra de Torrejón a Ajalvir, km 4, E-28850 Torrejón de Ardoz, Madrid, Spain 7
Department of Earth and Space Sciences, Chalmers University of Technology, Onsala Observatory, SE-439 92-Onsala, Sweden 8
INAF-Osservatorio Astrofisico di Arcetri, Largo Enrico Fermi 5, I-50125 Firenze, Italy 9
Joint ALMA Observatory, Alonso de Córdova, 3107, Vitacura, Santiago 763-0355, Chile 10
ESO, Alonso de Córdova, 3107, Vitacura, Santiago 763-0355, Chile 11
Department of Physics and Astronomy, UCL, Gower Place, London WC1E 6BT, UK 12
ASTRO-UAM, Unidad Asociada CSIC, Madrid, Spain
13INAF—Istituto di Radioastronomia, via Gobetti 101, I-40129, Bologna, Italy 14
I. Physikalisches Institut, Universität zu Köln, Zülpicher Str. 77, D-50937, Köln, Germany 15
Max-Planck-Institut für Radioastronomie, Auf dem Hügel 69, D-53121, Bonn, Germany 16
Astronomy Department, King Abdulazizi University, P.O. Box 80203, Jeddah 21589, Saudi Arabia 17
IAA(CSIC), Apdo 3004, E-18080-Granada, Spain 18
Max-Planck-Institut für Astronomie, Königstuhl, 17, D-69117-Heidelberg, Germany 19
Max-Planck-Institut für extraterrestrische Physik, Postfach 1312, D-85741-Garching, Germany 20
Leiden Observatory, Leiden University, P.O. Box 9513, 2300 RA Leiden, The Netherlands Received 2016 March 31; revised 2016 April 26; accepted 2016 April 27; published 2016 May 17
ABSTRACT
We used the Atacama Large Millimeter Array(ALMA) to map the emission of the CO(6–5) molecular line and the 432μm continuum emission from the 300 pc sized circumnuclear disk (CND) of the nearby Seyfert 2 galaxy NGC 1068 with a spatial resolution of∼4 pc. These observations spatially resolve the CND and, for the first time, image the dust emission, the molecular gas distribution, and the kinematics from a 7–10 pc diameter disk that represents the submillimeter counterpart of the putative torus of NGC 1068. Wefitted the nuclear spectral energy distribution of the torus using ALMA and near- and mid-infrared(NIR/MIR) data with CLUMPY torus models. The mass and radius of the best-fit solution for the torus are both consistent with the values derived from the ALMA data alone:
= ´
Mgastorus (1 0.3) 105M☉ and Rtorus = 3.5 ± 0.5 pc. The dynamics of the molecular gas in the torus show strong non-circular motions and enhanced turbulence superposed on a surprisingly slow rotation pattern of the disk. By contrast with the nearly edge-on orientation of the H2O megamaser disk, we found evidence suggesting that the molecular torus is less inclined (i = 34°–66°) at larger radii. The lopsided morphology and complex kinematics of the torus could be the signature of the Papaloizou–Pringle instability, long predicted to likely drive the dynamical evolution of active galactic nuclei tori.
Key words: galaxies: individual (NGC 1068) – galaxies: ISM – galaxies: kinematics and dynamics – galaxies: nuclei– galaxies: Seyfert
1. INTRODUCTION
NGC 1068 is the prototypical Seyfert 2 galaxy and a prime example for active galactic nuclei (AGNs) unifying schemes since the discovery of polarized optical continuum and broadline emission in this source (Miller & Antonucci 1983; Antonucci & Miller1985). Its central engine is thought to be
hidden behind a screen of obscuring material located in a dusty molecular torus of a few parsecs size. Given the distance to the galaxy (D ∼ 14 Mpc; Bland-Hawthorn et al. 1997), which
implies a scale ∼70 pc/″, spatially resolving the molecular/ dusty torus has been challenging, as angular resolutions<0 1 are required.
Single-dish observations in the near- and mid-infrared (NIR and MIR) have shown extended emission around the central engine (Bock et al. 2000; Tomono et al. 2001; Rouan et al. 2004; Galliano et al. 2005; Gratadour et al. 2006,
2015). Higher-spatial resolution interferometric observations in
the NIR and MIR identified two components (Jaffe et al.2004; Weigelt et al.2004; Raban et al.2009; Burtscher et al. 2013; López-Gonzaga et al.2014). First, a compact 0.5–1.4 pc sized
core at the AGN with a position angle PA ; 140° that contains hot (;800 K) dust co-spatial with the H2O megamaser disk (Greenhill et al. 1996, hereafter GR96; Greenhill & Gwinn
1997; Gallimore et al. 2001, hereafter GA01; Gallimore et al.2004).
A second component of warm(;300 K) dust extends over 3 to 10 pc along the north-south axis, and may correspond to polar dust emission in the ionization cone. Due to their limited (u, v) coverage, IR interferometric data have to be processed with reconstruction techniques to provide a best-fit model of the putative torus in the(u, v) plane. This limitation can be to a large extent circumvented in the submillimeter using
interferometers like ALMA, whose large number of antennas and baselines assure a much more complete coverage of the(u, v)-plane.
We used ALMA in Cycle 0 to image the dust continuum and CO( J = 6 − 5) line emissions at 689 GHz in the circumnuclear disk(CND) of NGC 1068 with a spatial resolution of ∼20 pc (García-Burillo et al. 2014, hereafter GB14). The CND
appeared as a 300 pc × 200 pc sized off-centered ellipsoidal ring with two prominent knots located east and west of the AGN. Although significant continuum and line emissions were also detected at the position of the AGN, the insufficient spatial resolution of these observations prevented us from isolating the torus. The new ALMA Cycle 2 observations of the CND of NGC 1068 presented in this Letter have a spatial resolution of ∼4 pc. This factor of 20 smaller beam area compared with
GB14allowed us to resolve the CND and image, and for the first time, the dust emission and the distribution and kinematics of molecular gas from the torus of NGC 1068 in the submillimeter wavelength range.
2. ALMA OBSERVATIONS AND DATA REDUCTION We observed the CO( J = 6 − 5) line and its underlying continuum emission (at 432 μm) in NGC 1068 with ALMA during Cycle 2 using the Band 9 receiver (project ID: #2013.1.00055.S). The projected baselines range from 41 m to 2251 m. The data were calibrated using the ALMA reduction package CASA (McMullin et al. 2007). The calibrated UV
tables were exported toGILDAS21 for mapping and CLEAN-ing. One track was observed with 35 antennas during September 2015 using the extended configuration of the array, which allowed us to reach a spatial resolution of 0 07× 0 05 using natural (NA) weighting, and a field of view of 9″ that covers the entire CND of the galaxy. Four spectral windows with a spectral bandwidth of 1.875 GHz were placed at sky frequencies of 687.970, 688.888, 691.701, and 706.221 GHz. The second sub-band was centered at the redshifted frequency of the CO line. To optimize the deconvolution and cleaning, we
used polygons to restrict the regions where cleaning compo-nents are identified. The polygons were defined for the CO line image for each channel based on the detection of significant ( 5σ) emission identified in our Cycle 0 project (GB14). The
single polygon used in the cleaning of the continuum image was based on a similar detection criterion using the Cycle 0 data. The sensitivity in the line data cube is 4 mJy beam−1 in channels of 12.8 km s−1 width. We obtained images of the continuum emission by averaging in each sub-band the channels free of possible line emission. The resulting maps were combined to produce an image of the continuum emission at 694 GHz. The corresponding point source sensitivity for the continuum is 0.5 mJy beam−1. Given the (u, v)-coverage, we expect tofilter a significant amount of emission on scales 2″. The phase tracking center of the centralfield is the same as inGB14(α2000,δ2000) = (02h42m40.771s,−00°00′47 84) and the reference velocity is vo(HEL) = 1136 km s−1.
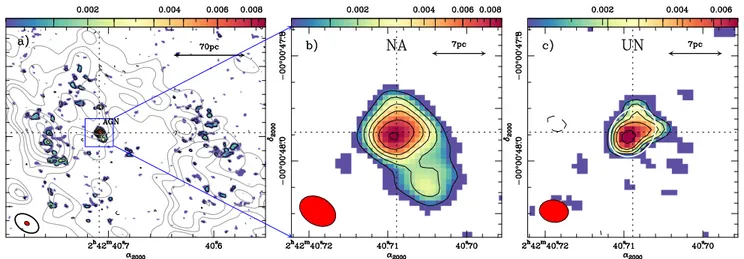
3. CONTINUUM AND LINE EMISSION MAPS (1) The CND and the torus. Figure1 shows the continuum emission of the CND imaged by the new ALMA observations. While∼90% of the total continuum flux is spread over a large number of faint emission clumps dispersed throughout the CND, the strongest emission peak corresponds, within 0 02 (∼1–2 pc), to the position of the AGN (see Figures1(a), (b)).
The extended emission connecting the AGN with the CND in the map ofGB14is likely resolved out in the present data. The AGN is identified as the source S1 in the radio-continuum maps of Gallimore et al.(1996) and Gallimore et al. (2004).22
We have used the GILDAS taskUV_FIT to find the best fit to the visibilities inside a radius r 0 2 (14 pc) from the AGN. Thefit indicates that half of the total flux in this region stems from a spatially resolved ellipsoidal disk, characterized by a deconvolved diameter of 7± 1 pc oriented along PAmajor= 142° ± 23°. Hereafter, we refer to this fitted disk as the dust torus. The orientation of the dust torus is similar to that of the H2O
Figure 1. (a) Dust continuum emission at 694 GHz (432 μm) mapped by ALMA in the CND of NGC 1068. The natural (NA)-weighted map is shown in color scale (in Jy beam−1-units) and (black) contour levels (3σ, 5σ, 7σ, 9σ, 12σ, and 16σ where 1σ = 0.5 mJy beam−1). The red-filled ellipse in the bottom left corner represents
the beam size at 694 GHz(0 07 × 0 05 at PA = 60°). The gray contours (10%, 20%, 30% to 90% in steps of 20% of the peak value: 49 mJy beam−1) identify the dust emission obtained inGB14using ALMA with a lower resolution: 0 4× 0 2 at PA = 50° (black ellipse). The dashed lines highlight the location of the AGN at (α2000,δ2000) = (02h42m40.709s,−00°00′47 95). (b) A close-up of the dust continuum emission shown in left panel. (c) The same as middle panel but using a
uniform(UN)-weighted set of data with a spatial resolution: 0 06 × 0 04 at PA = 82°. Contour levels are 3σ, 4σ, 5σ, 6σ, and 8σ, where 1σ = 0.7 mJy beam−1. The white ellipse identifies the disk solution found by the task UV_FIT.
21
http://www.iram.fr/IRAMFR/GILDAS
22Imanishi et al. (2016) have also recently isolated HCN(3–2) and HCO+(3–2) emission from the AGN.
maser disk (PAmaser = 140° ± 5°;GR96,GA01). The
minor-to-major axis ratio of the dust torus is;0.8 ± 0.1, an indication that the disk is spatially resolved along its minor axis. Moreover, the residuals of the fit show polar emission that extends south to west out to a distance of∼10 pc relative to the torus major axis(Figure1(b)). The enhanced spatial resolution
of the uniformly weighted data set better illustrates the goodness of thefit (Figure1(c)).
Figure 2(a) shows the CO(6–5) intensity map of the CND
obtained by integrating the line emission in the velocity interval
- = - +
v vo [ 250, 250] km s−1. The CO emission from the east and west knots of the CND is comparatively more prominent than in the continuum image shown in Figure 1, which likely reflects the higher percentage of flux recovered for the line on scales 2″.
Figure2(b) shows the mean-velocity field of the gas in the
CND. The gas kinematics derived from the new observations are compatible with the picture drawn fromGB14: gas motions in the CND show a superposition of outward radial flows on rotation. The molecular outflow is responsible for tilting the kinematic major axis by ;70° from PA ; 260° in the outer galaxy disk to PA ; 330° in the CND.
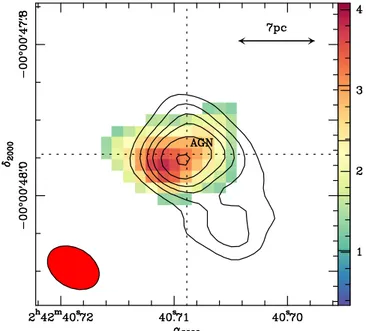
Furthermore, ALMA detects the CO emission from a spatially resolved lopsided disk located at the AGN, as illustrated in Figure 3. The size (diameter ; 10 ± 1 pc, minor-to-major axis ratio ;0.5±0.1) and orientation
=
PAmajor 112 20
( ) of the CO disk, hereafter referred to as the CO torus, are close to those derived above for the dust torus. The orientation of the CO torus is virtually identical to that of the radio-continuum source S1 resolved in the VLBA map of Gallimore et al.(2004). Figure3shows no significant CO counterpart for the polar emission of the dust torus.
(2.) The mass of the torus. From the continuum flux of the dust torus at 432μm, ;13.8 ± 1 mJy, we estimate a dust mass of Mdusttorus~1600M☉, assuming that a maximum of∼18% of
the flux at 694 GHz may come from other mechanisms different than thermal dust emission (GB14). To estimate
Mdusttorus we used a modified black-body function with a dust temperature Tdust; Tgas= 150 K, an emissivity index β = 2, and a value for the dust emissivity κ694 GHz = 0.34 m2kg−1. The values of Tdustandκ694 GHzare based on the analysis of the line excitation and SED fitting done in GB14and Viti et al. (2014), and on the adoption of a value for κ352 GHz= 0.0865 m2kg−1(Klaas et al. 2001). Assuming that the gas-to-dust ratio in the central 2 kpc of NGC 1068 is;60 (GB14), we derive a molecular gas mass for the
torusMgas = 10.3 ´10 M
torus ( ) 5
☉.
4. CLUMPY TORUS MODELS
We combined the ALMA Band 9 continuum thermal flux with the NIR/MIR continuum and MIR interferometry data obtained by several groups in apertures 0 05–0 3 to construct the nuclear SED of NGC 1068 from 1.65μm to 432μm (Marco & Alloin 2000; Tomono et al.2001; Weigelt et al. 2004; López-Gonzaga et al. 2014; this work). We also included as an upper limit the ALMA Cycle 0 Band 7 continuumflux fromGB14. The 8–13 μm spectrum is the sum of components 1 and 2 in López-Gonzaga et al. (2014). We
Figure 2. (a) The CO(6–5) intensity map of the CND of NGC 1068. The color scale and contours span the range: 3σ, 5σ, 9σ, 12σ, 15σ to 40σ in steps of 5σ, where 1σ = 0.34 Jy km s−1beam−1. Thefilled ellipse at the bottom left corner
represents the CO(6–5) beam size (0 07 × 0 05 at PA = 60°). (b) The CO (6–5) mean-velocity map (color scale). The dashed polygon identifies the region where significant (>5σ) emission was detected inGB14. Velocities refer to vo(HEL) = 1136 km s−1.
Figure 3. Overlay of the continuum emission contours of Figure1 on the CO(6–5) emission (color scale) from the AGN torus. Units are in Jy km s−1beam−1.
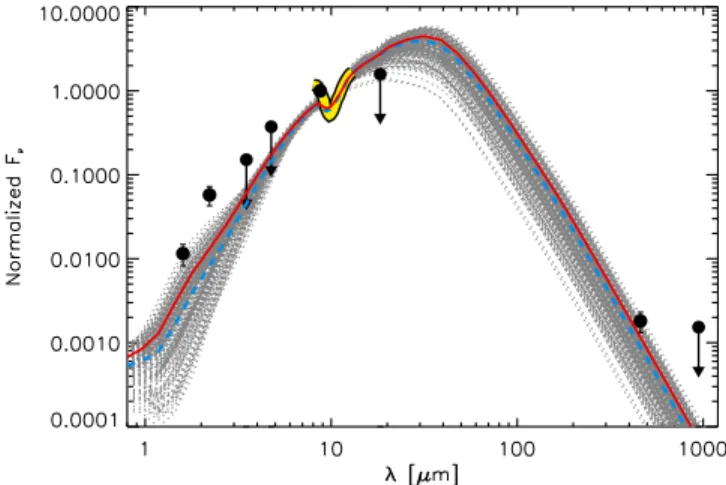
note that this nuclear SED, shown in Figure 4, corresponds to the smallest spatial scales probed to date for NGC 1068.
Wefitted the nuclear SED with the CLUMPY torus models of Nenkova et al. (2008a, 2008b), adopting a Bayesian
approach using the BayesClumpy tool (Asensio Ramos & Ramos Almeida2009). This scheme was applied to model the
SED of other Seyferts (Alonso-Herrero et al. 2011; Ramos Almeida et al. 2011). Using this approach we can specify
a priori information about the six model parameters. We restricted the torus angular width σ to be 40° < σ < 60° to match the opening angle of the ionization cones (80°; Das et al. 2006). The torus radial extent, defined by the outer–to–
inner radius ratio Y, is in the range 5 < Y < 30 based on the torus size measured by ALMA at 432μm. In this first fit, we restricted the inclination angle of the torus to 60° < i < 90° based on the H2O maser detection for this galaxy(GR96) We translate the results into the corresponding SED shown in Figure4. The NIRfluxes are underpredicted, an indication that we need to include some contribution from starlight or a distinct component to reproduce the NIR bump (e.g., Kishimoto et al. 2012; Lira et al.2013).
To compare our torus model with direct measurements from the ALMA observations presented here, we estimated from the fitted parameters the gas mass Mgastorus, the outer radius Rtorus, and the inclination i of the torus. Using the median values of the fitted parameters, we derive Mgas =0.9 ´10 M
torus
0.4
0.2 5 ,
Rtorus= 4 ± 1 pc, and =i 6649. These values are consistent
with those derived in Section 3from the Band 9 observations alone. Nevertheless, if we allow the viewing angle of the torus to have smaller values in the range 30° < i < 90° (see Section 5), the best-fit median values are
= ´
Mgastorus 0.6 0.20.4 105M , Rtorus= 2 ± 1 pc, and =i 3425.
5. KINEMATICS OF THE TORUS
Figure 5 shows that ALMA has spatially resolved the molecular gas kinematics in the torus. Although the mean velocities derived from CO, shown in Figure 5(a), span a
moderate range ( -v vo= -[ 30,+30] km s−1), we identify spatially resolved velocity gradients within the torus. Overall,
the line emission appears redshifted to the south and blueshifted to the north. Therefore, the apparent kinematic major axis of the CO disk, at PAkin ; 180°, is tilted by a significant angle (;53° ± 15°) relative to the morphological major axis of the CO/dust torus, oriented at a weighted average PAmajor; 127° ± 15° (see Section3). Taken at face value, the
tilt between both axes indicates that strong non-circular motions are superposed to the slow rotation pattern of the CO torus.
Figure5(b) shows the position–velocity (p–v) diagram taken
along the morphological major axis of the CO torus (PA M = 112° ± 20°). The bulk of the CO emission in the torus spans a wide range of velocities:v-vo[-80, 80] km s−1. Figure5(b) compares the observed kinematics with the velocity
range expected from the H2O sub-Keplerian rotation curve of Gallimore et al. (1996) projected along the CO major axis
(v µv-a
rot , withα = 0.31; see also Lodato & Bertin 2003).
Even in the most favorable case of a purely Keplerian extrapolation (α = 0.5), the CO velocities are still a factor 2 lower compared with the H2O-based kinematics for an edge-on disk(i = 90°). To reach a better agreement, we would need to incline the CO torus down to i = 30°–40°, i.e., close to the inclination of the galaxy disk(GB14). Although these small
values for i can be discarded for the mostly edge-on maser disk (at r 1 pc), we cannot rule out that the CO torus is tilted toward a more face-on orientation (at r 2−4 pc). Furthermore, this scenario is still within the range of solutions found in Section 4 for the clumpy torus. However, as argued below, the intricate kinematics of the CO torus cannot be attributed alone to the changing orientation of a purely rotating disk.
Figures5(a), (b) show that the CO emission is redshifted on
the southeast side of the major axis at Δx ; −0 06. The emission is nevertheless blueshifted northwest atΔx ; +0 06. This velocity gradient, measured on scalesΔx ; ±4 pc from the AGN, is inverted relative to that measured for the H2O maser disk atΔx ; ±1 pc. The apparent counterrotation of the outer disk relative to the inner disk could be caused by an enhancement of the gas turbulence in the torus. A rough estimate of the ratio of the deprojected mean velocity(vmean) to the velocity dispersion (σ) of the gas along the major axis yields very low values: vmean/σ < 1. However, Figure 5(c) shows that a comparable spatially resolved velocity gradient is measured along the minor axis p–v diagram. The tilted disk scenario or the simple addition of turbulence to rotation cannot alone explain the observed pattern along the minor axis, an indication that non-circular motions in the torus need to be invoked.
Papaloizou & Pringle (1984) first predicted that non
self-gravitating AGN tori should likely develop low-order non-axisymmetric instabilities on a dynamical timescale. This type of instability, known as the Papaloizou–Pringle instability (PPI), has been studied in isolated self-gravitating tori (Kiuchi et al.2011; Korobkin et al.2013) and also in tori perturbed by
the accretion of matter coming from the outer boundary of the system (Dönmez 2014). These new simulations show the
growth of a long-lasting m = 1 mode related to the onset of the PPI. The m = 1 mode generates a lopsided distribution, as well as enhanced turbulence and strong non-circular motions in the torus gas. Evidence of inflowing gas connecting the CND with the torus has been found in the 2.12μm H2 lines by Müller Sánchez et al.(2009). The remarkably lopsided distribution and
Figure 4. High spatial resolution SED of NGC 1068 (the thick yellow line represents the spectrum; the black dots represent the photometry) normalized to the 8.7μm point. The solid red and dashed blue lines correspond to the maximum a posteriori(MAP) and median models, respectively, for the range 60° < i < 90°. The upper limits correspond to the largest apertures (0 3). Gray curves are the CLUMPY models sampled from the posterior distributions compatible with the data at the 68% confidence level.
complex kinematics of the ∼7–10 pc CO torus of NGC 1068 seen by ALMA could be the footprint of the PPI in this Seyfert. Alternatively, the velocity gradient observed along the minor axis could be explained by gas being entrained in the outflow, as similarly detected by Cecil et al. (2002) in high-ionization
lines close to the AGN. This radial shift is noticeably reversed farther out at the CND where the CO outflow follows the pattern of low-ionization lines (GB14).
6. SUMMARY AND CONCLUSIONS
We mapped with ALMA the dust continuum at 432μm and the CO(6–5) molecular line emission in the CND of NGC 1068 with a spatial resolution of∼4 pc. These observations allowed us to resolve the CND and image the dust emission and also the distribution and kinematics of molecular gas from a 7–10 pc diameter disk. This is the first detection of a submillimeter counterpart of the putative torus of NGC 1068. As expected for the contribution of a comparatively cooler component, the CO/ dust torus extends on spatial scales that are twice larger compared with the brightest MIR sources detected by the VLTI at the position of the central engine of NGC 1068 (Burtscher et al.2013; López-Gonzaga et al.2014).
The ALMA measurements have been combined with the NIR/MIR continuum and MIR interferometry data available from 1.65μm to 432 μm. We fitted the nuclear SED with the CLUMPY torus models of Nenkova et al.(2008a,2008b). The
mass and the radius of the best-fit torus are consistent with the values derived from the ALMA data alone:
= ´
Mgastorus (1 0.3) 105M☉and Rtorus= 3.5 ± 0.5 pc. We spatially resolved the kinematics of molecular gas in the torus. The overall slow rotation pattern of the disk is perturbed by strong non-circular motions and enhanced turbulence. Furthermore, while the maser condition of the H2O line suggests that the inner molecular disk should be oriented mostly edge-on at r 1 pc, we found evidence that the molecular torus could be tilted toward lower inclination angles (i = 34°–66°) at r 2−4 pc. The lopsided morphology and complex kinematics of the NGC 1068 torus could be the signature of the PPI instability predicted by Papaloizou &
Pringle (1984). This instability was foreseen to rule the
dynamical evolution of AGN tori.
The results of this work are relevant to caution against the use of CO lines as a direct tracer of the supermassive black hole mass(MBH) in galaxies (e.g., Davis et al.2013). In cases like NGC 1068 where even mid-J CO lines trace the outer boundary of a kinematically distorted tilted torus, careful modeling would be mandatory to reliably estimate MBH.
S.G.B., A.U., L.C., I.M., and A.F. acknowledge support from Spanish grants AYA2012-32295 and AYA2013-42227-P. We thank the referee, Makoto Kishimoto, for his constructive review. This paper makes use of the following ALMA data: ADS/JAO.ALMA#2013.1.00055.S. ALMA is a partnership of ESO(representing its member states), NSF (USA) and NINS (Japan); NRC (Canada), NSC, and ASIAA (Taiwan); and KASI(Republic of Korea), in cooperation with the Republic of Chile. The Joint ALMA Observatory is operated by ESO, AUI/NRAO, and NAOJ.
REFERENCES
Alonso-Herrero, A., Ramos Almeida, C., Mason, R., et al. 2011,ApJ,736, 82 Antonucci, R. R. J., & Miller, J. S. 1985,ApJ,297, 621
Asensio Ramos, A., & Ramos Almeida, C. 2009,ApJ,696, 2075
Bland-Hawthorn, J., Gallimore, J. F., Tacconi, L. J., et al. 1997,Ap&SS,248, 9 Bock, J. J., Neugebauer, G., Matthews, K., et al. 2000,AJ,120, 2904 Burtscher, L., Meisenheimer, K., Tristram, K. R. W., et al. 2013, A&A,
558, A149
Cecil, G., Dopita, M. A., Groves, B., et al. 2002,ApJ,568, 627
Das, V., Crenshaw, D. M., Kraemer, S. B., & Deo, R. P. 2006,AJ,132, 620 Davis, T. A., Bureau, M., Cappellari, M., Sarzi, M., & Blitz, L. 2013,Natur,
494, 328
Dönmez, O. 2014,MNRAS,438, 846
Galliano, E., Pantin, E., Alloin, D., & Lagage, P. O. 2005,MNRAS,363, L1 Gallimore, J. F., Baum, S. A., & O’Dea, C. P. 2004,ApJ,613, 794 Gallimore, J. F., Baum, S. A., O’Dea, C. P., & Pedlar, A. 1996,ApJ,458, 136 Gallimore, J. F., Henkel, C., Baum, S. A., et al. 2001,ApJ,556, 694(GA01) García-Burillo, S., Combes, F., Usero, A., et al. 2014, A&A, 567,
A125(GB14)
Gratadour, D., Rouan, D., Grosset, L., Boccaletti, A., & Clénet, Y. 2015,A&A, 581, L8
Gratadour, D., Rouan, D., Mugnier, L. M., et al. 2006,A&A,446, 813 Figure 5. (a) CO(6–5) mean-velocity map of the torus. The contours span the range (−30 km s−1to 30 km s−1) in steps of 10 km s−1. The black lines labeled as M
and m show, respectively, the orientations of the major and minor axes of the CO torus (PAM= 112° ± 20°, PAm= 22° ± 5°). (b) CO(6–5) position–velocity diagram along the M axis. Contours go from 2σ to 7σ in steps of 1σ, where 1σ = 4 mJy−1beam−1. The inset shows the velocities relative to vsysas a function of radius(in
arcseconds) as derived for the H2O megamaser spots(red markers) detected along PAmaser= 140° ± 5° (GR96,GA01). The dashed (solid) blue curve shows the
best-fit sub-Keplerian (Keplerian) rotation curvev µr-a
rot ofGR96withα = 0.31 (0.50). (c) Same as middle panel, but for the m axis. In all panels, velocities refer to vo(HEL) = 1136 km s−1and(Δx, Δy)—offsets are relative to the AGN position.
Greenhill, L. J., & Gwinn, C. R. 1997,Ap&SS,248, 261
Greenhill, L. J., Gwinn, C. R., Antonucci, R., & Barvainis, R. 1996, ApJL, 472, L21(GR96)
Imanishi, M., Nakanishi, K., & Izumi, T. 2016, ApJL, in press (arXiv:1604.03953)
Jaffe, W., Meisenheimer, K., Röttgering, H. J. A., et al. 2004, Natur,429, 47
Kishimoto, M., Hönig, S. F., Antonucci, R., et al. 2012,JPhCS,372, 012033 Kiuchi, K., Shibata, M., Montero, P. J., & Font, J. A. 2011, PhRvL,106,
251102
Klaas, U., Haas, M., Müller, S. A. H., et al. 2001,A&A,379, 823
Korobkin, O., Abdikamalov, E., Stergioulas, N., et al. 2013,MNRAS,431, 349 Lira, P., Videla, L., Wu, Y., et al. 2013,ApJ,764, 159
Lodato, G., & Bertin, G. 2003,A&A,398, 517
López-Gonzaga, N., Jaffe, W., Burtscher, L., Tristram, K. R. W., & Meisenheimer, K. 2014,A&A,565, A71
Marco, O., & Alloin, D. 2000, A&A,353, 465
McMullin, J. P., Waters, B., Schiebel, D., Young, W., & Golap, K. 2007, in ASP Conf. Ser. 376, Astronomical Data Analysis Software and Systems XVI, ed. R. A. Shaw, F. Hill, & D. J. Bell(San Francisco, CA: ASP),127 Miller, J. S., & Antonucci, R. R. J. 1983,ApJL,271, L7
Müller Sánchez, F., Davies, R. I., Genzel, R., et al. 2009,ApJ,691, 749 Nenkova, M., Sirocky, M. M., Ivezić, Ž, & Elitzur, M. 2008a,ApJ,685, 147 Nenkova, M., Sirocky, M. M., Nikutta, R., Ivezić, Ž, & Elitzur, M. 2008b,ApJ,
685, 160
Papaloizou, J. C. B., & Pringle, J. E. 1984,MNRAS,208, 721
Raban, D., Jaffe, W., Röttgering, H., Meisenheimer, K., & Tristram, K. R. W. 2009,MNRAS,394, 1325
Ramos Almeida, C., Sánchez-Portal, M., Pérez García, A. M., et al. 2011, MNRAS,417, L46
Rouan, D., Lacombe, F., Gendron, E., et al. 2004,A&A,417, L1 Tomono, D., Doi, Y., Usuda, T., & Nishimura, T. 2001,ApJ,557, 637 Viti, S., García-Burillo, S., Fuente, A., et al. 2014,A&A,570, A28 Weigelt, G., Wittkowski, M., Balega, Y. Y., et al. 2004,A&A,425, 77