The
„1Ã1…\hexagonal structural transition on Pt„100… studied
by high-energy resolution core level photoemission
Alessandro Baraldi,a兲 Erik Vesselli, Laura Bianchettin, and Giovanni Comelli Physics Department and Center of Excellence for Nanostructured Materials, Trieste University,
Via Valerio 2, I-34127 Trieste, Italy Laboratorio TASC INFM-CNR, S.S. 14 Km 163.5, I-34012 Trieste, Italy Silvano Lizzit and Luca Petaccia
Sincrotrone Trieste S.C.p.A., S.S. 14 Km 163.5, I-34012 Trieste, Italy Stefano de Gironcoli
SISSA—Scuola Internazionale Superiore di Studi Avanzati and INFM-CNR DEMOCRITOS National Simulation Center via Beirut 2-4, I-34014 Trieste, Italy
Andrea Locatelli, T. Onur Mentes, and Lucia Aballe Sincrotrone Trieste S.C.p.A., S.S. 14 Km 163.5, I-34012 Trieste, Italy Jonas Weissenrieder
MAX-lab, Lund University, Box 118, S-221 00 Lund, Sweden Jesper N. Andersen
Department of Synchrotron Radiation Research, Lund University, Box 118, S-221 00 Lund, Sweden 共Received 20 March 2007; accepted 12 September 2007; published online 22 October 2007兲 The共1⫻1兲→quasihexagonal 共HEX兲 phase transition on a clean Pt共100兲 surface was investigated by monitoring the time evolution of the Pt4f7/2 core level photoemission spectra. The spectral component originating from the atoms forming the共1⫻1兲 metastable unreconstructed surface was found at −570± 20 meV with respect to the bulk peak. Ab initio calculations based on density functional theory confirmed the experimental assignment. At temperatures above 370 K, the 共1 ⫻1兲 phase irreversibly reverts to the more stable HEX phase, characterized by a surface core level shifted component at −185± 40 meV. By analyzing the intensity evolution of the core level components, measured at different temperatures in the range of 393– 475 K, we determined the activation energy of the phase transformation, E = 0.76± 0.04 eV. This value is considerably lower than the one previously determined by means of low energy electron diffraction. Possible reasons for this discrepancy are discussed. © 2007 American Institute of Physics.
关DOI:10.1063/1.2794344兴
I. INTRODUCTION
Among the transition metals surfaces, Pt共100兲 represents an intriguing case for the remarkable differences in chemical reactivity between the共1⫻1兲 unreconstructed phase and the reconstructed high-temperature quasihexagonal phase 共HEX兲. A vast literature has therefore been dedicated to the structural determination of the different phases,1–3 the mechanism of reconstruction4,5 共also in the presence of ad-sorbates兲, and the understanding of chemical properties, re-lated in particular to the oscillatory behavior of a large num-ber of surface chemical reactions.6
Similar to other共100兲 5d transition metal surfaces such as Ir and Au, Pt exhibits a quasihexagonal reconstructed stable phase, periodically matching the共100兲 substrate. Dif-ferent symmetries of the first and the subsurface layers result in a large共5⫻25兲 unit cell. Scanning tunneling microscopy 共STM兲 clearly revealed that the topmost layer has a hexago-nal structure, characterized, however, by a large-scale height modulation. Due to a contraction of the Pt–Pt distance, the
topmost layer accommodates about 25% more atoms than the bulk-terminated ideal 共100兲 layer. Density functional theory共DFT兲 calculations4have identified the tensile excess stress of the unreconstructed 共1⫻1兲 phase, originating from a d charge depletion in the surface layer, as the driving mechanism for the formation of the reconstructed phase. The HEX reconstruction can be lifted by adsorbates such as CO,7–14NO,15–19and O,20–27as the gain in adsorption energy overcompensates the loss in reconstruction energy. The tran-sition from the 共1⫻1兲 to HEX phase has also been invoked to interpret the oscillatory kinetics of a large number of chemical reactions on Pt, as due to periodical switching be-tween two states of different catalytic activity. In these stud-ies, CO + O2, NO + CO, NO + H2, and NO + NH3chemical re-actions have been widely studied6in the attempt to develop a mathematical model describing the oscillatory chemical re-activity. In general this involves the definition of a set of coupled differential equations, describing the variation of the adsorbate coverage on the HEX and共1⫻1兲 phases and the phase transition between the two. In this context, one of the most important parameters is the activation energy of the
a兲Author to whom the correspondence should be addressed. Electronic mail:
共1⫻1兲→HEX structural transition, which quantifies the thermal stability of the共1⫻1兲 phase.
While for the Au共100兲 surface a mechanism was pro-posed based on atomic migration from steps or islands 共which act as sources of the 25% excess HEX surface at-oms兲, a different mechanism has recently been suggested for the Pt共100兲 共1⫻1兲→HEX phase transition, based on the presence of an intermediate phase.5This process involves the extraction of extra atoms from the second layer, forming sub-surface vacancies. The effective activation energy Eafor the subsurface vacancy creation has been estimated to be 1.2 eV 共pre-exponential factor of 1013s−1兲, slightly larger than the unique experimental value reported so far, obtained by low energy electron diffraction measurements which is 0.91 eV.28
In the present paper, we investigate the transition from the 共1⫻1兲 to the HEX phase on Pt共100兲 by means of high-energy resolution core level photoemission. The time evolu-tion of Pt4f7/2spectra measured at different temperatures al-lows us to determine the activation energy of the process. Differences between our experimental findings and previ-ously reported activation energies for the same process are discussed.
II. EXPERIMENTAL
The photoemission studies were performed at the I311 beamline of the third generation synchrotron radiation source MAX II, Lund, Sweden.29 The background pressure in the main chamber was always better than 1⫻10−10mbar. The Pt共100兲 single crystal was cleaned by Ar ion sputtering at room temperature 共E=1.2 keV兲, annealing to 1250 K, oxy-gen cycles in order to remove residual carbon 共in the tem-perature range of 570– 1070 K at pO2= 1⫻10−7mbar兲, and finally, hydrogen reduction to remove residual oxygen traces 共pH2= 1⫻10−7mbar, T = 470– 770 K兲. Surface cleanness was checked by inspecting the C1s, Si2p, S2p, and O1s signals. The overall energy resolution 共beamline+spectrometer兲 of the Pt4f7/2 spectra was 50 meV at the photon energies we used, ranging from 120 to 150 eV. Core level binding ener-gies 共BE兲 have always been calibrated with respect to the Fermi level.
The metastable 共1⫻1兲 clean layer is prepared with a procedure similar to the one developed by Kuhnke et al.30
using He diffraction. NO is based at 300 K
共pNO= 2⫻10−8mbar兲 for about 600 s, monitoring in real time the N1s signal evolution. It is well known that in the saturated NO layer the reconstruction is completely lifted. The surface is then annealed to 420 K in an oxygen atmo-sphere共p=1⫻10−7mbar兲 in order to desorb part of the NO layer and allow the residual NO to dissociate, thus forming a chemisorbed oxygen layer on a共1⫻1兲 substrate 共N immedi-ately leaves the surface as N2 after NO dissociation兲. The resulting surface is completely covered by chemisorbed oxy-gen as evidenced by the O1s signal and the absence of a N1s signal. After cooling to 340 K the oxygen is removed by low pressure hydrogen reduction at 2⫻10−9mbar, monitoring the O1s signal and stopping the hydrogen flux as soon as all oxygen has been reacted off, in order to minimize residual
hydrogen on the surface. The high-photon flux of the beam-line allows measurement of the O1s intensity evolution with high surface sensitivity 关better than 0.1% of monolayer 共ML兲兴 and time resolution 共10 s/spectrum兲. Small traces of residual hydrogen 共less than 1%兲 can be easily desorbed by 2–3 flashing cycles below 420 K 共⬃10 K/s兲, a temperature at which HEX-induced diffraction spots start to be observed in a slow heating process 共0.06 K/s兲.30
Low energy electron microscopy 共LEEM兲 and micro-low-energy-electron-diffraction 共LEED兲 were used to pro-vide a local characterization of the surface structure. These microscopic investigations were done using the spin polar-ized LEEM 共SPLEEM兲 microscope available at the Nano-Spectroscopy beamline at ELETTRA.31
The core level photoemission spectra were fitted with a Doniach-Šunjić共DS兲 function,32 characterized by the singu-larity index parameter ␣ 共final-state screening of the core hole兲 and by the Lorentzian width ⌫ 共finite core-hole life-time兲, convoluted with a Gaussian of width G, which takes into account the broadening due to the phonons, the surface inhomogeneity, and the instrumental resolution. A linear background was also subtracted.
III. DFT CALCULATIONS
The core level binding energies were calculated using a density functional theory based formalism33,34employing the generalized gradient approximation35,36 as implemented in the Quantum-ESPRESSO open source distribution.37The in-teraction between the electrons and the ionic cores is de-scribed by an ultrasoft pseudopotential.38 The Kohn-Sham equations are solved self-consistently using a plane-wave ba-sis set restricted to a kinetic energy cutoff of 32 Ry. In order to deal with the metallic character of the system and to im-prove the convergence with respect to the number of k points of the Brillouin zone integration the contribution from each k point is broadened by using a Methfessel and Paxton smear-ing function39 of order 1 with a width= 0.012 Ry.
For the 共1⫻1兲 cell a sampling with a 共10⫻10⫻2兲 Monkhorst-Pack grid was adopted, resulting in 15 special k points in the irreducible wedge.40 The Pt共100兲 surface was modeled by a fully relaxed seven-layer slab with a vacuum region corresponding to five interlayer spacings, enough to avoid interactions between neighboring slabs as previously found.41Final state core level binding energies can be accu-rately computed in the pseudopotential formalism we used by describing the excited atom by a pseudopotential gener-ated in the core-excited configuration. In this formulation the core level binding energies, including final state effects, are given by the pseudopotential total energy difference supple-mented by an additive constant that can be determined for the isolated atom and cancel out when computing binding energy differences. Initial state contributions can also be ex-tracted by a frozen-density calculation. The estimated abso-lute error in the surface core level shift is ±30 meV. Details of the method we used can be found in Ref.41.
IV. RESULTS AND DISCUSSION A. Surface Characterization
The deconstructed surface displays a good共1⫻1兲 LEED pattern 关Fig. 1共a兲兴. LEEM 关Fig. 1共b兲兴 shows no structural contrast, which is direct evidence for the laterally homoge-neous distribution of the共1⫻1兲 phase. Phase contrast in the images reveals instead a complex surface morphology. Typi-cally, large flat areas with densely spaced single steps 共aver-age terrace width of 40 nm兲 and a few step bunches are observed.
LEEM is ideally suited to follow the dynamics of the phase transition occurring during annealing of the 共1⫻1兲 metastable structure. At an electron energy of 6 eV it is pos-sible to obtain structural contrast between the共1⫻1兲 and the HEX phases, the latter appearing brighter than the共1⫻1兲 as seen in Fig.1共c兲. Typically, the HEX phase grows in needle-like domains which are preferentially aligned along the main crystallographic directions and can extend up to ⬃300⫻50 nm2. With increasing time 共or temperature兲, the HEX phase tends to cover the entire surface关Figs.1共d兲 and 1共e兲兴.
The growth mode of the HEX phase during annealing of the共1⫻1兲 phase mirrors is observed during the inverse pro-cess. In fact, when the HEX reconstruction is lifted by NO adsorption, the 共1⫻1兲 domains have similar asymmetric shape and orientation. This is in agreement with previous scanning tunneling microscopy 共STM兲 experiments and simulations for the CO-induced lifting of the HEX,7 which demonstrated that the surface restructures via the ejection of chains of Pt atoms. Our LEEM data共not shown兲 indicate that the same mechanism can determine the shape of the domains up to mesoscopic length scales.
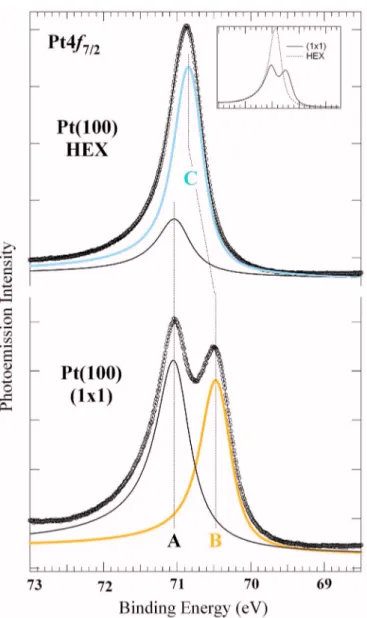
Prior to the phase transition measurements, we indepen-dently characterized the 共1⫻1兲 and HEX phases. In Fig. 2 the Pt4f7/2spectrum of the clean共1⫻1兲 structure measured at 90 K and 120 eV photon energy is shown, together with the individual components resulting from the data analysis. Only two peaks共A and B兲 were used to fit the spectrum at 71.02 and 70.45 eV, respectively, i.e., with a core level shift of 570± 20 meV. Best fits were obtained with two DS func-tions with different values of the fitting parameters
共⌫A= 480 meV, ⌫B= 310 meV, ␣A= 0.14, ␣B= 0.13, GA = 100 meV, and GB= 240 meV兲. In order to determine the origin of these components we first acquired Pt4f7/2spectra at high photoelectron kinetic energies 共above 300 eV兲. The low binding energy component B presents a reduced inten-sity, as expected for a surface component, due to the in-creased inelastic electron mean free path. In addition, the lower binding energy component is strongly modified by small traces of adsorbates such as oxygen and hydrogen, deliberately dosed on the clean surface at room temperature. Finally, for a 5d transition metal surface with a d-band more than half occupied, the surface peak is expected to have a smaller binding energy with respect to the bulk peak, with a shift that, in absolute value, should be even larger than the one found for the close-packed Pt共111兲 surface, i.e., −400 meV.42–44
In order to simplify the fitting procedure, the spectrum FIG. 1. 共a兲 共1⫻1兲 LEED of the deconstructed surface 共E=70 eV兲. The
corresponding LEEM image共E=16 eV兲 共b兲 demonstrates the homogeneous lateral development of the 共1⫻1兲 phase; step and step bunches appear darker than the terraces.共c兲 Development of needlelike HEX domains dur-ing annealdur-ing of the 共1⫻1兲 phase 共T=420 K, E=6 eV兲; main crystallo-graphic axes are indicated by the white arrows. 共d兲 LEED of the HEX reconstructed surface 共E=55 eV兲 and 共e兲 corresponding LEEM image 共E=16 eV兲. In all LEEM images the white bar indicates a length of 1m.
FIG. 2. 共Color online兲 Pt4f7/2core level spectra corresponding to共1⫻1兲
and HEX phases measured at 90 K and 120 eV photon energy共spectra are plotted on a different scale, see inset兲. The 共1⫻1兲 spectrum can be fitted by two components corresponding to bulk共A兲 and first-layer 共B兲 atoms with a surface core level shift of −570 meV. For simplicity, also the HEX phase has been fitted by considering only one surface component共C兲 at −180 meV with respect to the bulk peak.
corresponding to the HEX phase has also been fitted with a single surface component, whose lineshape parameters were fixed to the values of the 共1⫻1兲 surface component. Al-though this clearly represents a strong approximation, as first-layer atoms involved in the 共5⫻25兲 structure are geo-metrically slightly inequivalent, the alternative solution would require that an unreasonable number of components was included in the fitting procedure.
It should be noted that the overall integrated intensity of the HEX peak is about 32% larger than共1⫻1兲-related peak, as clearly visible in the inset of Fig.2. This can be ascribed to the higher surface atomic density, even though photoelec-tron diffraction effects at these photoelecphotoelec-tron kinetic energies can be relevant. For the same reason we could also explain the decreased intensity of the bulk component in the HEX spectrum. On the basis of all the above considerations, we assign the lower BE component to first-layer Pt atoms. In order to support these conclusions by means of a quantitative comparison with the experimental findings, we performed DFT calculations of the Pt共100兲 surface core level shift for the unreconstructed structure.
The fully relaxed共1⫻1兲 surface shows a first-to-second layer distance which is contracted by 2.4% with respect to the calculated bulk interlayer spacing of 1.99 Å. The equi-librium geometry is in very good agreement with previous theoretical results which yielded a surface relaxation of −2.6%.45 Furthermore, our density functional theory 共DFT兲 calculations confirm the experimental assignment of the lower BE component, since the calculated surface core level shift is −510± 30 meV.
There is still a small discrepancy between the theoretical and measured values. As second-layer contributions have been found46 to be important in Rh共100兲 and Rh共111兲 sur-faces for a detailed comparison between experimental and theoretical spectra, in order to asses the impact of such effect in the present case, we also calculated the second-layer sub-surface core level shift. Indeed we found a small positive shift 共+22 meV兲 in the second-layer contribution with re-spect to the bulk peak, consistent with the fact that second-layer atoms have a somewhat higher coordination than the
bulk one, due to the reduced first-to-second layer distance.46 Accounting for this minor shift in the experiment would bring experimental and theoretical results in even closer agreement. We did not, however, add a new core level com-ponent so close to the bulk peak in the data analysis for two reasons: 共i兲 it is known that, as for Pd,47 the DS lineshape does not accurately describe the Pt4f profile, due to the rapid change of the density of states around the Fermi level, and 共ii兲 the LEEM images show the presence of step bunches and thus not only first-layer but also second-layer atoms with coordination n⫽12 are expected, resulting in other low in-tensity core level components hidden underneath the bulk peak.
On Pt共100兲, the Pt4f7/2surface core level shift appears to be dominated mainly by initial state effects due to the re-duced coordination of surface atoms, as the calculated con-tribution from the electronic core hole screening is about +70 meV for both first- and second-layer atoms. This is clearly visible in Fig.3, where the calculated partial density of states48of first-layer, second-layer, and bulk atoms is plot-ted. The displacement49 of the d-band center of the surface atoms with respect to the bulk ones,⌬Bd= Bd
bulk − Bd
surf , goes FIG. 3.共Color online兲 Density of states projected onto the 5d orbitals of the
Pt atoms in the inequivalent configurations of the共1⫻1兲 unreconstructed phase共see insert兲: bulk 共black兲, second-layer 共gray兲, and first-layer surface atoms 共orange兲. The calculated atom-projected d-band center is also reported.
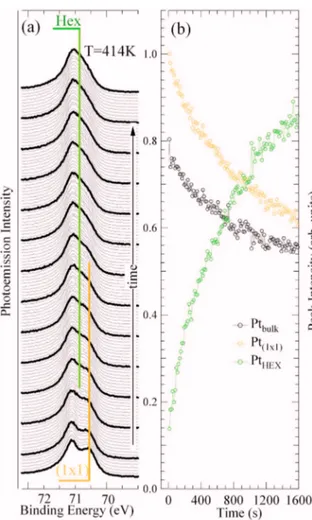
FIG. 4. 共Color online兲 共a兲 Time evolution of the Pt4f7/2core level spectra measured at T = 414 K and h= 120 eV. Each spectrum was measured in 14 s. The yellow line indicates the position of the共1⫻1兲-related surface core level component, while the green line indicates the binding energy of the HEX-induced surface core level shifted peak.共b兲 Intensity evolution of the three peaks’ integrated areas共black=bulk, green=HEX, yellow=1⫻1兲 versus time, obtained by fitting the sequence of about 130 spectra, recorded at constant temperature.
for the clean共1⫻1兲 structure from −541 meV in the case of the first-layer atoms to +90 meV for second-layer atoms.
B. KINETICS
The identification of the surface core level shifted com-ponents permits the study of the kinetics of the共1⫻1兲 struc-tural transformation to the HEX phase. The time evolution of the intensity of the 共1⫻1兲-related component as a function of time at different temperatures ranging from 393 to 475 K is a measure of the changes in the population of共1⫻1兲-type atoms. The same approach has been previously applied to study the thermal stability of the Rh共110兲 共1⫻n兲 missing-row reconstruction.50 Figure 4共a兲 shows a typical sequence of Pt4f7/2 spectra acquired at 414 K 共acquisition time ⬃14 s/spectrum兲. Already a qualitative inspection of the evolution of the raw data reveals that the high binding energy component at 70.80 eV, ascribed to atoms in the HEX con-figuration, grows with time, while the共1⫻1兲 related surface component gradually disappears.
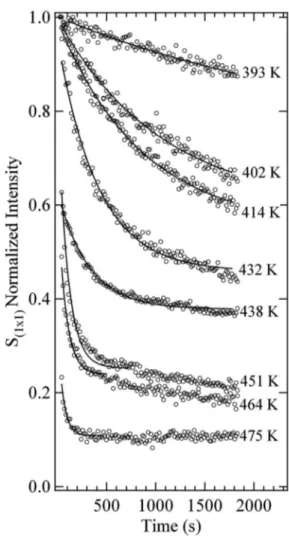
The intensity versus time curves are plotted in Fig.4共b兲: initially the intensity of the 共1⫻1兲-surface component de-cays exponentially, while the HEX surface component grows with time. Also the bulk peak intensity diminishes, as ex-pected by comparing HEX and共1⫻1兲 low temperature spec-tra. The results for the time evolution of the 共1⫻1兲-related peak at different temperatures are summarized in Fig.5. The curves seem to follow an exponential decay with a decay constantthat decreases with increasing temperature. How-ever, in the whole temperature range spanned by our experi-ment, this behavior applies only at the early stages of the transition and it is important to note that a complete transi-tion to the HEX phase takes place only at very high tempera-tures. Indeed, even at 475 K, i.e., the highest temperature studied, the 共1⫻1兲-induced component does not disappear completely. Since the 共1⫻1兲→HEX transition is an acti-vated process, assuming that the rate follows an Arrhenius equation, we fitted the initial time evolution with the
A exp共−t兲 function, where the rateisexp共−EA/ kBT兲, EA is the energy barrier of the process, is the pre-exponential factor, and kBis the Boltzman constant.
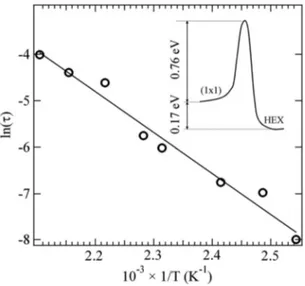
Each series of spectra measured at a different tempera-ture was fitted using three components, with DS lineshape, repeating the analysis several times with the Gaussian line-shape parameters and the BE positions of the different core level components fixed at several values, until the minimal chi-square for the whole series was found. This procedure was adopted in order to take into account the possible con-tribution of first-to-second layer expansion and phonon-induced broadening effects, yielding a reliable estimate of the error bar parameter in the Arrhenius plot reported in Fig.6. The activation energy value derived is 0.76± 0.04 eV. Even if the results are not in disagreement considering the error bars, the activation energy we found is considerably lower than the value of 0.91± 0.17 eV previously reported by means of low energy electron diffraction.28This would imply a transition rate difference at the lower temperature 共T=373 K兲 of about two orders of magnitude.
However, as suggested by He diffraction
measure-ments,30 the preparation method of the metastable 共1⫻1兲 reported in Ref. 28 and used in other experimental investi-gations to prepare the metastable共1⫻1兲 phase52,53results in small traces of atomic hydrogen in the sample共around 5% of ML兲, which can influence the phase transition. For instance, these He diffraction measurements30 demonstrated that a small residual H coverage 共below 10%兲 stabilizes the 共1 ⫻1兲 phase up to more than 400 K.
Indeed it is well known that adsorbates can promote or inhibit atomic surface diffusion. Using STM Horch et al.54 studied the hydrogen-promoted self-diffusion process of platinum adatoms deposited on the 共1⫻2兲 missing-row re-constructed phase of Pt共110兲. In that case, DFT calculations showed that the Pt–H complex consisted of a hydrogen atom trapped on top of a platinum atom, placed in the trough along the 关11¯0兴 direction, resulted in a 0.09 eV reduction of the diffusion barrier, in good agreement with the experimental finding of 0.16 eV. On the contrary, for a 共1⫻1兲-Pt共100兲 surface prepared by the field evaporation technique, Kellogg showed that chemisorbed hydrogen inhibits the exchange displacement diffusion mechanism of Pt adatoms.55 Mobile hydrogen atoms, sitting next to the Pt adatom, increase the diffusion barrier by enhancing the energy required to remove FIG. 5. Time evolution of the integrated intensity of the 共1⫻1兲-related Pt4f7/2surface core level component measured in the 393– 475 K
tempera-ture range. All the intensities have been normalized to the surface compo-nent intensity measured at room temperature. Continuous lines represent the fit with the function A exp共−t兲.
a surface atom from the substrate. In recent theoretical inves-tigations, based on DFT and molecular dynamics simulations,5,45 the mechanism of atom extraction from the second layer creating subsurface vacancies is the process proposed as the first step for the formation of the HEX phase starting from the metastable 共1⫻1兲 structure. We therefore conclude that the higher activation energy value previously obtained using LEED can be ascribed to the presence of residual traces of atomic hydrogen left by a non-optimized preparation procedure.
As mentioned above, the intensity evolution is exponen-tial only iniexponen-tially, most probably a sign of the existence of a different, competing mechanism for the transformation of the 共1⫻1兲 towards the HEX phase. As found by Van Beurden et
al. in MD simulations,5 besides the homogeneous vacancy
formation process, two other heterogeneous processes are ex-pected. The first one involves a reconstruction process, which initiates at step edges, where each second atomic row on the surface shifts half an atomic distance along the关011兴 direction. In the second one, step edges and island corners get dissolved by absorption into surface layers. Both mecha-nisms, which would require a large mass transport from the steps over the surface, are associated with defects and are expected to proceed at a lower rate than the subsurface va-cancy mechanism.
V. CONCLUSION
By monitoring the time evolution of the Pt4f7/2 core level photoemission spectra we have studied the 共1⫻1兲
→quasihexagonal 共HEX兲 phase transformation on Pt共100兲.
We have shown that the 共1⫻1兲 phase, showing a surface core level shifted component at −570 meV, irreversibly re-verts to the HEX phase, characterized by a component at −185 meV, at temperatures above 370 K. The analysis of the intensity evolution of the core level components, measured in the range of 393– 475 K, allowed us to determine the
activation energy of the phase transformation, E
= 0.76± 0.04 eV, which results to be considerably lower than the one previously determined by means of LEED. The dif-ference is explained as due to residual hydrogen in the LEED measurements.
ACKNOWLEDGMENTS
We acknowledge financial support by the MIUR under the program FIRB 2003 and the Swedish Research Council. Calculations were performed at SISSA and at the CINECA computing center, also thanks to INFM-CNR computing grants.
The MAX-lab staff is gratefully acknowledged for tech-nical assistance.
1J. J. Mortensen, T. R. Linderoth, K. W. Jacobsen, E. Lægsgaard, I.
Stensgaard, and F. Besenbacher, Surf. Sci. 400, 290共1998兲.
2G. Ritz, M. Schmid, P. Varga, A. Borg, and M. Rønning, Phys. Rev. B
56, 10518共1997兲.
3A. Borg, A. M. Hilmen, and E. Bergene, Surf. Sci. 306, 10共1994兲. 4V. Fiorentini, M. Methfessel, and M. Scheffler, Phys. Rev. Lett. 71, 1051
共1993兲.
5P. van Beurden and G. J. Kramer, J. Chem. Phys. 121, 2317共2004兲. 6R. Imbihl and G. Ertl, Chem. Rev.共Washington, D.C.兲 95, 697 共1995兲
and references therein.
7P. Van Beurden, B. S. Bunnik, G. J. Kramer, and A. Borg, Phys. Rev.
Lett. 90, 66106共2003兲.
8R. J. Behm, P. A. Thiel, P. R. Norton, and G. Ertl, J. Chem. Phys. 78,
7437共1983兲.
9T. E. Jackman, K. Griffiths, J. A. Davies, and P. R. Norton, J. Chem.
Phys. 79, 3529共1983兲.
10M. Kim, W. S. Sim, and D. A. King, J. Chem. Soc., Faraday Trans. 92,
4781共1996兲.
11R. J. Behm, P. A. Thiel, P. R. Norton, and G. Ertl, Surf. Sci. 121, L553
共1982兲.
12R. J. Behm, P. A. Thiel, P. R. Norton, and G. Ertl, J. Chem. Phys. 78,
7448共1983兲.
13A. Hopkinson, X.-C. Guo, J. M. Bradley, and D. A. King, J. Chem. Phys.
99, 8262共1993兲.
14A. Hopkinson, J. M. Bradley, X.-C. Guo, and D. A. King, Phys. Rev.
Lett. 71, 1597共1993兲.
15Y. Y. Yeo, L. Vattuone, and D. A. King, J. Chem. Phys. 104, 3810
共1996兲.
16K. Mase and Y. Murata, Surf. Sci. 242, 132共1991兲.
17P. Gardner, M. Thushaus, R. Martin, and A. M. Bradshaw, Surf. Sci. 240,
112共1990兲.
18G. Pirug, H. P. Bonzel, H. Hopster, and H. Ibach, J. Chem. Phys. 71, 593
共1979兲.
19M. Gruyters, A. T. Pasteur, and D. A. King, J. Chem. Soc., Faraday
Trans. 92, 2941共1996兲.
20J. M. Bradley, A. Hopkinson, and D. A. King, J. Chem. Phys. 99, 17032
共1995兲.
21J. A. Davies, T. E. Jackman, D. P. Jackson, and P. R. Norton, Surf. Sci.
109, 20共1981兲.
22E. Lang, W. Grimm, and K. Griffiths, J. Vac. Sci. Technol. A 2, 1028
共1984兲.
23K. Griffiths, T. E. Jackmann, J. A. Davies, and P. R. Norton, Surf. Sci.
138, 113共1984兲.
24G. Kneringer and F. P. Netzer, Surf. Sci. 49, 125共1975兲.
25P. R. Norton, K. Griffiths, and P. E. Bindner, Surf. Sci. 138, 125共1984兲. 26R. B. Shumbera, H. H. Kan, and J. F. Weaver, Surf. Sci. 600, 2928
共2006兲.
27A. A. Deskins, J. Lauterbach, and K. T. Thompson, J. Chem. Phys. 122,
184709共2005兲.
28P. R. Norton, J. A. Davies, D. K. Creber, C. W. Sitter, and T. E. Jackman,
Surf. Sci. 108, 205共1981兲.
29R. Nyholm, J. N. Andersen, U. Johansson, B. N. Jensen, and I. Lindau,
Nucl. Instrum. Methods Phys. Res. A 467, 320共2001兲.
30K. Kuhnke, K. Kern, and G. Comsa, Surf. Sci. 343, 44共1995兲. 31A. Locatelli, L. Aballe, T. O. Mentes, M. Kiskinova, and E. Bauer, Surf.
FIG. 6. Arrhenius plot of the rate of the restructuring process obtained from the data in Fig.5. Inset shows a schematic energy diagram illustrating the clean共1⫻1兲→HEX structural transition, with initial and final state energy values obtained by the calorimetric measurements of Yeo et al.共Ref.51兲 and
Interface Anal. 38, 1554共2006兲.
32S. Doniach and M. Šunjić, J. Phys. C 3, 185共1970兲. 33P. Hohenberg and W. Kohn, Phys. Rev. 136, 864共1964兲. 34W. Kohn and L. Sham, Phys. Rev. 140, 1133共1965兲.
35J. P. Perdew, in Electronic Structure of Solids ’91, edited by P. Ziesche
and H. Eshring共Akademie, Berlin, 1991兲, p. 11.
36J. P. Perdew, K. Burke, and M. Ernzerhof, Phys. Rev. Lett. 77, 3865
共1996兲.
37S. Baroni, S. de Gironcoli, A. Dal Corso, and P. Giannozzi, http://
www.quantum-espresso.org.
38D. Vanderbilt, Phys. Rev. B 41, 7892共1990兲.
39M. Methfessel and A. T. Paxton, Phys. Rev. B 40, 3616共1989兲. 40H. J. Monkhorst and J. D. Pack, Phys. Rev. B 13, 5188共1976兲. 41L. Bianchettin, A. Baraldi, S. de Gironcoli, S. Lizzit, L. Petaccia, E.
Vesselli, G. Comelli, and R. Rosei, Phys. Rev. B 74, 45430共2006兲.
42O. Björneholm, A. Nilsson, H. Tillborg, P. Bennich, A. Sandell, B.
Hernäs, C. Puglia, and N. Mårtensson, Surf. Sci. 315, L983共1994兲.
43C. Puglia, A. Nilsson, B. Hernnäs, O. Karis, P. Bennich, and N.
Mårtensson, Surf. Sci. 342, 119共1995兲.
44J. F. Zhu, M. Kinne, T. Fuhrmann, R. Denecke, and H. P. Steinruck, Surf.
Sci. 529, 384共2003兲.
45P. Van Beurden, “On the Surface Reconstruction of Pt-Group Metal,”
Ph.D. Thesis, Eindhoven University of Technology, 2003.
46A. Baraldi, L. Bianchettin, S. de Gironcoli, E. Vesselli, S. Lizzit, L.
Petaccia, G. Zampieri, G. Comelli, and R. Rosei, New J. Phys. 9, 143 共2007兲.
47S. Surnev, M. Sock, M. G. Ramsey, F. P. Netzer, M. Wiklund, M. Borg,
and J. N. Andersen, Surf. Sci. 470, 171共2000兲.
48The partial density of states is defined as the projection of the density of
states onto the atomic wave function iat: ni=兺n兰BZ␦共E
− En共k兲兲兩具iat兩n共k兲典兩2dk, wheren共k兲 is the crystal wave function of the
nth band at wave vector k.
49We define the pth moment of the density of states n
i共E兲 as p =兰pn
i共兲d;0and1/0give the total number of states in the band
and the center of gravity position Bd, respectively.
50A. Baraldi, S. Lizzit, F. Bondino, G. Comelli, R. Rosei, C. Sbraccia, N.
Bonini, S. Baroni, A. Mikkelsen, and J. N. Andersen, Phys. Rev. B 72, 75417共2005兲.
51Y. Y. Yeo, C. E. Wartnaby, and D. A. King, Science 268, 1731共1995兲. 52H. P. Bonzel, G. Broden, and G. Pirug, J. Catal. 53, 96共1978兲. 53P. R. Norton, J. A. Davies, D. K. Creber, C. W. Sitter, and T. E. Jackman,
Surf. Sci. 108, 205共1981兲.
54S. Horch, H. T. Lorensen, S. Helveg, E. Læsgaard, I. Stensgaard, K. W.
Jacobsen, J. K. Nørskov, and F. Besenbacher, Science 398, 134共1999兲.