Atmos. Chem. Phys., 10, 169–199, 2010 www.atmos-chem-phys.net/10/169/2010/ © Author(s) 2010. This work is distributed under the Creative Commons Attribution 3.0 License.
Atmospheric
Chemistry
and Physics
Overview: oxidant and particle photochemical processes above a
south-east Asian tropical rainforest (the OP3 project): introduction,
rationale, location characteristics and tools
C. N. Hewitt1, J. D. Lee2, A. R. MacKenzie1, M. P. Barkley3, N. Carslaw4, G. D. Carver5, N. A. Chappell1, H. Coe6, C. Collier7, R. Commane8,*, F. Davies7, B. Davison1, P. DiCarlo9, C. F. Di Marco10, J. R. Dorsey6, P. M. Edwards8, M. J. Evans11, D. Fowler10, K. L. Furneaux**,†, M. Gallagher6, A. Guenther12, D. E. Heard8, C. Helfter10,
J. Hopkins13, T. Ingham8, M. Irwin6, C. Jones13, A. Karunaharan14, B. Langford1, A. C. Lewis13, S. F. Lim15,
S. M. MacDonald8, A. S. Mahajan8, S. Malpass4, G. McFiggans6, G. Mills16, P. Misztal10,17, S. Moller13, P. S. Monks14, E. Nemitz10, V. Nicolas-Perea14, H. Oetjen8, D. E. Oram16, P. I. Palmer3, G. J. Phillips10, R. Pike5, J. M. C. Plane8, T. Pugh1, J. A. Pyle5, C. E. Reeves16, N. H. Robinson6, D. Stewart16,***, D. Stone8,11, L. K. Whalley8, and X. Yin5 1Lancaster Environment Centre, Lancaster University, Lancaster LA1 4YQ, UK
2National Centre for Atmospheric Science, University of York, York YO10 5DD, UK 3School of GeoSciences, University of Edinburgh, Edinburgh EH9 3JW, UK
4Environment Department, University of York, York YO10 5DD, UK
5Centre for Atmospheric Science, Department of Chemistry, Cambridge University, Cambridge, CB2 1EW, UK 6School of Earth, Atmospheric and Environmental Sciences, University of Manchester, Manchester M13 3PL, UK 7Centre for Environmental Systems Research, University of Salford, Salford M5 4WT, UK
8School of Chemistry, University of Leeds, Leeds LS2 9JT, UK
9CETEMPS – Dipartimento di Fisica, Universit`a di L’Aquila, 67010 Coppito, L’Aquila, Italy 10Biogeochemistry Programme, Centre for Ecology and Hydrology, Penicuik, EH26 0QB, UK 11School of the Environment, University of Leeds, Leeds, LS2 9JT, UK
12National Center for Atmospheric Research, Boulder CO 80301, USA 13Department of Chemistry, University of York, York YO10 5DD, UK 14Department of Chemistry, University of Leicester, Leicester LE1 7RH, UK
15Retired, formerly at Malaysian Meteorological Department, Jalan Sultan, Petaling Jaya, Selangor Darul Ehsan, Malaysia 16School of Environmental Sciences, University of East Anglia, Norwich NR4 7TJ, UK
17Department of Chemistry, University of Edinburgh, Edinburgh EH9 3JW, UK *now at: School of Engineering and Applied Sciences, Harvard University, MA, USA **formerly at: School of Chemistry, University of Leeds, Leeds LS2 9JT, UK
***now at: Department of Chemistry, University of Reading, Reading RG6 6AH, UK †deceased
Received: 8 July 2009 – Published in Atmos. Chem. Phys. Discuss.: 11 September 2009 Revised: 4 December 2009 – Accepted: 9 December 2009 – Published: 12 January 2010
Abstract. In April–July 2008, intensive measurements were made of atmospheric composition and chemistry in Sabah, Malaysia, as part of the “Oxidant and particle photochem-ical processes above a South-East Asian tropphotochem-ical
rainfor-Correspondence to: C. N. Hewitt
est” (OP3) project. Fluxes and concentrations of trace gases and particles were made from and above the rainfor-est canopy at the Bukit Atur Global Atmosphere Watch sta-tion and at the nearby Sabahmas oil palm plantasta-tion, using both ground-based and airborne measurements. Here, the measurement and modelling strategies used, the character-istics of the sites and an overview of data obtained are de-scribed. Composition measurements show that the rainforest
site was not significantly impacted by anthropogenic pollu-tion, and this is confirmed by satellite retrievals of NO2and HCHO. The dominant modulators of atmospheric chemistry at the rainforest site were therefore emissions of BVOCs and soil emissions of reactive nitrogen oxides. At the observed BVOC:NOx volume mixing ratio (∼100 pptv/pptv), current chemical models suggest that daytime maximum OH con-centrations should be ca. 105radicals cm−3, but observed OH concentrations were an order of magnitude greater than this. We confirm, therefore, previous measurements that suggest that an unexplained source of OH must exist above tropical rainforest and we continue to interrogate the data to find ex-planations for this.
1 Introduction
Tropical and equatorial forests account for over half of the World’s forests (1.8 billion ha) and act as a massive source of matter and energy to the lower atmosphere. They exhibit some of the most dynamic yet poorly understood biogeo-chemical behaviour on Earth. This behaviour is driven by solar radiation and is largely mediated by its transformation into latent and sensible heat, with the concomitant uptake of carbon by photosynthesis and the associated emission of re-active, less-reactive and un-reactive trace gases, water vapour and energy into the atmosphere. Simultaneously, ozone and other trace gases, aerosol particles, and momentum, are lost to the forest surface. A further important consequence of the large solar radiation flux in the tropics is the very vigorous convective uplift that occurs, which results in the rapid move-ment of chemical species emitted at or near ground level into the free troposphere, as shown, for example, in Surinam (An-dreae et al., 2001). Hence reactive trace gas emissions from the surface in the tropics may take part in chemical processes at greater distances and at higher altitudes from their sources than might otherwise occur.
Globally, tropical and equatorial forests are estimated to account for almost half of all biogenic reactive volatile organic compound (VOC) emissions into the atmosphere (Guenther et al., 1995, 2006: global total 1150 Tg C/y, es-timate for tropical forests ∼500 Tg C/y). These compounds are believed to play a major role in mediating the istry of the atmosphere, yet their roles in controlling chem-ical budgets and processes in the atmosphere on the local, regional and global scales are poorly understood, with con-siderable and surprising gaps and uncertainties in knowledge remaining (e.g. Lelieveld et al., 2008). In addition, it is pos-sible that biological primary and secondary organic particles play a pivotal role in the formation of cloud condensation nu-clei (CNN) and thus control precipitation patterns in forested regions (Barth et al., 2005).
Most previous work on the interactions between tropical forests and atmospheric composition has been carried out in
Amazonia (e.g. the LBA project: Andreae et al., 2002; Avis-sar et al., 2002), with less in Africa (e.g. the AMMA project: Redelsperger et al., 2006) and very little in SE Asia. Un-like the LBA and AMMA domains, which are contiguous continental regions, the complex mosaic of tropical seas and islands that exists in SE Asia makes the likely atmospheric chemistry occurring there somewhat different to that else-where. Structurally and floristically, the lowland dipterocarp forest of SE Asia is very different to the rainforest of Ama-zonia, and it is not known what differences this may cause in the speciation and rates of emission of VOCs and hence in atmospheric composition and chemistry. Furthermore, there is strong evidence that transport from the boundary layer in this “maritime continent” region into the upper troposphere, and possibly subsequently into the stratosphere, is particu-larly efficient (Fueglistaler and Haynes, 2005), so that the region’s importance to global atmospheric processes may be disproportionately large.
In common with the other tropical forest regions, SE Asia is undergoing very rapid, and in some cases catastrophic, rates of land use change. For example, in Malaysia, the area of total land cover dedicated to oil palm plantations has in-creased from ∼1% in 1974 to ∼13% (FAO, 2005; MPOC, 2008). In spite of attempts to implement policies to conserve rainforest, logging of this dwindling resource continues at a rapid rate, and natural forests are being replaced by crop monocultures.
The multi-national OP3 (“Oxidant and particle photo-chemical processes above a south-east Asian tropical rain-forest”) project had the goal of better understanding the inter-actions that exist between natural forests, atmospheric com-position and the Earth’s climate system. The project had the specific objectives of (a) understanding how emissions of reactive trace gases from a tropical rainforest mediate the regional scale production and processing of oxidants and particles, and (b) better understanding the impacts of these processes on local, regional and global scale atmospheric composition, chemistry and climate. By very closely cou-pling ground-based and airborne measurements of surface fluxes and atmospheric composition of reactive trace gases and particles with modelling studies of chemical processes, the project aimed to address the following questions:
1. What are the rates of transfer of organic compounds emitted from the tropical forest?
2. How are these organic compounds chemically pro-cessed immediately after release?
3. To what extent do the regional organic emissions con-tribute to the atmospheric aerosol in the region, and what are the effects of the aerosol? What is the com-position of the organic fraction of the aerosol?
4. What are the effects of these biogenic emissions on global chemistry and climate?
C. N. Hewitt et al.: The OP3 project: introduction, rationale, location characteristics and tools 171 The OH radical initiates the oxidative degradation of
biogeni-cally emitted VOCs, and its concentration defines the rate of production of secondary products. A consistent and impor-tant finding from field studies conducted in forested environ-ments, characterised by high emissions of isoprene and low levels of NOx, is the significant underestimation of OH by models (Lelieveld et al., 2008; Ren et al., 2008; Butler et al., 2008; Carslaw et al., 2001; Martinez et al., 2008; Tan et al., 2001; Kubistin et al., 2009). These model underestima-tions scale with isoprene concentration and indicate a current inability to correctly describe isoprene oxidation. The OP3 project provided an excellent opportunity to confirm these findings and to seek an explanation. Atmospheric chemistry models, constrained to measured isoprene emission rates, predict dramatic reductions in ambient OH concentrations in forested areas, in contrast to observations and, as a conse-quence, predict unrealistically high concentrations of other trace gas constituents (Guenther et al., 2008). Simultane-ous measurements of the OH concentration, isoprene con-centration and fluxes and isoprene oxidation products were made during OP3, together with many species that control the rate of production and destruction of OH, providing a stringent set of model constraints to investigate in detail any modelled/measured discrepancies for OH.
Similarly, current models suggest that secondary organic aerosol (SOA) in the tropics is dominated by biogenic aerosol (e.g. Kanakidou et al., 2005), but the measurement database is sparse. Emerging first measurements by aerosol mass spectrometry indicate that sub-micrometre organic aerosol concentrations are at the lower end of the model estimates, with median concentrations of around 1 µg m−3observed in subtropical West Africa and Amazonia (Capes et al., 2009). Despite recent progress, our picture of the formation pro-cesses of biogenic SOA (BSOA) is still far from complete (Hallquist et al., 2009). Again, the suite of measurements during OP3 was designed to improve our understanding of the levels, composition and formation processes of BSOA in the SE Asian domain.
As described below, the focus of activity was the Global Atmosphere Watch (GAW) station at Bukit Atur, Sabah, Malaysia, on the island of Borneo (4◦58049.3300N, 117◦50039.0500E, 426 m a.s.l.) (http://gaw.empa.ch/gawsis/). Two field campaigns were held during the periods 7 April–4 May 2008 (OP3-I) and 23 June–23 July 2008 (OP3-III). Dur-ing OP3-III, the UK’s largest atmospheric science research aircraft, a converted BAe 146–301, was based at Kota Kina-balu International Airport during the period 8–23 July 2008 and operated for over 60 h over northern Borneo. Between these two forest campaigns, a sub-set of instruments were de-ployed in an oil palm plantation, where measurements were made during the period 11 May–20 June 2008 (OP3-II).
In this paper, the land use, vegetation and climate char-acteristics of the ground-based measurement sites are de-scribed, together with an overview of the chemical clima-tology of the region. The measurement and modelling tools
used in the project are also described, as are some prelimi-nary conclusions.
2 Climate, weather, land use and vegetation of Sabah 2.1 Equatorial climate and forest formations
The equatorial tropics are characterised by rain throughout the year, i.e., an absence of marked seasonal droughts. This climatic regime covers: (i) Malaysia, Papua New Guinea and much of Indonesia within tropical monsoon Asia, (ii) coastal regions of Liberia, Nigeria and Cameroon, and central Congo in Africa, and (iii) western Amazonia and a belt extend-ing from the western Caribbean coast to the Pacific coast in Ecuador in tropical America (McGregor and Nieuwolt, 1998; Walsh, 1996). The equatorial tropics can be further clas-sified into tropical superwet, tropical wet and tropical wet seasonal, using a perhumidity index, based on a cumulative annual score of the number of months with >200 mm (+2 in-dex value), 100–199 mm (+1), 50–99 mm (−1) and <50 mm (−2) of rainfall (Walsh, 1996). The extent of tropical super-wet and super-wet climates (with a perhumidity index >10) shown in Walsh (1996) is similar to the extent of tropical climates of Asia and America lacking marked dry seasons shown in McGregor and Nieuwolt (1998).
With the exception of the central Congo and the western Caribbean, there is a good correspondence of regions with a tropical wet or superwet climate and the extent of tropi-cal lowland evergreen broadleaf rainforest. This forest for-mation dominates within the majority of the Asian, West African and American wet/superwet zone of the equatorial tropics (Whitmore, 1998), and is the most common forest formation in the tropics as a whole (Schmitt et al., 2008). However, in areas locally above 750–1200 m altitude, low-land evergreen broadleaf rainforest grades into lower mon-tane and then upper monmon-tane forest. Such areas of mountain forests are noted particularly in the wet/superwet zones of the Asian tropics. Within low-lying areas of the wet and super-wet zone, peat swamp, freshwater swamp and heath forest are also present. In areas of podzolic sands, limestone or ul-trabasic rocks other forest formations are developed locally.
The key exception to the link between climate and the extent of lowland evergreen rainforest is found within cen-tral Congo and the western Caribbean, where tropical semi-evergreen rainforest dominates in areas classified as tropi-cal wet. This semi-evergreen forest formation is important throughout the surrounding seasonal tropics of continental tropical Asia, north-east Australia, and eastern and southern Amazonia (Whitmore, 1998).
Within the equatorial tropics, the dominant lowland ever-green broadleaf rainforest is characterised by a lofty (45 m or taller) and dense canopy with a large number of differ-ent tree species occurring together. Usually over two thirds of the upper canopy comprises tree species not contributing
172 C. N. Hewitt et al.: The OP3 project: introduction, rationale, location characteristics and tools more than 1% to the total number (Whitmore, 1998). The
soils typically associated with the occurrence of this forest formation in tropical Asia are the Ultisol group, and within western Amazonia the Oxisol group (Baillie, 1996; Chappell et al., 2007).
2.2 Local climate and forest formations
The majority of the island of Borneo (total area 743 330 km2) has a superwet climate (Walsh, 1996) and the most extensive forest formation is lowland evergreen broadleaf rainforest, occupying some 257 000 km2(Schmitt et al., 2008). A sim-ilar situation is observed at the 76 115 km2regional scale of the state of Sabah, Malaysian Borneo. Within Borneo Island, and elsewhere within equatorial Asia, the lowland evergreen rainforest typically has a tree family dominance of
Diptero-carpaceae (Whitmore, 1984). Most of the state of Sabah was
once covered with rainforest (Schmitt et al., 2008), particu-larly such mixed dipterocarp forest. Currently, some 47% (36 049 km2)of the state lies within Permanent Forest Estate (PFE: Fig. 1a). Most of this PFE (74%) is maintained un-der a selective harvesting system (PFE Production Forest), while the remaining 26% is classified as PFE Protection For-est. Within eastern Sabah, most of the cleared lands are now used for the cultivation of oil palm trees (Fig. 1b). Some commercial timber plantations are also present within Sabah. The Bukit Atur GAW tower used for OP3 sampling is lo-cated within the PFE Production Forest of the Ulu Segama – Malua Forest Reserve, but is less than 5 km east of the 438 km2 area of PFE Protection Forest known as the Danum Valley Conservation Area (DVCA). The Ulu Segama – Malua Forest Reserve is 2411 km2 in area and is divided into annual timber harvesting coupes. The GAW tower lies at the centre of the 22.6 km2 “Coupe 88” which was sub-jected to selective timber harvesting in 1988. An average of 96 m3of timber ha−1was cut by both tractor and high-lead harvesting (Tangki and Chappell, 2008). The central area of this coupe was subsequently rehabilitated by enrichment planting (Moura-Costa, 1996). As part of a study covering a 225 km2area Tangki and Chappell (2008) calculated an av-erage tree biomass of 172 t ha−1 for Coupe 88, (using five inventory plots surveyed in March 1997), and demonstrated a strong correlation (r2=0.76) between such coupe-averaged values and Landsat-5 TM band 4 (near-infra red) radiance. Tangki (2008) demonstrated that Dipterocarpaceae were the most abundant tree family recorded for the 225 km2area as a whole (comprising of only lowland evergreen broadleaf rainforest), but Euphobiaceae had become more abundant in Coupe 88 following timber harvesting.
Within the immediate vicinity of the Bukit Atur GAW tower, we calculate the average perhumidity index to be 22 (using the daily rainfall data for the period 1996–2008 from the Danum Valley Field Centre (DVFC), located 8 km from Bukit Atur at 4◦580N, 117◦4800E, 100 m a.s.l.). Hence Bukit Atur is classified as having a superwet climate. The index
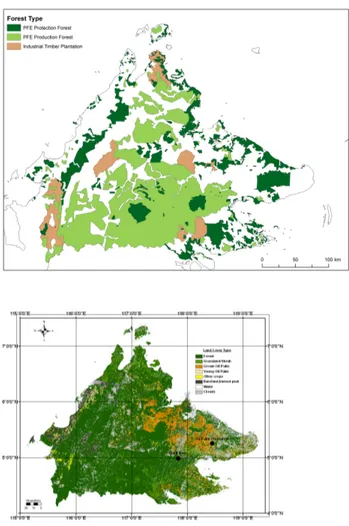
44 Figure 1. Land cover maps of Sabah showing (a) the extent of Permanent Forest Estate (PFE) based on Sabah Forest Department (1998) data, where dark green shows PFE Protection Forest, and light green PFE Production Forest; non-PFE commercial timber plantation is also shown in light brown, and (b) extent of oil palm (orange) and other land covers based on a preliminary classification of remote sensing imagery. The satellite data used to produce this map was medium resolution data from Landsat7-ETM+. Eight images from 2005 to 2008 were used. All the images were first geo-referenced using 1:50,000 topographic maps of Sabah. After refinements of the training area collection, the data were reclassified into the eight land cover classes, excluding cloud and shadow.
Fig. 1. Land cover maps of Sabah showing (a) the extent of
Perma-nent Forest Estate (PFE) based on Sabah Forest Department (1998) data, where dark green shows PFE Protection Forest, and light green PFE Production Forest; non-PFE commercial timber plantation is also shown in light brown, and (b) extent of oil palm (orange) and other land covers based on a preliminary classification of remote sensing imagery. The satellite data used to produce this map was medium resolution data from Landsat7-ETM+. Eight images from 2005 to 2008 were used. All the images were first geo-referenced using 1:50 000 topographic maps of Sabah. After refinements of the training area collection, the data were reclassified into the eight land cover classes, excluding cloud and shadow.
did however range from 9 (1997) to 23 (1999) as a result of the 4–5 year cycle in the rainfall caused by El Ni˜no South Oscillation phenomena (Chappell et al., 2001). During the OP3 campaign year of 2008, the perhumidity index was 22, and therefore identical to the longer-term average.
The 23-year mean rainfall (1986–2008 inclusive) for the DVFC rain gauge is 2840 mm (±438 mm standard devia-tion). The wettest month is typically January with 310 mm precipitation. April is typically the driest month with 155 mm on average, but it also has the most variable rain-fall total with a coefficient of variation (CV) of 69% against
C. N. Hewitt et al.: The OP3 project: introduction, rationale, location characteristics and tools 173 a mean monthly CV of 46%. Indeed, the three-month
pe-riod from February to April has the least predictable rainfall totals, with CV values all over 57%. This variability in rain-fall totals may relate to the period being at the change from the northeast monsoon (approximately November–April) to the southwest monsoon (approximately May–October: Bidin and Chappell, 2006).
Rainfall in 2008 totalled 3220 mm, the fifth wettest year in the 23-year record with 113% of normal rainfall. The mag-nitude of the seasonal variations in rainfall was the smallest on record with a CV of 23%, against the long-term average monthly CV of 47%. This lack of marked seasonality was also shown in the number of days with rainfall. A total of 257 rain-days, the largest number in the 23-year record, were observed in 2008 against an average of 226 rain-days. 2.3 Campaign meteorology
Most of the OP3 measurements were undertaken within the four-month period of April to July 2008. This period was 124% more wet than normal, with 1045 mm of rainfall. No-tably, the driest month according to the longer-term record, April, received 170% of the normal rainfall at 263 mm. The April–July 2008 period was also cooler, with a mean temper-ature of 27.1◦C, which was 99% of the norm for April–July 2001–2008.
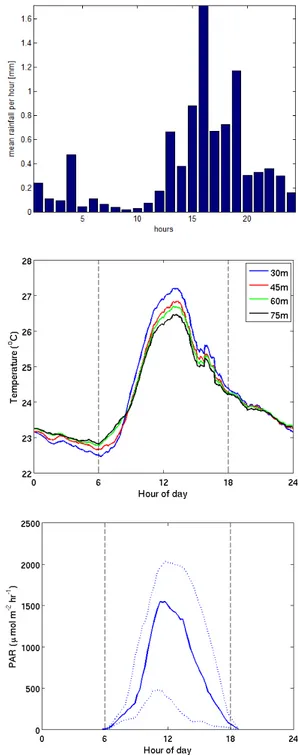
A clear diurnal cycle in the rainfall is observed, even within the records of the relatively short OP3 campaign pe-riod of April–July (Fig. 2a). The presence of a late afternoon peak in rainfall at DVFC, which is more pronounced when several years of data are summarised, as in Bidin and Chap-pell (2006), results from the diurnal development of convec-tive rainfall cells, which is consistent with LIDAR observa-tions (peak rainfall typically observed around 15:00 LT) and measurements of radiation and heat fluxes at the site (Pear-son et al., 2010; Helfter et al., 2010). The predominance of rainfall delivery by convective events also results in an ex-treme localisation of the rainfall field. Within a 5 km2region encompassing the summit of Bukit Atur, Bidin and Chap-pell (2003) demonstrated that inter-gauge correlation in an-nual rainfall totals fell to 0.90 over distances of only 1.1 km, which is short even by comparison with other convective sys-tems.
Figure 2 also shows median temperatures at various heights at Bukit Atur for the combined periods of OP3-I and OP3-III, measured with aspirated thermocouples. The over-all median temperature at 30 m was 25.1±1.6◦C. This is sim-ilar to the long-term surface temperature data from DVFC, taking into account a typical temperature gradient with alti-tude. During the campaign, the atmospheric stability varied from strongly stable at night to strongly unstable during the middle of the day, as would be expected for a convective re-gion with low wind speeds.
When the boundary layer was stable, the rainforest canopy was decoupled from the overlying atmosphere, resulting
45 Figure 2. Local-time diurnal cycles in (top panel) mean rainfall, (middle panel) median temperature at various heights on the Bukit Atur GAW tower, and (bottom) median canopy-top photosynthetically active radiation (PAR), over the OP3 campaign months of April - July 2008. Dashed lines on temperature and PAR graphs show approximate sunrise and sunset times. Dotted lines on the PAR graph show 5th and 95th percentiles.
45 Figure 2. Local-time diurnal cycles in (top panel) mean rainfall, (middle panel) median temperature at various heights on the Bukit Atur GAW tower, and (bottom) median canopy-top photosynthetically active radiation (PAR), over the OP3 campaign months of April - July 2008. Dashed lines on temperature and PAR graphs show approximate sunrise and sunset times. Dotted lines on the PAR graph show 5th and 95th percentiles.
Fig. 2. Local-time diurnal cycles in (top panel) mean rainfall,
(mid-dle panel) median temperature at various heights on the Bukit Atur GAW tower, and (bottom) median canopy-top photosynthetically active radiation (PAR), over the OP3 campaign months of April– July 2008. Dashed lines on temperature and PAR graphs show ap-proximate sunrise and sunset times. Dotted lines on the PAR graph show 5th and 95th percentiles.
very frequently in nocturnal radiation fogs. LIDAR data (not shown) demonstrate this, and also suggest a day-time (10:00–18:00 LT) mixing height of ∼800 m. The strong
174 C. N. Hewitt et al.: The OP3 project: introduction, rationale, location characteristics and tools daytime turbulence, along with weak winds, makes
chemi-cal box-modelling a reasonable strategy for interpretation of daytime atmospheric composition (Sect. 5, below), but un-derstanding measurements made at night, when the atmo-sphere near the surface is strongly stratified, requires more careful consideration of vertical mixing (Pugh et al., 2010a). The bottom panel of Fig. 2 shows the diurnal cycle in pho-tosynthetically active radiation (PAR), measured at canopy-top height. There is a tail of dull days (shown by the 5th percentile) but, on the whole, the period of the campaign was bright. The warm temperatures and bright sunshine produced substantial emissions of biogenic volatile organic compounds (BVOCs) from the forest (Sect. 4.2.2, below).
Turning from vertical mixing/convective effects, to take a more horizontal/advective view, backwards air mass tra-jectories were analysed in order to characterise the origins of chemical species measured at Bukit Atur during the mea-surement campaigns. They were calculated by the British At-mospheric Data Centre (BADC) Web Trajectory Service us-ing European Centre for Medium-Range Weather Forecasts (ECMWF) wind fields. A series of trajectories was calcu-lated, with one trajectory for every hour during OP3-I and OP3-III. These were then analysed to give an ensemble rep-resentation of air mass residency time as a function of loca-tion for the whole of each campaign (Ashbaugh et al., 1985). Back trajectories are calculated for the 24 h before arrival at Bukit Atur, with a time resolution of 30 min, and a final pressure altitude of 950 hPa. Back trajectories that touch the ground have been removed. Figure 3a and b show air mass residency time on a 0.1◦×0.1◦grid for all back trajectories from the first and third campaign periods, respectively.
The first campaign period (OP3-I) was influenced by air masses from most directions, in contrast to OP3-III when the air was predominantly from the south. The southern air in the third period can be split into two main areas of origin: the SE air from the sea with a minimal fetch over land, and the SW air which is exclusively over land. This can be used to identify and compare periods of marine and terrain influ-enced air. It is possible to extend this analysis by using only trajectories from periods when a certain measurement is ele-vated, giving a coloured probability distribution of the source of the measured quantity. A subsequent paper will use these techniques to present a more in-depth analysis of chemical origins in the future.
2.4 Land-cover classification and VOC emissions modelling
Biogenic VOC emissions are highly sensitive to land-cover characteristics and can vary over several orders of magni-tude across different landscapes. This is partly due to vari-ability in total biomass density but is greatly enhanced by variability among different plant species, especially for com-pounds such as isoprene that are emitted by less than a third of all plant species. This presents a daunting challenge for
at-47
(top panel) OP3-I and (bottom panel) OP3-III. No colour means no trajectories passed
over that area in the last 24 hours.
Fig. 3. Air mass residency times for air reaching Bukit Atur (black
circle) during (top panel) OP3-I and (bottom panel) OP3-III. No colour means no trajectories passed over that area in the last 24 h.
tempts to characterize regional BVOC emissions, especially in highly diverse tropical forests.
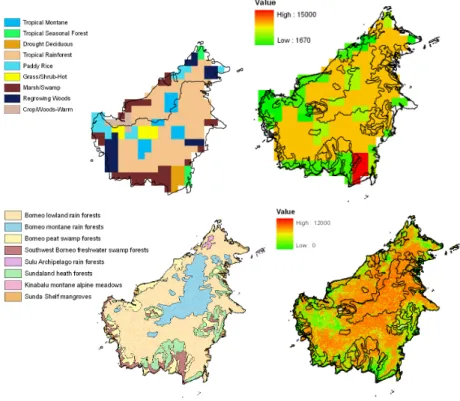
Guenther et al. (1995) estimated global biogenic VOC emissions using the highest resolution (0.5◦) and most de-tailed global map of land-cover and land-use (Olson, 1992) available at that time. Figure 4 (top left panel) illustrates the Olson (1992) classification of Borneo landscapes, which include six unmanaged land-cover types, dominated by trop-ical rainforest (50%), marsh/swamp (14%) and troptrop-ical mon-tane (7%) and three managed land-cover types dominated by re-growing woods (9%) and paddy rice (7%). The associ-ated isoprene emission factor map shown in Fig. 4 (top right panel) characterizes the gross features of Borneo but does not represent the full diversity of landscapes in this region. A major limitation of the Olson global ecosystem approach is that, for example, all re-growing woods are lumped together and observations from North American and European forests
C. N. Hewitt et al.: The OP3 project: introduction, rationale, location characteristics and tools 175
48 Figure 4. Land cover distributions for Borneo used by the global biogenic VOC emissions inventory of Guenther et al 1995) (top left) and by MEGAN (Guenther et al. 2006)(bottom left) and associated isoprene emission factor (µg m-2 h-1) map used by Guenther et al. (1995) (top right) and by MEGAN (Guenther et al. 2006) (bottom right).
Fig. 4. Land cover distributions for Borneo used by the global biogenic VOC emissions inventory of Guenther et al., 1995) (top left) and
by MEGAN (Guenther et al., 2006) (bottom left) and associated isoprene emission factor (µg m−2h−1)map used by Guenther et al. (1995) (top right) and by MEGAN (Guenther et al., 2006) (bottom right).
were used to assign a single isoprene emission factor to all occurrences of this land-cover type across the globe. The Guenther et al. (1995) estimate of annual isoprene emission from Borneo is about 10 Tg of carbon, which is 2% of the estimated global total.
The availability of satellite observations has greatly im-proved quantitative estimates of eco-region distributions and other land-cover variables, including leaf area indices (LAI) and plant functional type (PFT) cover fractions. In addi-tion, the development of a global geo-referenced eco-region map by Olson et al. (2001) represents an additional major advance for biogenic emission modeling. This high reso-lution digital map is the product of over 1000 biogeogra-phers, taxonomists, conservation biologists and ecologists from around the world. Each of the 867 eco-regions rep-resented on this map has relatively uniform species com-position and is accompanied by an online database (http: //www.nationalgeographic.com/wildworld/) that includes a description of the dominant plant species. Figure 4 (lower left) shows that this database divides Borneo into seven eco-regions with Borneo lowland rainforests covering just over half of the total land area, Borneo montane rainforests and Sundaland heath forests together comprise about 25%, and the remaining four ecoregions (Kinabalu montane alpine meadows, Borneo peat swamp forests, Borneo freshwater swamp forests, Sunda Shelf mangroves) each make up 1 to
8% of the total. While the total area associated with broad types (e.g. tropical forest, montane forest) agree reasonably well with the Olson (1992) database, the details differ con-siderably. Figure 4 (bottom right) shows that land-cover re-sults in considerable differences between the isoprene emis-sion factor distribution of Guenther et al. (1995) and the MEGAN model (Guenther et al., 2006) which uses the Ol-son et al. (2001) eco-region map and satellite derived PFT (e.g. crop, broadleaf tree, shrub) cover fractions. In addition, MEGAN uses plant species composition estimates from the Olson et al. (2001) global terrestrial eco-region database and the Leff et al. (2004) crop species distribution database. Al-though the spatial pattern is quite different, the annual iso-prene emission for Borneo differs by less than 5% when the MEGAN land-cover is used in place of Guenther et al. (1995) land-cover data. This good agreement, however, is the result of major offsetting differences between these two land-cover databases. The Guenther et al. (1995) foliar density and LAI estimates are about 50% higher, resulting in about 25% more isoprene, but the emission factors are about 25% lower. The result is a very similar annual isoprene emission but for dif-ferent reasons.
The MEGAN framework can be used to estimate re-gional to global biogenic VOC emissions but the accuracy of the results is dependent on the availability of representative measurements of individual ecoregions. A lack of BVOC
measurements from Borneo resulted in the assignment of MEGAN version 2.1 emission factors to the ecoregions of Borneo that were based on observations from other tropical regions. Improved estimates for future versions of MEGAN and other models are highly dependent on the availability of observations characterizing the dominant plant functional types within major global ecoregions. In fact, our initial anal-ysis of emissions from Bukit Atur show that the default base emission rates in MEGAN prior to the OP3 observations are a factor of four too high for this forest ecoregion. We also confirm that, unusually for a species classified as crop in MEGAN, oil palm is an intense isoprene emitter.
3 Measurement strategy and methods
The overall measurement strategy for OP3 was to perform integrated measurements from the forest-floor, through the forest canopy, above the canopy and then up-scaled to the regional scale using airborne measurements, with clear link-ages between measurements made at the different sites at the different scales.
3.1 Ground based measurements
Ground based measurements were centred on the 100 m tower at the Bukit Atur GAW station (4◦58049.3300N, 117◦50039.0500E, 426 m a.s.l.) (http://gaw.empa.ch/gawsis/).
An “in-canopy” sampling site was established 2 km E of the Bukit Atur tower (4◦58049.1000N, 117◦51019.1200E) and a
further “oil palm plantation” sampling site was established at the Sabahmas oil palm estate, 70 km NE of Bukit Atur (5◦14058.6900N, 118◦27015.7600E).
3.1.1 Forest floor (soil) NOxflux measurements
The fluxes of NOx from forest soil were measured using a continuous automated dynamic chamber system at the “in-canopy site”. Seven spatially distributed chambers were used in order to represent the spatial variation inherent in soil NOx emissions at each site. The chamber construction and oper-ation is described in Pilegaard (2001) while the flux calcula-tion method was modified from Conrad (1994), with further details available in Dorsey and Gallagher (2010). In addition, fluxes of nitrous oxide (N2O) and methane (CH4)were made at the “in-canopy site”, at a near-by undisturbed primary for-est site, at a heavily disturbed road-side site and from the soils at the oil palm plantation (see below), using static soil chambers (Siong et al., 2009; Ryder et al., 2010).
3.1.2 Within-canopy concentration profiles
At the “in-canopy site”, measurements were made of the vertical gradients (from the ground to 32 m height) of the concentrations of ozone, NOx, volatile organic compounds,
particle size distribution and composition, as well as tem-perature, relative humidity, radiation and turbulence. Four platforms were strapped against an emergent tree (Canarium
decumanum), at 8, 16, 24, 32 m. Each platform sup-ported sonic anemometers, inlets to a gradient system for O3/NO/NO2and fine thermocouples. In addition, an auto-mated winch system continuously raised and lowered a tem-perature/humidity probe, a PAR sensor, an optical particle spectrometer (GRIMM 1.08) and an inlet leading to a PTR-MS. This gave vertical gradient measurements between 2 and 28 m (Ryder et al., 2010). In a clearing near the in-canopy site, LIDAR measurements were made of wind speed and di-rection and of aerosol backscatter throughout the boundary layer.
3.1.3 Concentration and flux measurements at Bukit Atur
The largest number of ground-based measurements were made at the Bukit Atur GAW station, which routinely records CO2 and O3 mixing ratios, and various aerosol parame-ters. The station consists of a main building with four air-conditioned laboratories at the base of a 100 m tower, all lo-cated in a large (∼150×50 m) clearing on the top of a hill and surrounded by forest. The surrounding forest canopy ex-tends ∼10 m above the base of the tower. Four mobile sea-container laboratories were deployed around the base of the tower to provide extra instrument accommodation. Electri-cal power was provided by generators, located 2 km E of the station. Pollution events, attributable to individual vehicles arriving on site, the generators, or to small leaks of reactive compounds on site, were identified by elevated concentra-tions of the oxides of nitrogen and by wind direction analy-sis, and are excluded from subsequent data analysis. Table 1 summarises the measurements made at Bukit Atur: the criti-cal measurements included:
– eddy covariance and gradient flux measurements of trace gases and particles;
– speciated concentration measurements of trace gases and particles;
– measurements of aerosol size-dependent hygroscopicity and critical supersaturations for cloud growth;
– concentration measurements of OH, HO2, and the sum of hydroperoxy and organic peroxy radicals;
– OH reactivity measurements (the rate at which OH is removed from the atmosphere);
– characteristics of boundary layer turbulence and mix-ing.
C. N. Hewitt et al.: The OP3 project: introduction, rationale, location characteristics and tools 177
49
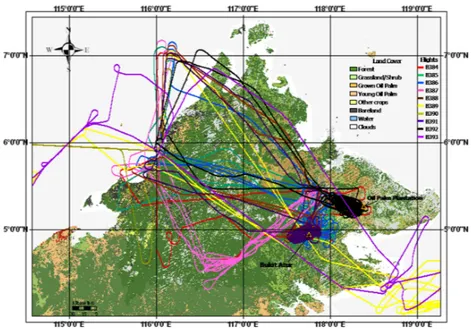
Figure 5. Flight tracks of the BAe 146 research aircraft over Sabah during OP3-III. The underlying map is as shown in Fig. 1b.
Fig. 5. Flight tracks of the BAe 146 research aircraft over Sabah during OP3-III. The underlying map is as shown in Fig. 1b.
3.1.4 Concentration and flux measurements at the Sabamas oil palm plantation
The Sabahmas oil palm plantation measurement site used during OP3-II was located in a 33 ha flat area of oil palm (Elaeis guineensis × Elaeis oleifera hybrid, progeny “Guthrie”) trees. The trees were of uniform age (12 years) and height (12 m). The site comprised a 15 m tower and an 8 m canopy access platform. Instruments were housed in a hut at the base of the platform. The analytical methods used were the same as at Bukit Atur, including the measurements of aerosol sub-micrometre composition, fluxes of aerosol, BVOCs, ozone and CO2, although the suite of measurements made was not as comprehensive. In particular, measurements of OH and other radicals and of the oxides of nitrogen were not made.
3.1.5 Airborne measurements
Airborne measurements (see Table 1) were made dur-ing OP3-III usdur-ing the Natural Environment Research Council/UK Meteorological Office’s BAe 146–301 Facility for Airborne Atmospheric Measurements (FAAM) aircraft (Lewis et al., 2007), deployed to Kota Kinabalu airport, less than 30 min flying time from Bukit Atur. In general, the same type of flight plan was executed on each flight, with one pro-file up and one down, interrupted by straight and level runs at altitudes of 100–250, 1500, 3000 and 6000 m above ground over the rainforest (centred on Bukit Atur), over an exten-sive and homogeneous agro-industrial oil palm landscape surrounding and including the Sabahmas oil palm plantation estate, and in transects between the two sites. Flights were made morning and afternoon giving typically four stacked
profiles, allowing a picture to be built up of the concentra-tions of trace gases and particles during the daytime. Two flights were also made over the ocean up- and down-wind of Sabah.
In order to link the ground-based and airborne measure-ments, the aircraft flew past the Bukit Atur measurement sta-tion on more than ten occasions, at the same height above sea-level as the base of the GAW tower and at approximately 500 m horizontal separation. Table 2 summarises the flights made during the OP3 deployment and Fig. 5 shows the geo-graphical extent of the flights over Sabah.
4 The chemical climatology of Sabah and Bukit Atur 4.1 Satellite observations
Satellite observations of key tropospheric trace gases allow the surface and aircraft trace gas measurements above the rainforest surrounding Bukit Atur to be put in a wider context relative to Borneo and the larger south-east Asian region. We focus on formaldehyde (HCHO) and nitrogen dioxide (NO2), which are good indicators of emissions and photochemical activity, to examine the atmospheric chemistry over Borneo during the OP3 campaigns in 2008. Global background con-centrations of HCHO are determined by the balance between the source (from the oxidation of methane) and the OH sink. Concentrations are typically much larger over continents due to additional sources from the oxidation of biogenic and an-thropogenic VOCs, and from biomass burning (either di-rectly released or from the oxidation of co-emitted VOCs) (Palmer et al., 2003; Fu et al., 2007). Anthropogenic activi-ties, biomass burning and soil emissions are the main source
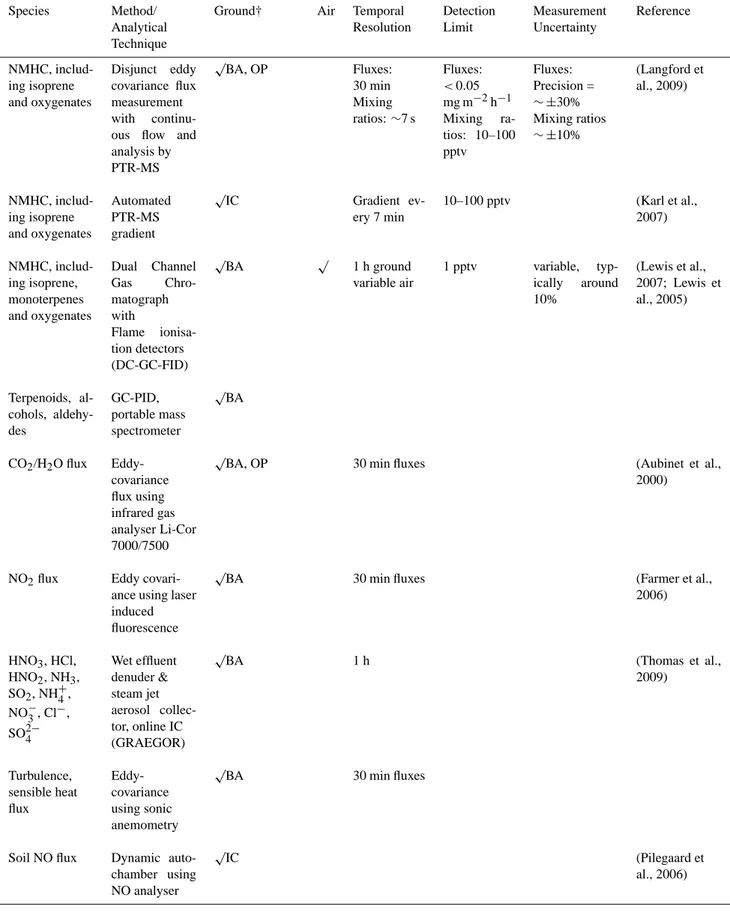
Table 1. Overview of the measurements made in OP3.
Species Method/ Analytical Technique
Ground† Air Temporal Resolution Detection Limit Measurement Uncertainty Reference NMHC, includ-ing isoprene and oxygenates Disjunct eddy covariance flux measurement with continu-ous flow and analysis by PTR-MS √ BA, OP Fluxes: 30 min Mixing ratios: ∼7 s Fluxes: <0.05 mg m−2h−1 Mixing ra-tios: 10–100 pptv Fluxes: Precision = ∼ ±30% Mixing ratios ∼ ±10% (Langford et al., 2009) NMHC, includ-ing isoprene and oxygenates Automated PTR-MS gradient √ IC Gradient ev-ery 7 min 10–100 pptv (Karl et al., 2007) NMHC, includ-ing isoprene, monoterpenes and oxygenates Dual Channel Gas Chro-matograph with Flame ionisa-tion detectors (DC-GC-FID) √ BA √ 1 h ground variable air 1 pptv variable, typ-ically around 10% (Lewis et al., 2007; Lewis et al., 2005) Terpenoids, al-cohols, aldehy-des GC-PID, portable mass spectrometer √ BA CO2/H2O flux Eddy-covariance flux using infrared gas analyser Li-Cor 7000/7500 √
BA, OP 30 min fluxes (Aubinet et al., 2000)
NO2flux Eddy
covari-ance using laser induced fluorescence
√
BA 30 min fluxes (Farmer et al., 2006) HNO3, HCl, HNO2, NH3, SO2, NH+4, NO−3, Cl−, SO2−4 Wet effluent denuder & steam jet aerosol collec-tor, online IC (GRAEGOR) √ BA 1 h (Thomas et al., 2009) Turbulence, sensible heat flux Eddy-covariance using sonic anemometry √ BA 30 min fluxes
Soil NO flux Dynamic auto-chamber using NO analyser
√
IC (Pilegaard et
C. N. Hewitt et al.: The OP3 project: introduction, rationale, location characteristics and tools 179
Table 1. Continued.
Species Method/ Analytical Technique
Ground† Air Temporal Resolution Detection Limit Measurement Uncertainty Reference Soil N2O/CH4 flux Static soil chamber with off-line GC analysis √ IC, OP 1 h OH, HO2 FAGE (Fluorescence Assay by Gas Expansion) laser-induced fluorescence √ BA 10 s (OH) 2.4×10⁵ molecule cm−3(3 min av.) (HO2) 3.8×10⁶ molecule cm−3(3 min av.) 44 % (OH) 50 % (HO2) (2σ ) (Whalley et al., 2010a, b) OH, HO2 FAGE (Fluorescence Assay by Gas Expansion) laser-induced fluorescence √ 60 s (OH) 2.3×10⁶ molecule cm−3(1 min av.) (HO2) 2.0×10⁶ molecule cm−3(1 min av.) 28 % (OH & HO2)(2σ )
OH Reactivity FAGE √BA 1 min 22 % (2σ ) (Ingham et al., 2009) 6RO2+ HO2, HO2 PERCA (PEr-oxy Radical Chemical Am-plifier), dual in-let √ BA √ 1 min 0.4 pptv (10 min) 38% (1σ ) (Fleming et al., 2006) NO3, CH2O, NO2, HONO, O3, CHOCHO Differential Optical Ab-sorption Spectroscopy √ BA 10min 2 pptv, 480 pptv, 80 pptv, 150 pptv, 4.6 ppbv, 150 pptv 1.5 pptv, 500 pptv, 60 pptv, 130 pptv, 4 ppbv, 130 pptv (Plane and Saiz-Lopez, 2006) NO2, HCHO, CHOCHO
MAX-DOAS √BA (Leigh et al.,
2006) Photolysis fre-quencies (incl. j(O1D),j(NO2)) Calibrated filter (2π and 4π sr) radiometers and spectral-radiometer √
BA/IC √ 1s n/a 14% and 13% 0–90◦SZA (Bohn et al., 2008; Edwards and Monks, 2003; Volz-Thomas, et al., 1996) O3 UV absorption √ BA √ 1 s 0.6 ppbv 10%±3.4 ppbv (±1σ ) (Heard et al., 2006)
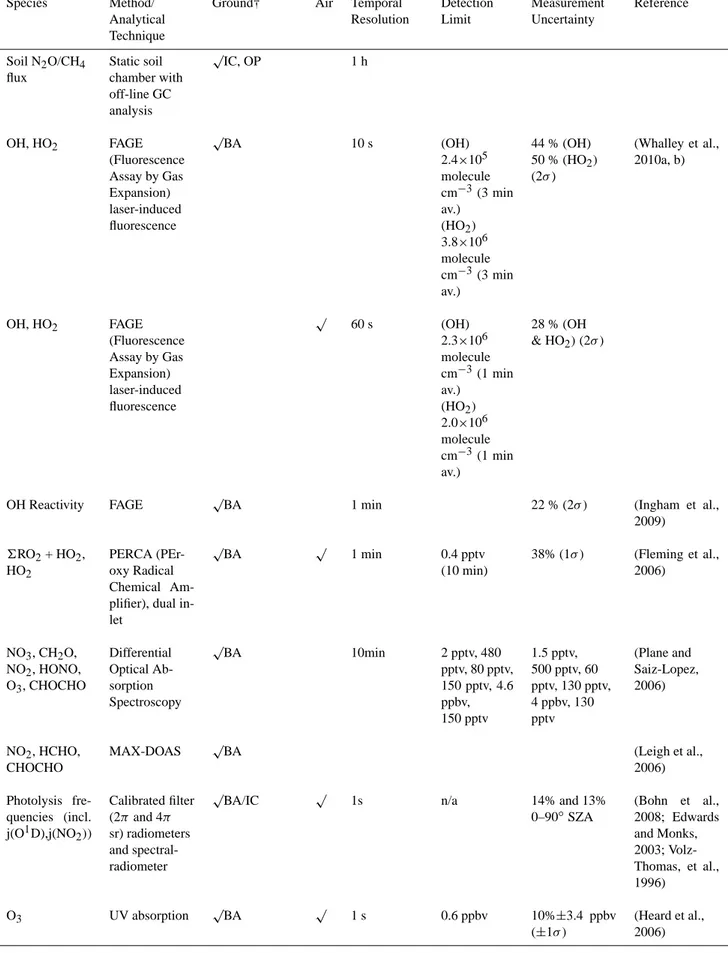
Table 1. Continued.
Species Method/ Analytical Technique
Ground† Air Temporal Resolution Detection Limit Measurement Uncertainty Reference O3flux eddy correlation Dry chemilu-minescence √
BA, OP 30 min fluxes from 0.05 s 0.1 ppbv (G¨usten et al., 1990; Gusten and Heinrich, 1996) O3/NO/NO2 gradient Chemilu-minescence (O3), thermal converter √ BA/IC 15 min NO NO2 6NOy, 6NOy-HNO3 NO/O3 chemi-luminescence detectors Pho-tochemical convertor + above Gold tube/CO converter + above
Gold tube con-vertor and de-nuder √ BA 10 min 3 pptv for NO, 7 pptv for NO2 15% for NO and 20% for NO2at 50 pptv Pike et al., 2009 NO NO2 6NOy, 6NOy-HNO3 NO/O3 chemi-luminescence detectors Pho-tochemical convertor + above Gold tube/CO converter + above
Gold tube con-vertor and de-nuder √ 10 s 3 pptv for NO and 15 pptv for NO2 8% for NO at 1 ppbv and 9% for NO2at 1 ppbv (Brough et al., 2003; Stewart, et al., 2008) NO2 Laser-induced fluorescence (LIF) √ BA 1 Hz 3.6 pptv/60 s 20% (Dari-Salisburgo et al., 2009) 6PNs Thermal-dissociation LIF √ BA 1 Hz 13 pptv/60 s 40% (Dari-Salisburgo et al., 2010) 6ANs Thermal-dissociation LIF √ BA 1 Hz 13 pptv/60 s 40% (Aruffo et al., 2010) NO2flux LIF-Eddy covariance √ BA 10 Hz 11 pptv/60s 20% (Dari-Salisburgo et al., 2010)
C. N. Hewitt et al.: The OP3 project: introduction, rationale, location characteristics and tools 181
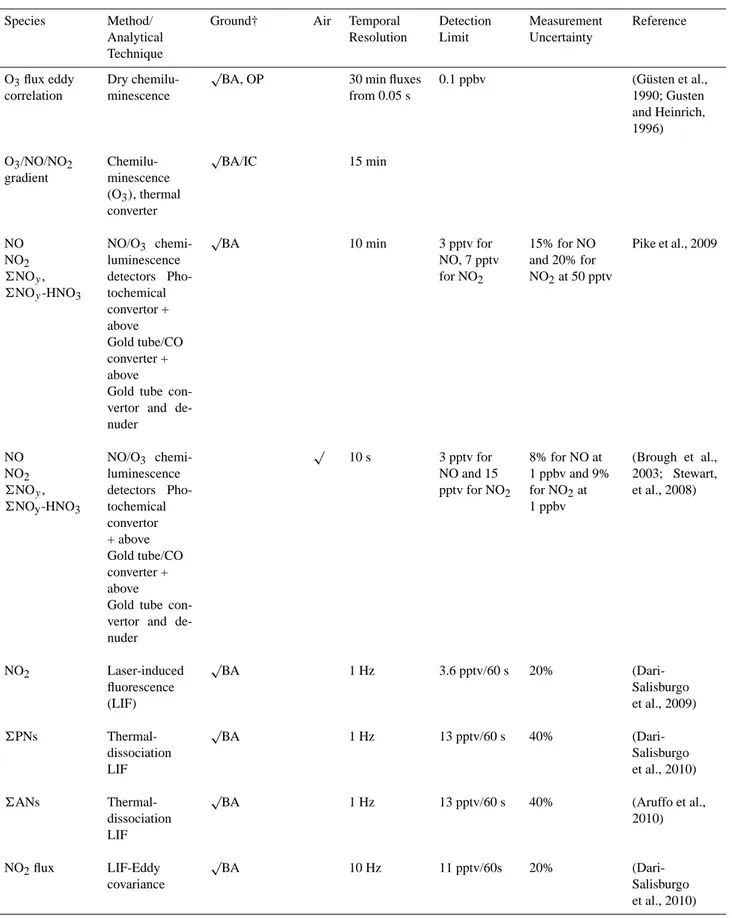
Table 1. Continued.
Species Method/ Analytical Technique
Ground† Air Temporal Resolution Detection Limit Measurement Uncertainty Reference H2O2, 6 ROOH Dual-channel fluorometric detector √
1 min 50 pptv 14% (1σ ) (Penkett et al., 1995)
H2O vapour Dew point hygrometer √ BA √ H2O flux Eddy-covariance using UV Absorption √ BA 30 min fluxes 100 Hz 8% (q-dependent) (Coe et al., 1995) CH2O Fluorometric detection (Hantzsh reaction) √
BA 1 min 100 pptv 17% (2σ ) (Still et al., 2006) Speciated alde-hydes, ketones and alcohols NMHC, includ-ing isoprene and oxygenates GC/GC detec-tion, PTR-MS √ 15 s 50–120 pptv 13–16% (1σ ) >C7 NMHC (e.g. terpenes) Adsorbent tubes & GC/TOF-MS √
Variable 50 pptv ±(5%+20 pptv) (Capes et al., 2009) CO Chemilu-minesence √ BA √ (Gerbig et al., 1999) PAN GC/ECD
(elec-tron capture de-tection)
√
90 s 5 pptv 5% (Whalley et al., 2004)
PAN GC/ECD (elec-tron capture de-tection) √ BA 10 min PAN:15 pptv, PPAN, MPAN:25 pptv 20% (2σ ) (Harrison et al., 2006) Alkyl nitrates, organic N GC and neg-ative ion CI GC/MS √ BA √ G: 1 h A: variable 0.005 pptv 13% (2σ ) (Reeves et al., 2007; Worton et al., 2008) Reactive halocarbons GC/MS √BA √ G: 1 h A: variable 0.005 pptv 15% (2σ ) (Worton et al., 2008)
Halocarbons GC/ECD √BA ∼15 min ∼0.5 pptv 5–10% (Gostlow et al., 2009)
Table 1. Continued.
Species Method/ Analytical Technique
Ground† Air Temporal Resolution Detection Limit Measurement Uncertainty Reference Aerosol number concentration CPCs total particle number concentration (>3 nm); √ BA √ 30 min (ground) 1 s (aircraft) N/A N/A Aerosol size distribution SMPS ground: 3< Dmd <700 nm Air: 3< Dmd <350 nm √ BA/IC √ 30 min (ground) 1 min (aircraft) N/A N/A Optical and aerodynamic particle counters (0.3/0.1– 20/3µm) √ BA/IC √ 30 min (ground) 1 s (aircraft) in-canopy gradients (2–32 m) N/A N/A Ultra-fine particle fluxes Eddy Correla-tion Dp>3 nm, >10 nm, inde-pendent CPCs √ BA Fluxes 30 min. Raw 0.3 s. <0.01 particle/cm3 ±10% @ 3×10⁵ particles/cm3. (Buzorius et al., 1998) Aerosol size segregated chemical composition Aerodyne Aerosol Mass Spectro-meter (40 nm< Dvad< 0.8 µm), non-refractory SO2−4 , NO−3, NH+4, organic species √ BA, OP √ 30 min (ground) 10 s (profile) 30 s (SLR) Ground: 3 ng m−3(NO−3, SO2−4 )and 11 ng m−3 (NH+4), 10 min average, high res mode Air: 3 ng m−3(NO−3, SO2−4 )and 30 ng m3 (NH+4)30 s average 15% Ground: (Aiken et al., 2008; Cana-garatna et al., 2007) Aircraft: (Crosier et al., 2007) Size segregated chemically spe-ciated aerosol mass fluxes Eddy-covariance using Aero-dyne Aerosol Mass Spec-trometer. (40 < Dvad<800 nm), non-refractory SO2−4 , NO−3, NH+4, organic species √ BA, OP 30-min fluxes 10 ng m−2 s−1 ±10 ng m−2 s−1 (Nemitz et al., 2008)
C. N. Hewitt et al.: The OP3 project: introduction, rationale, location characteristics and tools 183
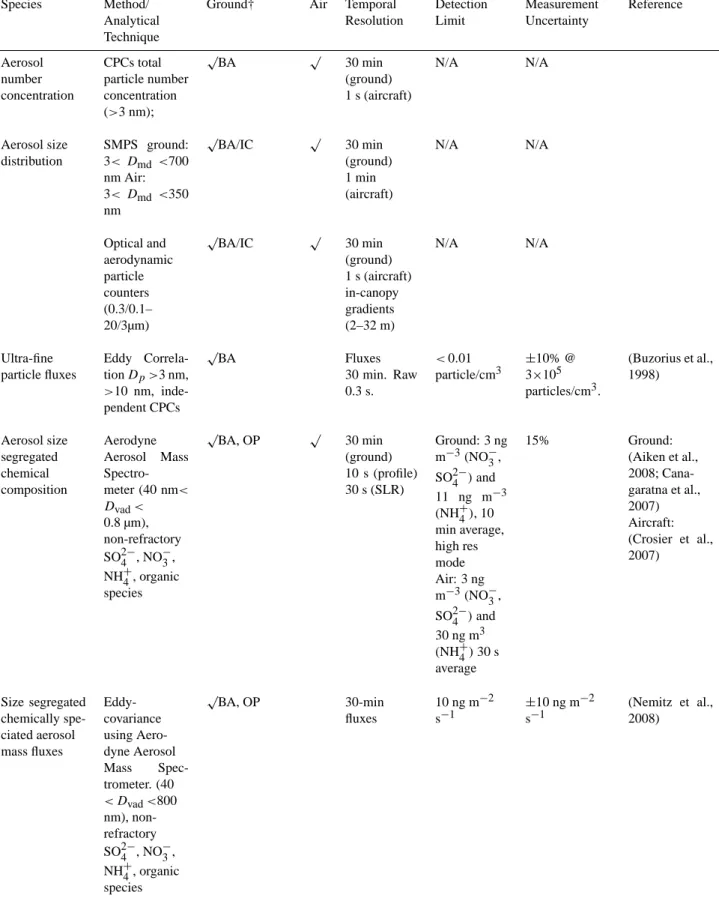
Table 1. Continued.
Species Method/ Analytical Technique
Ground† Air Temporal Resolution Detection Limit Measurement Uncertainty Reference Size-segregated bioaerosol
WIBS √BA, IC (Kaye et al.,
2005) Genetic bioaerosol Genetic analy-sis of filters √ BA, IC, OP 12-h Cloud liquid water Gerber PVM-100 √ 0.1 s 0.005 g m−3 (Gerber, 1991) Aerosol Scat-tering proper-ties 3 wavelength nephelometer √ 2 mm−1 5% (Osborne et al., 2008) Cloud Conden-sation Nuclei Activity CCN spectrometer √ BA (single) √
(two) 1 h (ground) (Roberts and Nenes, 2005) Aerosol hygro-scopicity Hygroscopic Tandem Differ-ential Mobility Analyser √ BA 1 h (Gysel et al., 2007) Meteorological parameters (Wind speed & direction, solar radiation, PAR, precipita-tion, wetness, pressure, tem-perature, RH, turbulence, sen-sible heat flux)
Standard mete-orological sen-sors (aspirated thermocouples, Vaisala WXT) √
BA, IC, OP 30 min temperature gradients
Boundary Layer Height
LIDAR √BA 1 s 20–60 m (Pearson et al., 2009)
† – BA=Bukti Atur site; IC=In-canopy site; OP=oil-palm site (OP3-II).
of variability in the tropospheric NO2columns (Martin et al., 2002, 2003).
Figure 6a and b shows HCHO and NO2column distribu-tions over Borneo during April–July 2008, quantified using UV spectroscopic measurements taken by the nadir-viewing data from SCIAMACHY (HCHO; De Smedt et al., 2008) and OMI (NO2; ATBD-OMI-02) instruments respectively. NO2 is a strong absorber at UV wavelengths and, because the OMI instrument provides daily coverage, the NO2 col-umn data can be averaged onto a fine resolution grid of 1.0◦×1.0◦ (longitude × latitude). In contrast, we average
the HCHO columns onto a coarser 2.5◦×2.0◦ grid (to im-prove the signal-to-noise ratio), since it is a much weaker absorber and because global coverage is only achieved by SCIAMACHY at the Equator every 6 days. Scenes with frac-tional cloud coverage >40% are excluded from our analysis. Figure 6b shows that NO2measurements from OMI iden-tify anthropogenic NOx signals from Bangkok, Jakarta, Surabaya and Singapore. Enhanced HCHO also seen over these cities indicates intense photochemical activity, likely associated with polluted conditions. Over Indochina in April, elevated HCHO and NO2 columns are loosely correlated
Table 2. Overview of aircraft flights made in OP3.
Flight Flight description Date in 2008 Take off-Landing Times (UTC) B384 Survey flight (Bukit Atur, oil palm, SW of Kota
Kinabalu)
9 July 02:13–05:32
B385 Bukit Atur (ground sampling site) and SW of Kota Kinabalu
10 July 01:10–05:04 07:04–10:41 B386 Bukit Atur 12 July 01:02–04:48 06:10–9:59 B387 Maliau Basin, S of Sabah.
N of Bukit Atur and W of oil palm plantation
13 July 00:54–06:01 06:30–10:10 B388 Bukit Atur and oil palm 15 July 00:54–04:43 06:01–09:33 B389 Ocean flight SE of Sabah 16 July 00:49–04:31 05:39–09:40 B390 CASCADE (Marine flight, W and NW of Sabah) 18 July 22:57–03:14 B391 SW of Bukit Atur, oil palm 19 July 00:54–05:06 06:15–09:48 B392 Mainly oil palm plantation 21 July 00:48–04:46 05:53–09:46 B393 Ocean flight (NW and SE of Sabah) 22 July 00:43–05:10 Local Time is (UTC+8).
with AATSR fire-counts (not shown) (Arino et al., 2005) and hence are probably due to fire emissions (Fu et al., 2007). During May, enhanced HCHO columns over the Gulf of Thailand may reflect outflow from fires occurring in Sumatra and from the Sibu area of eastern Borneo. However, dur-ing the OP3 campaigns, fire activity over Malaysian Borneo was minimal and the levels of HCHO and NO2 were gen-erally low, with their column amounts typically approach-ing their background values of ∼5×10¹⁵molecules cm−2 and ∼5×10¹⁴molecules cm−2, respectively. These low val-ues also suggest that during the OP3 measurement period the HCHO source from biogenic VOC oxidation was weak. We observe a slight HCHO enhancement during April over Danum Valley (Fig. 6a), but it is difficult to assign source attribution.
In Fig. 6c we show the monthly-mean 12-year time series of (continuous) HCHO and (non-continuous) NO2columns, retrieved from the GOME and SCIAMACHY instruments (De Smedt et al., 2008; Martin et al., 2002, 2003), to-gether with the total number of fire-counts detected by the
ATSR/AATSR instruments (Arino et al., 2001, 2005). High correlations between HCHO and NO2columns and the fire-count data suggest that biomass burning over Borneo drives observed variability of these trace gases. We find that anoma-lously high HCHO and NO2 columns were due to intense burning periods associated with strong El Nino conditions, indicated here by the Multivariate El Nino Southern Oscilla-tion (ENSO) Index (Wolter and Timlin, 1998), as expected. For example, during 1997/98 an increased number of forest and peat fires during the warmer and drier El Nino condi-tions (Levine, 1999) led to extremely high trace gas column concentrations.
Our recent analysis shows that spatial correlations be-tween the 12-year HCHO and NO2data, and the associated assimilated meteorological data, vegetation activity and fire-counts were strongest in southernmost Borneo and not over the Bukit Atur (Danum Valley) region (Barkley et al., 2009). The low trace gas columns observed over this region during 2008 are consistent with our understanding of past variabil-ity.
C. N. Hewitt et al.: The OP3 project: introduction, rationale, location characteristics and tools 185
50
Figure 6(a). Monthly averaged SCIAMACHY HCHO columns on a 2.5° × 2.0°
(longitude × latitude) grid, with cloud coverage ≤ 40%. (b) Monthly averaged OMI
NO
2columns on a 1.0° × 1.0° grid, with cloud coverage ≤ 40%. (c) The
(deseasonalized and normalized) monthly-mean time series anomalies over Borneo of
HCHO (red) and NO
2(grey) columns retrieved by the GOME and SCIAMACHY
instruments (De Smedt et al., 2008; Martin et al. 2002). The total number of
firecounts detected by the ATSR/AATSR instruments (Arino et al., 2001, 2005)
(black) and the Multivariate El Nino Southern Oscillation Index (MEI) (Wolter and
Timlin, 1998) (blue) are also shown. The correlation of the MEI with the HCHO, NO
2and firecount timeseries is given in the plot-title; the correlation of the HCHO
timeseries with NO
2and firecounts are shown inset.
Fig. 6. (a). Monthly averaged SCIAMACHY HCHO columns on a 2.5◦×2.0◦(longitude × latitude) grid, with cloud coverage ≤40%. (b) Monthly averaged OMI NO2columns on a 1.0◦×1.0◦grid, with cloud coverage ≤40%. (c) The (deseasonalized and normalized)
monthly-mean time series anomalies over Borneo of HCHO (red) and NO2(grey) columns retrieved by the GOME and SCIAMACHY instruments (De
Smedt et al., 2008; Martin et al., 2002). The total number of firecounts detected by the ATSR/AATSR instruments (Arino et al., 2001, 2005) (black) and the Multivariate El Nino Southern Oscillation Index (MEI) (Wolter and Timlin, 1998) (blue) are also shown. The correlation of the MEI with the HCHO, NO2and firecount timeseries is given in the plot-title; the correlation of the HCHO timeseries with NO2and
firecounts are shown inset.
4.2 In-situ observations 4.2.1 Airborne measurements
The in-situ observations made during the OP3 project were centred on sites representative of natural rainforest and oil palm plantations (see above), with aircraft flights over each landscape and over the up- and down-wind oceans (see above). Figure 7 shows aircraft measurements of six species taken on flights near to the Bukit Atur GAW station and the adjacent oil palm plantations. Data are shown from flights (a) below 500 m above ground level, representative of the boundary layer and (b) above 2500 m, representative of the free troposphere. Also indicated on the plots is the approx-imate boundary between the natural rainforest and the palm oil plantations.
Within the boundary layer (Fig. 7a), the most striking concentration difference between the rainforest and plan-tation is for isoprene. Concentrations over the rainfor-est were typically 1000–3000 pptv, with concentrations over
the plantation significantly higher (2–5 times higher; 5000– 10 000 pptv). This is consistent with the higher emission rate of isoprene from oil palm trees (Elaeis guineensis) compared to most rainforest tree species (Wilkinson et al., 2006). The plantation landscape also contains associated agro-industrial activities (e.g. road traffic, oil palm processing plants and ni-trogenous fertiliser application) and as a result, NOx concen-trations were also higher compared to the rainforest. How-ever, whereas the higher isoprene concentrations observed tended to be in the west of the oil palm plantation area, higher NOx levels were concentrated in the north and east of the plantation area, where the majority of plantation pro-cessing plants were observed to be situated. In this area, typ-ical NOxlevels were 1000–1500 pptv, with up to >2000 pptv observed when flying through or close to the plume of a pro-cessing plant. Further south in the plantation area, closer to the boundary with the rainforest, NOxwas much lower, with levels typically <300 pptv, which is similar to levels that are observed over the rainforest.
186 C. N. Hewitt et al.: The OP3 project: introduction, rationale, location characteristics and tools
51 (above ground level), coloured by NOx, isoprene, ozone and organic/sulphate
aerosol concentrations.
Fig. 7a. Flight track of all data collected from the aircraft below
500 m (above ground level), coloured by NOx, isoprene, ozone and
organic/sulphate aerosol concentrations.
CO shows a similar behaviour to NOx, with higher levels (100–110 ppbv) observed over the northern and eastern plan-tation area compared to further south and over the rainforest (70–90 ppbv). Levels of sulphate aerosol show little differ-ence between the two land use areas, with both exhibiting aerosol loading of 0.25–1 µg m−3.
The result of the increased levels of primary pollutants over the oil palm plantation compared to the rainforest can be seen in the observed ozone, a species that is not directly emitted into the atmosphere but produced photochemically. Ozone was significantly higher (20–25 ppbv) over the eastern area of oil palm plantation, corresponding to the area where NOxwas generally higher. Over the western area of oil palm plantation, where NOxlevels are lower but isoprene levels are still high, and over the natural rainforest, where both NOx and isoprene are lower, ozone is observed to be 8–15 ppbv. This demonstrates the need for increased NOxemissions, as well as isoprene, in order for significant extra ozone produc-tion to occur (Hewitt et al., 2009). More organic particulate was observed over the oil palm plantation than the rainfor-est, with average loadings of 0.67 µg m−3 and 0.48 µg m−3 respectively, which is consistent with our ground based mea-surements (see below) and could be due to enhanced produc-tion of secondary organic material, although primary emis-sions from the processing plants and human settlements may also be contributing.
52 organic/sulphate aerosol content.
Fig. 7b. Flight track of all data collected from the aircraft above
2500 m (in the free troposphere), coloured by NOx, isoprene, ozone
and organic/sulphate aerosol content.
In the free troposphere (Fig. 7b), very little isoprene or sul-phate aerosol was observed over either the rainforest or plan-tation and levels of CO were similar over both areas (∼50– 60 ppbv). NOxlevels were higher in the eastern plantation re-gion (200–300 pptv) compared to the rainforest (<50 pptv); however this did not lead to increased ozone in the free tro-posphere over the plantation. This is likely to be due to the very low levels of isoprene and other biogenic VOCs, which do not have a long enough lifetime to escape the boundary layer. Organic aerosol was also very low over both planta-tion and rainforest in the free troposphere, with an average organic loading of 0.03 µg m−3.
As described above, some flights were also undertaken over the ocean, both upwind and downwind of Sabah. Levels of isoprene and NOxwere very low in both cases and there was no obvious enhancement in ozone in the upwind flights. These data were collected on only two days; however our ini-tial interpretation of this is that Sabah is not a large exporter of primary or processed pollutants to the wider region. 4.2.2 Bukit Atur measurements
Data were taken within the rainforest at the Bukit Atur GAW station during two four-week intensive measurement periods (OP3-I and OP3-III). The GAW station has made ozone mea-surements since January 2007 and these data are shown in
C. N. Hewitt et al.: The OP3 project: introduction, rationale, location characteristics and tools 187
53 Figure 8. Ground level ozone concentrations measured at the Bukit Atur GAW site 2007 - 2008. Data are shown as hourly points with a 24 hour running average.
Fig. 8. Ground level ozone concentrations measured at the Bukit
Atur GAW site 2007–2008. Data are shown as hourly points with a 24 h running average.
Fig. 8. Gaps in the data are due to lightning strikes rendering the instrument inoperable. However the plot shows that the levels of ozone observed during the OP3 intensive periods in 2008 are typical for the site.
Campaign daytime (10:00–14:00) average isoprene and total monoterpene fluxes measured at 75 m on the GAW tower were 1.2 and 0.3 mg m−2h−1respectively during OP3-I and 2.1 and 0.49 mg m−2h−1during OP3-III (Langford et al., 2010). These values were comparable to measurements made above regions of the Congo during the EXPRESSO field campaigns (Greenberg et al., 1999; Klinger et al., 1998; Serca et al., 2001) and are somewhat smaller than values re-ported above regions of the Amazon (Karl et al., 2007; Kuhn et al., 2007). The typical monoterpene to isoprene ratio was between 0.2–0.25, which is within the upper range of ratios reported in other tropical regions (Guenther et al., 2008). The fluxes of other biogenic VOCs, including methanol, acetone and acetaldehyde, were very much smaller, accounting for just 2% of the total measured VOC emissions.
Figure 9a shows hourly averaged median diurnal cycles for NO, NO2, O3, isoprene and sulphate and organic aerosol mass concentration, taken at Bukit Atur during June and July 2008. Only data from the six days when flights took place over the station were used in the averaging for a direct com-parison between the ground-based and aircraft data in the boundary layer and free troposphere over the rainforest. Note that since Bukit Atur is on a ridge, some of the boundary layer data collected by the aircraft over the surrounding for-est were at the same or lower altitude (above sea level) as the GAW tower.
For NO, a peak of ∼100 pptv was observed between 07:00 and 08:00 local time, which corresponds to the onset of NO2 photolysis. This was followed by a drop to ∼40 pptv by 11:00, with NO then remaining fairly constant through-out the day, until a further drop to ∼20 pptv occurred at around 17:00. NO then remained constant throughout the
54 Figure 9a. Average diurnal concentration profiles for NOx, isoprene, ozone and
organic/sulphate aerosol content for the Bukit Atur ground site and aircraft data taken over surrounding rainforest below 500 metres above ground level (BL) and in the free troposphere above 2500 metres (FT). The error bars on the aircraft data indicate 1σ standard deviations for data taken on the four flights.
Fig. 9a. Average diurnal concentration profiles for NOx,
iso-prene, ozone and organic/sulphate aerosol content for the Bukit Atur ground site and aircraft data taken over surrounding rainforest below 500 ms above ground level (BL) and in the free troposphere above 2500 m (FT). The error bars on the aircraft data indicate 1σ standard deviations for data taken on the four flights.
night. NO2exhibits a clear diurnal cycle peaking at around midnight at 300 pptv, with a minimum of ∼150 pptv in mid-afternoon. These values are comparable to NOx mea-surements made in Amazonia (e.g. Ganzeveld et al., 2008) and over West Africa during the AMMA experiments (e.g. Saunois et al., 2009).
Boundary layer aircraft measurements of NO and NO2 were in reasonable agreement with the ground based mea-surements, although airborne NO levels were consistently lower. This, along with the non-zero night-time levels, sug-gests a local NO source that was diluted throughout the boundary layer. NO and NO2levels in the free troposphere were much lower, being <10 pptv and ∼20 pptv, respec-tively. A full description of ground level NOxdata and dis-cussion of the chemistry is given by Pike et al. (2009) and Pugh et al. (2010b).
Isoprene was the most abundant terpenoid compound ob-served and showed a clear diurnal cycle with very low (<40 pptv) levels at night and a peak of ∼2000 pptv in mid afternoon. This was caused by the dependence of isoprene emission from trees on temperature and light (Guenther et al., 1993). Boundary layer isoprene measurements from the aircraft were in good agreement with the ground-based Bukit Atur measurements, and free tropospheric isoprene levels were, as expected, very low. Limonene, alpha-pinene and beta-pinene were the most abundant monoterpene com-pounds observed. Relatively high concentrations of 2-ethyl hexanol and some aldehydes were also seen in samples taken from within the forest canopy in the vicinity of Bukit Atur.
The concentrations of NO2, peroxy nitrate (RO2NO2)and alkyl nitrate (RONO2)were measured at Bukit Atur with a laser induced fluorescence system (Aruffo et al., 2009). The diurnal cycle of RO2NO2 followed the isoprene diurnal cy-cle, with maximum concentrations in the afternoon. Since
RO2NO2 compounds are produced in the oxidation of iso-prene and other terpenoids, this result provides evidence for the oxidation of BVOC in the vicinity of the forest canopy. Additional evidence for the active photochemical processing of isoprene is provided by the increase in concentrations of its oxidation products, methyl vinyl ketone and methacrolein, observed in the afternoons.
The concentrations of HO2+RO2 were measured at Bukit Atur using PEroxy Radical Chemical Amplification (PERCA) technology (Karunaharan et al., 2009) over 20 days in OP3-I and 29 days in OP3-III. Mean midday mixing ratio of 33.5±3.3 and 35.5±3.5 parts per trillion (pptv) were calculated from the continuous measurements of the sum of the inorganic and organic peroxy radicals from OP3-I and OP3-III respectively. The mean net ozone production rate may then be calculated using:
N (O3) = kp[NO][HO2+RO2]
−{f · j (O1D) + k1[OH] + k2[HO2]}[O3]
where kpis a combined rate coefficient for the oxidation of
NO to NO2by all peroxy radicals and f · j (O1D)[O3] repre-sents the fraction of ozone photolysed to yield O(1D) atoms and then OH (with f being the proportion of O(1D) atoms which react with H2O to give OH rather than being colli-sionally deactivated). The rate constants k1and k2are from the ozone loss reactions:
OH + O3=HO2+O2 (R1)
HO2+O3=OH + 2O2 (R2)
The net formation of ozone was found to be strongly depen-dent on the concentration of isoprene, having a linear sensi-tivity (e.g. dln(P (O3))/dln(isoprene)=1)). Since HO2+RO2 are produced during the oxidation of isoprene and other ter-penoids, taken together with the observations of MVK and methacrolein formation, this result provides evidence for the oxidation of BVOC in the vicinity of the forest canopy and of the role of isoprene in the formation of ozone in the near-canopy environment during the daytime.
Evidence of BVOC reactivity also comes from differen-tial optical absorption spectroscopy (DOAS) measurements. DOAS was used at Bukit Atur to make the first measure-ments in a tropical rainforest of glyoxal (CHOCHO), one of the major products of isoprene oxidation by OH. Mixing ra-tios much higher than in other rural locations were observed, with a maximum of 1.6 ppbv and average around 600 pptv. HCHO was also measured, peaking at 4.5 ppbv and with an average around 3 ppbv. Both species were closely correlated to isoprene (which should be their major source in this envi-ronment), and peaked in the early afternoon. A box model indicates that the production efficiency of glyoxal from iso-prene is ∼10%. Although glyoxal was significantly scav-enged during rain showers, it is mostly removed by reaction with OH and photolysis (lifetime at midday ∼2.3 h) rather
than uptake on background aerosol in this environment, be-cause, as discussed earlier, aerosol mass loadings were low.
There was a slight diurnal trend in ground-based O3 mea-surements, with levels of ∼5 ppbv at 06:00, rising to ∼8 ppbv in mid afternoon. Note that the very small amplitude in the diurnal pattern is typical of a hill-top site (Fowler et al., 2008) and contrasts with that observed at the in-canopy site and over the low-lying palm plantations (see below). These values are comparable to above canopy measurements made above regions of Amazonia (Karl et al., 2007). Boundary layer O3levels also show an increase throughout the day, but at higher levels (10–13 ppbv), probably because the bound-ary layer O3 is less depleted by deposition to the canopy (Matsuda et al., 2006; Cros et al., 2000). These boundary layer values are slightly less than those measured over Ama-zonia and West Africa during the GABRIEL and AMMA campaigns (Ganzveld et al., 2008; Saunois et al., 2009). There is little vertical structure in the O3 mixing ratio at higher heights above the rainforest, with levels in the free tro-posphere being very similar to those in the boundary layer. Ozone vertical profiles were therefore more like those ob-served during the monsoon over northern Australia, than those observed during monsoon break periods (Heyes et al., 2009).
Concentrations of OH display a clear diurnal cycle, peaking at solar noon, with significant concentrations ob-served: up to 8.7×10⁶molecules cm−3(60 min average) was recorded on one day. During the GABRIEL campaign above Amazonia, average midday boundary layer OH concentra-tions were 5.75×10⁶molecules cm−3(Martinez et al., 2008). Although j (O1D) levels and humidity were high, the rela-tively low O3 concentrations limit primary OH production. The measured OH reactivity was very high, up to 87 s−1 (cor-responding to a lifetime for OH approaching 10 ms). Accord-ing to the measurements of reactive hydrocarbons (above), this reactivity is dominated by reaction with isoprene, indi-cating that significant OH sources must be present – in ad-dition to primary production following ozone photolysis – in order to maintain the elevated levels of OH levels recorded (Whalley et al., 2010b). The OH diurnal profile was asym-metric (i.e., lower post-noon than the equivalent time pre-noon). This may be due to its main measured sink, iso-prene, being present at higher concentrations in the after-noon, but the asymmetric profile could also result from other factors that have yet to be identified. OH concentrations up to 6×10⁵molecule cm−3 (60 min average) were also recorded on several nights, consistent with measurements by other groups in forested environments (Tan et al., 2001), with some residual OH observed after j (O1D) had dropped to zero. Measured concentrations of HO2and the sum of HO2+RO2 displayed similar profiles.
Boundary layer OH concentrations recorded on the aircraft over Bukit Atur were similar to those measured at ground level, whereas aircraft HO2concentrations were higher than measured at the ground, a reflection of the elevated NO levels