Damage identification and seismic vulnerability assessment
of a historic masonry chimney
Maria-Giovanna Masciotta
1,*, Luís F. Ramos
1, Paulo B. Lourenço
1, Marcello Vasta
2 1 ISISE, University of Minho, Department of Civil Engineering, Campus de Azurém, Guimarães, Portugal 2 University “G. d’Annunzio”, Department of Engineering and Geology, Pescara, ItalyArticle history
Received August, 1 2016; accepted April 7, 2017.
Subject classification:
Operational modal analysis, Damage identification, Power spectral densities, Seismic vulnerability assessment, Historic masonry chimney.
ABSTRACT
The present paper deals with the dynamic characterisation of a his-torical masonry chimney aimed at identifying the structural damage and assessing its seismic performance. The structure was severely damaged by a lightning accident and in-depth repair works were ex-ecuted to re-instate its sound configuration. The case study is fully detailed, including the aspects of survey, inspection, diagnosis, and evolution of the dynamic properties of the system throughout the structural intervention. Considering the explicit dependence of the power spectral densities of measured nodal processes on their fre-quency content, a spectrum-driven algorithm is used to detect and locate the damage. The paper shows that the eigenparameters ob-tained from the decomposition of the response power spectrum ma-trix are sensitive to system’s changes caused by evolutionary damage scenarios, thereby resulting excellent indicators for assessing both the presence and position of structural vulnerabilities. The results are compared with the ones from other modal-based damage identifi-cation methods and the strengths/limitations of the tools currently available in literature are extensively discussed. Finally, based on the crack pattern surveyed before the repair works, the weakest links of the chimney are identified and the most meaningful collapse mech-anisms are analysed to verify the seismic capacity of the structure. According to the results of the kinematic analysis, the chimney does withstand the maximum site peak ground acceleration.
1. Introduction
During their life span, structures are susceptible to damage whether due to exogenous causes, i.e. ser-vice loads, environmental and accidental actions, or to endogenous causes, such as geometrical defects, material degradation, loss of load-bearing capacity of structural members, excessive deformations and fa-tigue. The recurrence of such events may adversely af-fect the structural integrity and compromise the
long-term performance of the system. Real-time analyses and condition-based structural assessments are then necessary to prevent unexpected failures, to under-take appropriate corrective actions in due time and to mitigate the risk of damage from earthquakes in areas characterized by high seismic hazard.
The use of structural health monitoring (SHM), in-cluding vibration-based damage identification methods (VBDIMs), plays a primary role within this context as these tools allow to track and keep under control the system’s health over time and to detect any possible change due to onset of damage. Among all VBDIMs, the ones combining frequencies, mode shapes and/or modal curvatures are often used for both detecting and locating damage. These methods stem from the consid-eration that modal parameters are inherent properties of the structure, viz. a sort of ‘fingerprints’. Thus, any alteration in the global dynamic behaviour of the sys-tem does not depend on external forces and loads, but it is only related to changes in the physical properties and/or boundary conditions of the system itself. This provides a warning in the presence of damage. Hence the necessity to integrate SHM techniques with reliable dynamic-based damage identification methods able to spot the most vulnerable areas and address the appli-cation of localized experimental tests. Having a rapid condition screening of the structural health and identi-fying the damage at the earliest possible stage are issues of great importance in all engineering fields, but they become particularly crucial when dealing with the vul-nerability assessment of heritage and strategic civil structures. All this explains the unceasing interest of the scientific community in the field of damage iden-tification. In this regard, several techniques have been
proposed over time: from traditional modal-based methods [Pandey et al. 1991, Dong et al. 1994, Brinck-er et al. 1995, Abdel Wahab and De Roeck 1999, Kim and Stubbs 2013] to model-based techniques like the FE Model Updating [Reynders et al. 2010, Gentile and Saisi 2007], from stochastic methods based on statistical properties of random signals [Liberatore and Carman 2004, Fang and Perera 2009] to more modern approaches, such as wavelet analysis transform [Gentile and Messina 2003], neural network and genetic algorithm [Vakil et al. 2008]. A review of all techniques developed hitherto falls outside the scope of the present paper and the reader is referred to existing state-of-art papers (e.g. [Doebling et al. 1996, Doebling et al. 1998, Carden and Fanning 2004, Sohn et al. 2004, Yan et al. 2007, Fan and Qiao 2010]) for this purpose. However, it is worth noting that none of the methods currently available seems to be universally efficient and only a few references are dedicated to the damage identification of historic masonry constructions [Ramos 2007, Ramos et al. 2010, De Matteis et al. 2012, Masciotta 2015, Masciotta et al. 2017].
The first aim of the present paper is to present a damage identification method recently validated by the authors [Masciotta et al. 2017, Masciotta et al. 2016], and its application to a real historic structure. The proposed approach belongs to the category of
modal-based damage identification techniques and relies on spectral analysis methods, viz. methods that exploit the second order properties of the vibration characteristics of a structure to estimate its dynamic properties and identify the damage. The basic concept underlying this approach is that the eigenparameters extracted from the decomposition of the system’s out-put power spectrum matrix can allow to detect, locate and qualitatively assess the damage. The second aim of the paper is to provide a quantitative assessment of the seismic vulnerability of the structure under analy-sis by identifying the most likely collapse mechanisms. Object of study is a historic masonry chimney that was struck by lightning and needed urgent remedial meas-ures. After a brief description of the case study (Sec-tion 2), the dynamics of the system is investigated both before and after the occurrence of damage and the evolution of the modal features throughout the reha-bilitation works is presented (Section 3). Next, the the-oretical framework of the spectrum-driven approach is outlined along with the derivation of the spectral dam-age index (Section 4). The method is applied to identify the structural damage of the chimney according to an inverse formulation and the results are compared with the ones obtained from other modal-based damage identification methods (Section 5). Finally, a limit
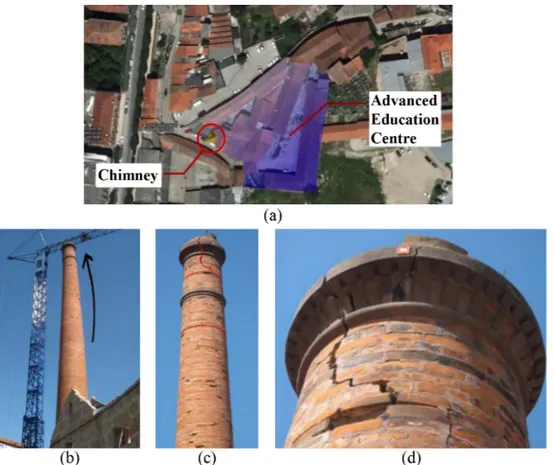
equi-Figure 1. Location of the chimney (a) and view of the structure before the accident: (b) permanent deformation; (c-d) cracks triggering the disconnection of the top part.
librium analysis is carried out to evaluate the seismic capacity of the structure and assess its vulnerability level against horizontal actions (Section 6).
It is concluded that the dynamic properties of a structure are directly related to its seismic perfor-mance, therefore supervised SHM techniques are strongly encouraged in order to mitigate the risk of damage from earthquakes. In this regard, the spec-tral-based damage identification method shows to be a valuable non-destructive tool that can be successfully implemented in the engineering practice and integrat-ed within a strategy for the structural assessment and preservation of built cultural heritage.
2. Description of the Case-Study Structure
The case-study structure is a masonry chimney belonging to a former industrial complex located in the
city centre of Guimarães, historical town in the North of Portugal (Figure 1a). The structure was already ob-ject of monitoring between November 2010 and June 2011 when the University of Minho was in charge of assessing the structural condition during the building works of the neighbouring Advanced Education Cen-tre. On that occasion, a campaign of topographical measurements and visual inspections detected a slight rigid rotation of the upper part of the chimney and several structural cracks. In addition, the survey point-ed out a permanent plastic deformation affecting the upper two thirds of the flue and a disconnection of the top part from the rest of the body, owing to the presence of serious cracks at that level (Figure 1b-d). In July 2012 a lightning accident worsened the structur-al condition of the chimney. First, temporary remedistructur-al actions were undertaken with urgency to ensure the
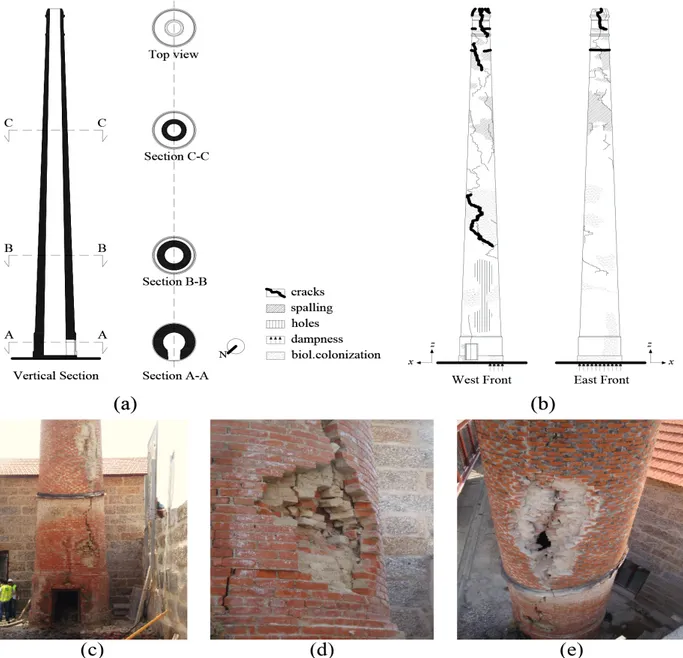
Figure 2. Masonry chimney: (a) geometrical features; (b) damage survey; (c), (d) and (e) photographic survey of the openings caused by the lightning.
structural stability. Afterwards, an in-depth intervention was executed to reinstate the sound condition. During this lapse of time, the dynamic response of the structure was continuously monitored to follow the temporal evolution of the modal parameters and to control the effectiveness of the repair works [Ramos et al. 2013, Masciotta et al. 2014]. Dealing with two structural conditions, namely damaged state (before the intervention) and undamaged state (after the intervention), the acquired data were used as a benchmark for the supervised damage identification that will be described in the next sections.
2.1 Geometrical Survey
The chimney is built of brick masonry units with mortar joints arranged along regular horizontal cours-es and is characterized by a cone frustum shape with a pipe cross-section that tapers upwards, decreasing both in diameter (from 2.93 m to 0.94 m) and thick-ness (from 0.70 m to 0.20 m), see Figure 2a. Circa 27 m high, the chimney features an average height-diameter aspect ratio of about 14:1, being therefore defined as a slender structure. The chimney rests on a quadrangu-lar foundation block and presents a rectanguquadrangu-lar open-ing (“door”) of about 0.90 m × 1.20 m, used to trigger the ‘chimney effect’ for the dispersion of the smokes produced by the former industrial complex.
2.2 Damage Survey and Structural Intervention
The electrical discharge that struck the chimney, owing to the poor condition of the lightning rod located in the South-East side of the structure, blew up part of the wall opposite the rod, causing two significant new openings: one at 3 m height from the ground level (close to the chimney door) and another at 6 m height (Fig-ure 2b-e). The masonry bricks were completely hurled and fell on surrounding roofs about 15 m far. In spite of that, the chimney underwent no considerable change in terms of structural mass: the mass percentage differ-ence between damaged and undamaged configurations resulted to be barely 4%. Figure 2b shows the damage survey after the lightning strike. The permanent defor-mation of the chimney did not vary with the accident but, besides the two openings, the width of the existing vertical cracks increased 3 mm (the initial crack width was 10 mm). Moreover, due to lack of maintenance, the damage survey of November 2012 reported spotted spalling, widespread biological colonization and moist areas in the bottom part of the structure.
With the purpose of restoring the healthy condition, in-depth repair works were carried out between Decem-ber 2012 and February 2013. The remedial measures
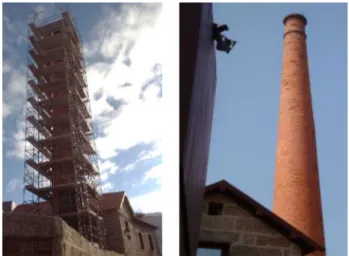
in-cluded: structural consolidation through reconstruction of the damaged parts, cracks closing, grout injections, cleaning and waterproof protection. A few snapshots of the chimney during and after the rehabilitation works are shown in Figure 3.
3. Dynamic Characterization of the System
The major aim of this section is to analyse the modal behaviour of the chimney before and after the structural intervention and to compare the response of both scenarios in order to locate the damage, to qualitatively assess its extent and to evaluate the
effi-ciency of the consolidation works.
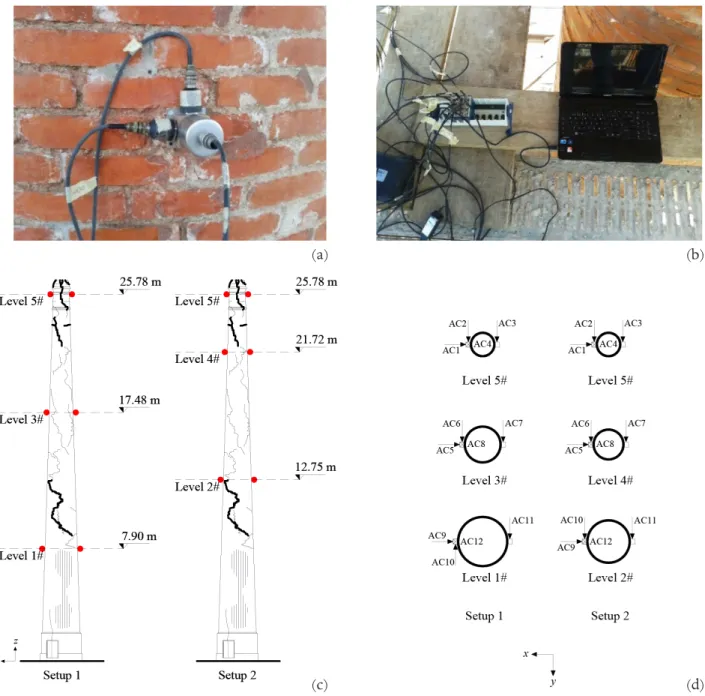
To characterize the dynamics of the system, an out-put-only modal analysis was carried out using environ-mental excitations from wind, traffic and human walking as operational conditions. A numerical modal analysis was performed beforehand to select and optimize sensors number and layout as well as to choose sampling frequen-cy and time window for the acquisition process. The first ambient vibration test was conducted in November 2012, while the second one in February 2013. Each campaign took one full day of measurements. The dynamic acquisi-tion system consisted of 12 uniaxial piezoelectric acceler-ometers (Figure 4a), with a bandwidth range from 0.15 to 1000 Hz, a dynamic range of ±0.5 g, a sensitivity of 10 V/g, 8 μg of resolution and 210 g of weight, con-nected by coaxial cables to a front-end data acquisi-tion unit with a 24 bit ADC provided with anti-aliasing filters. The system was connected to the laptop by an Ethernet cable (Figure 4b).
In order to study the modal response of the chim-ney in both horizontal and vertical directions, twenty DOFs deployed at ten different locations were measured and the scaffolding for the rehabilitation works was used
Figure 3. Structural intervention in the chimney: (a) view with the scaffolding for the works execution; (b) final configuration.
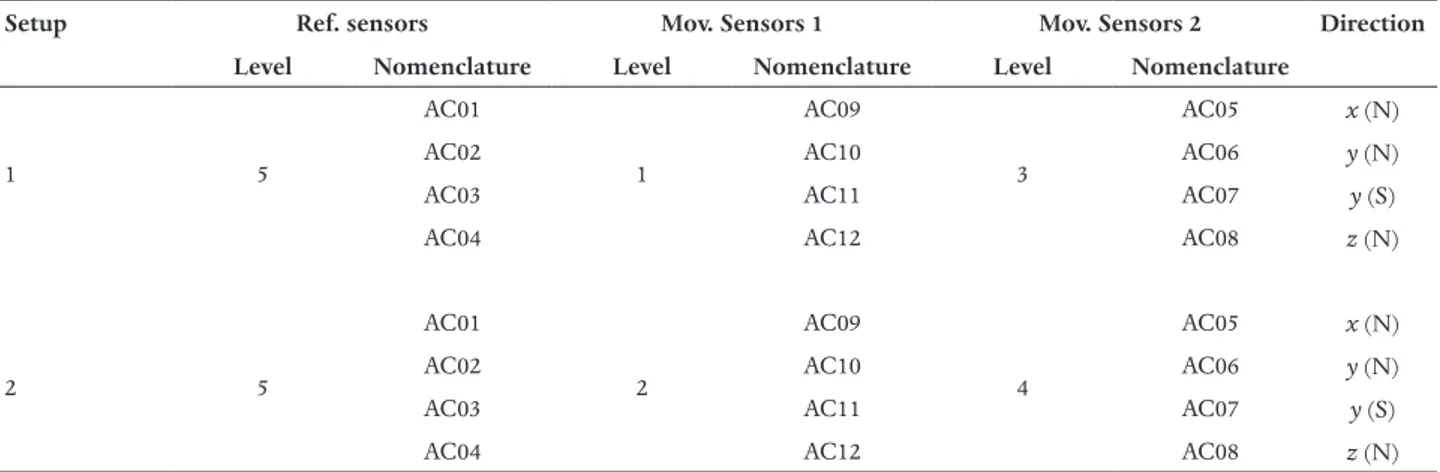
to access them. Not to interfere with the vibration tests, the scaffolding was appropriately detached from the structure. The response was acquired through two setups. Each setup consisted of three horizontal lev-els and each level consisted of four accelerometers: three of them were set on the northern wall along the orthogonal directions x, y and z, and the fourth one was placed on the southern wall along the y direction to catch possible torsional components in the modal response. The measuring points are indicated in Fig-ure 4c-d. The four transducers located at the top of the structure were kept as reference sensors. Table 1 summarizes the test setups along with the relevant ref-erence and moving sensors. According to the results of the preliminary numerical modal analysis, a
sam-pling frequency of 200 Hz and a time window of 10 minutes were finally adopted for the recording. The general rule for ambient vibration tests recommends a measurement length of at least 1000 times greater than the fundamental period of the structure [Cantieni 2005], however, for the present case, 10 minutes result-ed sufficient enough to catch all meaningful vibration characteristics of the system.
3.1 Modal Features Estimation Before and After the Structural Intervention
The dynamic features of the chimney before and after the rehabilitation works were estimated by two modal identification techniques: the Enhanced Frequency Domain Decomposition (EFFD) method
Figure 4. Operational modal analysis: (a) deployment of piezoelectric accelerometers; (b) data acquisition system; (c) test setups - the measuring points are marked in red; and (d) monitored DOFs.
(a) (b)
[Brincker et al. 2001] and the Stochastic Subspace Iden-tification (SSI) method - Principal Component [Peeters et al. 1999], both implemented in ARTeMIS [SVS 2011]. The outcomes of the modal estimation are presented in Figure 5 and Table 2. It is noted that the reduction of damage-induced local effects after the works result-ed in the vanishing of several vibration modes, which
were most likely modes originated from the presence of damage. It is also stressed that the lower modes only suffer a slight frequency shift between damage and un-damaged scenarios, whereas the higher modes undergo significant changes. An average frequency increase of about 8% is registered, meaning that the structural inter-vention did yield stiffness improvements. On the other
Setup Ref. sensors Mov. Sensors 1 Mov. Sensors 2 Direction
Level Nomenclature Level Nomenclature Level Nomenclature
1 5 AC01 1 AC09 3 AC05 x (N)
AC02 AC10 AC06 y (N)
AC03 AC11 AC07 y (S)
AC04 AC12 AC08 z (N)
2 5 AC01 2 AC09 4 AC05 x (N)
AC02 AC10 AC06 y (N)
AC03 AC11 AC07 y (S)
AC04 AC12 AC08 z (N)
Table 1. Detailed list of reference and moving sensors used for the dynamic identification.
Mode Before After Before After
ω (Hz) CV(%) ω (Hz) CV(%) Δω (%) ζ (%) CV(%) ζ (%) CVζ(%) Δζ (%) 1st 1.02 0.26 1.02 0.18 +0.30 0.48 65.53 2.53 2.43 +429.6 2nd 1.15 0.08 1.10 0.05 -4.09 0.95 20.91 3.30 6.25 +248.3 3rd 3.20 0.75 3.39 0.26 +5.90 0.91 29.18 1.36 8.60 +49.43 4th 3.65 0.18 3.73 0.33 +2.11 0.90 15.07 1.96 6.58 +117.6 5th 6.39 0.50 - - - 0.75 45.42 - - -6th 7.32 0.24 7.79 0.21 +6.51 0.84 39.77 1.09 10.77 +30.26 7th 8.81 0.05 10.29 0.03 +16.85 0.58 9.79 0.91 24.17 +56.44 8th 11.40 0.07 12.51 0.32 +9.74 1.24 31.92 1.84 1.94 +47.91 9th 12.31 0.22 13.37 0.38 +8.61 1.46 16.22 1.58 24.21 +7.87 10th 13.93 0.19 13.53 0.28 -2.87 2.56 33.33 2.29 39.97 -10.62 Average - 0.40 - 0.23 +7.95* 1.21 27.31 1.87 13.88 +123.43*
*Average value calculated only with positive differences and for comparable modes.
Table 2. Comparison of estimated frequency values and damping coefficients before and after the rehabilitation works.
ζ 1st 2nd 3nd 4th 6th 7th 8th 9th 10th avg tot Bef or e avg 0.48 0.95 0.91 0.9 0.84 0.58 1.24 1.46 2.56 1.21 s 0.32 0.20 0.27 0.14 0.33 0.06 0.40 0.24 0.85 0.31 CV 0.66 0.21 0.29 0.15 0.40 0.10 0.32 0.16 0.33 0.27 After avg 2.53 3.3 1.36 1.96 1.09 0.91 1.84 1.58 2.29 1.87 s 0.06 0.21 0.12 0.13 0.12 0.22 0.04 0.38 0.92 0.24 CV 0.02 0.06 0.09 0.07 0.11 0.24 0.02 0.24 0.40 0.14
hand, an unexpected increase of damping ratio is found (on average 120%). As a rule, the vibration modes of a damaged structure feature higher damping values than their no-damaged counterparts. However, the accurate quantification of damping coefficients is not easy as this modal parameter is affected by strong uncertainties and presents much higher statistical variation from random error sources than modal frequencies. Indeed, looking in more detail at the statistics of damping values before and after strengthening (Table 3), it is observed that the dispersion of damping results is higher for the first dy-namic identification, where the average Coefficient of Variation (CV) and standard deviation s equal 27% and
0.31, respectively, against 14% and 0.24 of the second modal test. This is imputable to the lower signal-to-noise ratio recorded during the first dynamic test. Given the uncertainty in the estimation of damping coefficients, these parameters are not used as dam-age-sensitive features.
The mode shapes identified before and after the works are displayed in Figure 6 along with the corre-sponding MAC values. Despite a good fit in terms of configuration, the correlation between comparable modes of damage and undamaged states is rather mod-erate (low MAC values) save for the lower modes. The detailed inspection of the modal displacements enables to understand that this is due to the fact that the
structur-al response is marked by locstructur-al effects in the areas where the two openings and the most severe cracks are lo-cated, while a monolithic behaviour characterizes the system after the intervention.
The results discussed hitherto allow to infer that the presence of damage affected the dynamic behaviour of the chimney mostly with regard to the higher modes whose frequencies increased considerably after repair-ing the damaged areas. To further assess the effective-ness of the rehabilitation works and verify if cracks have stabilized, the results from the continuous dynamic monitoring are analysed and presented hereafter.
3.2 Short-term Structural Health Monitoring
To follow the evolution of its modal features dur-ing the works, the chimney was monitored usdur-ing the four reference accelerometers placed at the top (Level 5). The acquisition software was properly set to record circa 10 minutes of ambient vibrations every hour with a sampling frequency of 100 Hz. The monitoring task was carried out in three campaigns within the period
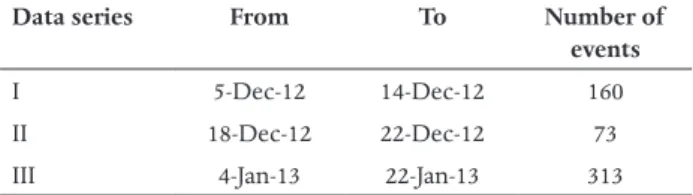
December 2012 - January 2013 and a total number of 546 events was collected. Particular attention was paid during the reconstruction of the masonry panels in the areas where the lightning caused the openings. Data series, duration of each campaign and number of events per campaign are detailed in Table 4.
Dealing with several events, the modal features ex-traction is performed through an automatic processing algorithm based on the Stochastic Subspace Identifica-tion (SSI) method [Peeters et al. 1999] and implemented as a subroutine in MATLAB [MATLAB 2010]. To avoid unrealistic results, a few events are manually analysed be-fore the automatic data processing so as to set thresh-old values for frequencies, damping ratios (usually between 1% and 5%) and MAC values (greater than 0.95). Then, the maximum model order is fixed. It is known that the selection of small model orders can make difficult the identification of weakly excited modes, but the choice of inapt large orders can result in the appearance of many spurious modes associated with the noise content of the measurements. In the present application, after testing different values of
Figure 5. Modal features estimation before and after works: En-hanced Frequency Domain Decomposition vs Stochastic Subspace
Identification. Data series From To Number of events
I 5-Dec-12 14-Dec-12 160
II 18-Dec-12 22-Dec-12 73
III 4-Jan-13 22-Jan-13 313
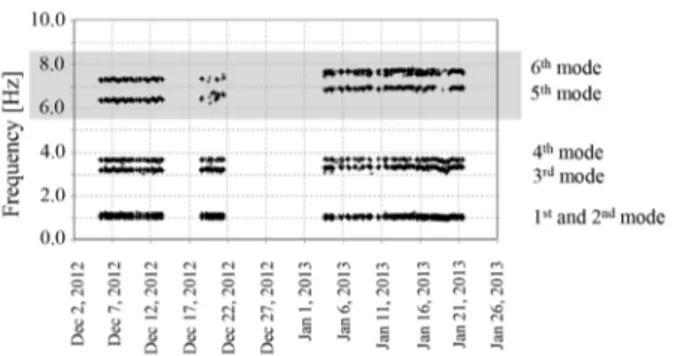
model order in the range 20–100 with increments of 10, a maximum model order of 30 is selected. Figure 7 presents the results of the automatic dynamic iden-tification for the first six vibration modes of the chim-ney. The plot confirms that the major changes be-tween damage and undamaged scenarios concerned the high-frequency modes, whereas the low-frequen-cy modes did not suffer considerable variations. This outcome was largely expected: unlike low-frequency
modes, which are associated with the global dynamic behaviour of the structure, high-frequency modes are local modes, thereby being more sensitive to changes in frequency as well as in mode shape configuration when local phenomena, such as structural damage, occur. In addition, higher modes have more inflexion points (nodal points), and the effects of cracks are
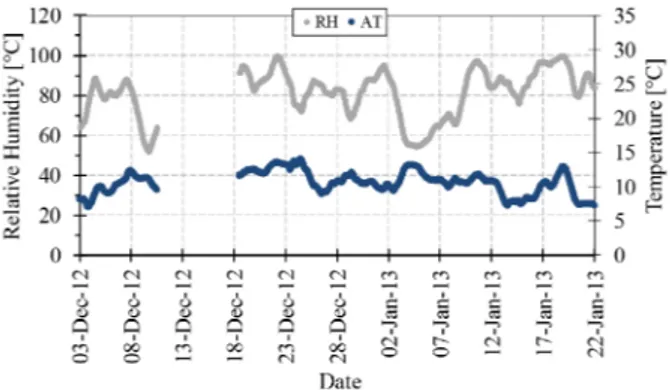
sig-nificant on the modal curvatures (or mode shapes). It is worth noting that frequency shifts in masonry structures may be associated with factors other than damage, e.g. temperature fluctuations. For the pres-ent case study, although ambipres-ent parameters were not directly measured, it was possible to assess trends of temperature and relative humidity from the data ac-quired through the static monitoring system installed in a church close by. A close-up of the variation of both aforementioned parameters over the investigated pe-riod is reported in Figure 8. As it can be observed, no significant fluctuation occur between December 2012 and January 2013 as the air temperature keeps around 11° C throughout the period, featuring very margin-al oscillations, and the relative humidity fluctuates around an average value of 82% with only two minor drops. It is also important to stress that temperature changes have uniform influence on eigenfrequencies and eigenmodes, whereas structural damage has a se-lective influence on the dynamic parameters [Peeters and De Roeck 2001, Reynders and De Roeck 2009]. For all these reasons, any possible correlation be-tween environmental factors and frequency changes in the chimney is excluded. As no further deviation in the frequency values is detected after the repair, it is concluded that cracks have stabilized and the struc-tural intervention has efficiently reinstated the sound state of the chimney.
Figure 6. Experimental mode shapes and MAC values before and after the intervention.
Figure 7. Evolution of the first six natural frequencies over the mo-nitoring period.
4. Spectral-based Damage Identification
4.1 Theoretical Framework
In stochastic environment, the dynamic charac-terization of structural systems can be performed by applying spectral analysis methods based on the use of frequency-varying spectral features called power spectral density functions. Once the nodal response processes Xi(t) (i = 1,.., m) of a given structural sys-tem are known, the relevant power spectral densities can be estimated through the Fourier Transforms of the corresponding time-domain correlation functions, and then collected into the Power Spectral Density (PSD) matrix as follows:
(1)
where diagonal and out-of-diagonal elements rep-resent the direct and cross power spectral densities of the measured nodal response processes Xi(ω, T),
respectively. Since direct spectral densities are real functions, while cross spectral densities are complex conjugate functions, it follows that the matrix defined in Equation (1) is a Hermitian matrix composed of a symmetric real part and an anti- symmetric imaginary part, thus admitting real positive-defined eigenvalues
λi (ω) and complex eigenvectors Ψi (ω). Hence, the
properties of the system’s PSD matrix SX can be ana-lysed through its eigenvalue decomposition:
(2)
SX
( )
ω = ΨX( )
ω ΛX( )
ω ΨXH( )
ωin which
(3)
and is the complex conjugate transpose of
ΨX(ω). The diagonalization of the eigenvalue matrix
ΛX(ω) yields the eigenfrequencies of the system as local
maxima, being each element λj(ω) of ΛX(ω) a
frequen-cy-dependent parameter proportional to the energy of a certain vibration mode. On the contrary, the eigenvec-tor matrix ΨX(ω) consists of mutually orthogonal
coor-dinate-dependent parameters ψj(ω), each providing the
estimate of a mode shape of the system. Fulcrum of the spectral approach is the accurate estimation of these eigenparameters which allow not only for the dynamic characterization of the structure under analysis, but also for the detection and localisation of possible faults and damage areas, as it will be proved in next section.
4.2 Derivation of the Spectral Formulation
A multivariate stochastic vector process X(t) with power spectrum matrix SX(ω) can be expressed as a
summation of m independent fully coherent stochastic processes [Di Paola 1998] that are proportional to the eigenvectors Ψk (ωj) and eigenvalues λk (ωj) estimated from the PSD matrix of the process itself:
(4) where Re[•] returns the real part of the complex value expression and Pj(k) is a random complex number
de-fined as follows:
(5)
R(k)j and I(k)j being zero-mean normal random
num-bers obeying the following orthogonality relation-ships:
(6) and δ being the Kronecker delta (δjk = 1 if j = k, δjk =
0 if j ≠ k).
It follows that the difference between two multi-variate stochastic vector processes, e.g. reference X(t) and damage Xd(t), can be expressed as shown below
[Masciotta et al. 2016]:
(7) (8) where:
(9) The complex function DΨk (ωj) acts as a natural damage indicator: if no damage occurs in the struc-ture, DΨk (ωj) will be equal to zero for any k and j and the expression DX(t) = Xd(t)-X(t) will result null;
whereas if damage occurs in the structure, the indi-cator DΨk (ωj) will be different than zero for a given k
SX
( )
ω,T = SX1X1(ω,T ) SX 1X2(ω,T ) ! SX1Xm(ω,T ) SX2X1(ω,T ) SX 2X2(ω,T ) ! SX2Xm(ω,T ) ! ! " ! SXmX1(ω,T ) ! ! SXmXm(ω,T ) ⎡ ⎣ ⎢ ⎢ ⎢ ⎢ ⎢ ⎢ ⎤ ⎦ ⎥ ⎥ ⎥ ⎥ ⎥ ⎥ ΛX(ω) = λ1(ω) 0 0 0 0 λ2(ω) 0 0 0 0 ! 0 0 0 0 λn(ω) ⎡ ⎣ ⎢ ⎢ ⎢ ⎢ ⎢ ⎤ ⎦ ⎥ ⎥ ⎥ ⎥ ⎥ = 1 ω12 0 0 0 0 1 ω22 0 0 0 0 ! 0 0 0 0 1 ωn2 ⎡ ⎣ ⎢ ⎢ ⎢ ⎢ ⎢ ⎢ ⎤ ⎦ ⎥ ⎥ ⎥ ⎥ ⎥ ⎥ X(t) = Yk(t) k=1 m∑
= 2 Δω Re Ψk(ωj) λk(ωj) ⋅ Pj(k ) j=1 n∑
eiωjt ⎛ ⎝ ⎜⎜ ⎞ ⎠ ⎟⎟ k=1 m∑
Pj(k )=R j (k )−iI j (k ) ΔX(t) = Xd(t) − X(t) = Y kd(t) − Yk(t)(
)
k=1 m∑
ΔX(t) = 2 Δω Re ΔΨk(ωj)⋅ Pj(k ) j=1 n∑
eiωjt k=1 m∑
⎛ ⎝ ⎜⎜ ⎞ ⎠ ⎟⎟ ΔΨk(ωj) = Ψkd(ωj) λkd(ωj) − Ψk(ωj) λk(ωj) ΨX(ω) = ψ11(ω) ψ12(ω) ! ψ1n(ω) ψ21(ω) ψ22(ω) ! ψ2n(ω) ! ! " ! ψn1(ω) ψ21(ω) ! ψnn(ω) ⎡ ⎣ ⎢ ⎢ ⎢ ⎢ ⎢ ⎤ ⎦ ⎥ ⎥ ⎥ ⎥ ⎥ E R(r)j R j (s) ⎡ ⎣ ⎤⎦ =12δjkδrs E I⎡⎣ (r)j I(s)j ⎤⎦ =21δjkδrsE R⎡⎣ j(r)I(s)j ⎤⎦ = 0 ΨXH(ω)and will result in a value related to the magnitude of damage.
As demonstrated above, system’s changes due to evolutionary damage scenarios lead to changes in the response PSD matrix and its eigenparameters. Thus, spectral eigenvalues and eigenvectors can be used as damage-sensitive features for supervised structural health monitoring. In particular, eigenvalues shifts be-tween different scenarios can allow to detect the pres-ence of damage in the structure, whereas changes in the eigenvectors can provide spatial information about the damage position [Masciotta 2015]. Taking this into account, the authors have defined and successfully validated [Masciotta et al. 2017, Masciotta et al. 2016], the following spectral damage localization index:
ΔΨ = ⎡⎣⎢Ψkd(ωj) λkd(ωj)⎤⎦⎥ j=1 n
∑
− ⎡⎣⎢Ψuk(ωj) λku(ωj)⎤⎦⎥ j=1 n∑
k=1 m∑
(10)where n specifies the frequency range, m indicates the eigenvector number and upper scripts d and u stand for damaged and undamaged conditions, respectively. The index ΔΨ in Equation (10) is given by the sum of the differences between the spectral modes of damaged and undamaged scenarios. Each spectral mode is ob-tained through the amplification of the eigenvectors extracted from the response PSD matrix by the square root of the corresponding eigenvalues. The number of spectral modes equals the number of non-zero eigen-values. The so-defined spectral index ΔΨ will ultimate-ly result in a vector of scalars, each one associated with the damage/non-damage of a certain DOF. A compre-hensive description of the spectrum-driven method can be found elsewhere [Masciotta et al. 2017, Masci-otta et al. 2016]. In what concern the present work, the main goal is to apply the spectral formulation to a full-scale structure in order to demonstrate the poten-tial of this tool for the structural assessment of built cultural heritage.
5. Application of the Spectral Method to the Case-Study
5.1 Damage detection via Eigenvalues Analysis
To comply with the spectral procedure, the out-put data collected via OMA are used to estimate direct and cross power spectral densities. In order to merge the data from different setups and build a unique power spectrum matrix, the acceleration time histories are first scaled with respect to the aver-age difference (RMS) of the time series of one fixed reference sensor. Then, the PSD estimates are
com-puted in MATLAB [MATLAB 2010] from the N-point DFTs of the relevant nodal response processes sam-pled at 200 Hz, where N is the next power of two greater than the length of the signal. Given the limit-ed number of data samples, a FFT length longer than the data length is used in the spectrum estimation so as to provide a higher resolution frequency of iso-lated spectral peaks above the noise floor. In detail, the power spectrum is split into 65536 bins which results in a frequency resolution (FR) of 0.003 Hz/ bin. The default Hamming window with 50% over-lap is applied to the datasets. A unique [15x15] PSD matrix is built by using the spectral output signals in x and z directions for the 5 measuring points on the northern side of the chimney and the spectral out-put signals in y direction for the 5 measuring points on the southern side. Therefore, all three orthogo-nal directions are involved in the diagoorthogo-nalization of the PSD matrix and the subsequent eigenfrequencies identification.
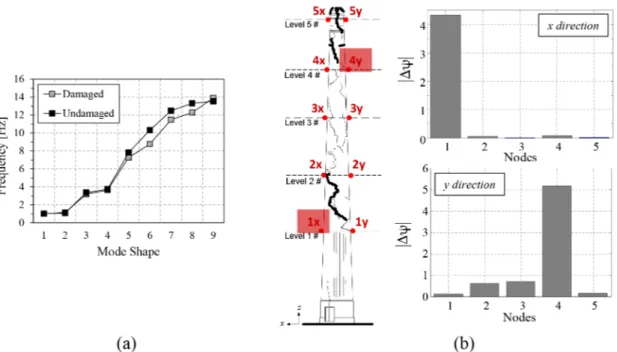
Figure 9a-b shows the eigenvalues plotting for both damage and undamaged scenarios, where the number of plotted eigenvalues equals the number of measured DOFs (5 per direction, 15 in total). The lo-cal maxima yielded by the eigenvalues coincide with the eigenfrequencies of the system. Ten and nine vi-bration modes are identified in the range 0-15 Hz for damaged and undamaged states, respectively. The relevant frequency values result to be consistent with the ones obtained from the more traditional SSI-PC method previously presented, reading the same per-centage increase of 8%, evidence of the stiffness im-provement gained with the consolidation works. Fig-ure 9c-d and Table 5 present the detailed comparison between the eigenfrequencies estimated through the two different techniques. The curves show a very good fitting, being the maximum percentage er-ror lower than 0.8% with the only exception of the second mode in the undamaged condition. The fre-quency shift concerning the higher modes is caught as well, and it proves to be a qualitative indicator of the presence of damage in the structure.
5.2 Damage Localization & Assessment
As damage is a local phenomenon, complex eigenvectors must be considered to attain a higher level of damage identification. Unlike eigenvalues, eigenvectors are much more sensitive to damage-in-duced local effects since they are functions of the system’s nodal coordinates. In virtue of that, the damage spectral analysis is performed by
investigat-ing x-z and y-z planes separately. The x-y plane has not been considered because of the low amplitude values of the acceleration responses in vertical direc-tion (z). The a priori knowledge of the damage posi-tion resulted from the in situ investigaposi-tions is exploit-ed as a reference parameter to weigh the reliability of the spectral-based damage identification.
In order to solve the eigenvalue problem described in Section 4, two different PSD matrices are built and
decomposed: a [5x5] square matrix with spectral out-put signals in x direction and a [5x5] square matrix with spectral output signals in y direction. Once all eigen-parameters are extracted from either matrix and for both structural conditions, the damage index in Equa-tion (10) is computed allowing to compare the spec-tral modes of damaged and undamaged states for each investigated direction. Note that in OMA, especially in case where damage has to be quantitatively identified,
it is mandatory to scale the experimental mode shapes with respect to the mass. Scaling factors do not affect the vibration mode, but only the corresponding am-plitude. In the present application, although dealing with output-only data, the eigenvectors have not been scaled since damage is localized and assessed from a qualitative point of view. The relationship between qualitative and quantitative damage measures has not been addressed yet. The results of the spectral damage
Mode Before After ωPSD [Hz] ωSSI [Hz] Dω [Hz] ωPSD [Hz] ωSSI [Hz] Dω [%] 1st 1.02 1.02 +0.29 1.02 1.02 +0.29 2nd 1.15 1.15 +0.17 1.08 1.10 -1.82 3rd 3.21 3.20 +0.31 3.37 3.39 -0.58 4th 3.65 3.65 +0.08 3.75 3.73 +0.54 5th 6.41 6.39 +0.31 - - -6th 7.29 7.32 -0.41 7.83 7.79 +0.51 7th 8.77 8.81 +0.45 10.32 10.29 +0.29 8th 11.49 11.40 +0.79 12.49 12.51 -0.16 9th 12.29 12.31 -0.16 13.32 13.37 -0.37 .1510th 13.92 13.93 -0.07 13.55 13.53 +0.15
Table 5. Spectral modes vs experimental modes: eigenfrequencies comparison.
Figure 9. Eigenvalues plotting for (a) damaged state (before wor-ks) and (b) undamaged state (after worwor-ks); and (c-d) eigenfrequen-cies comparison between PSD Method and SSI.
Figure 8. Temporal variation of air temperature and relative hu-midity over the monitoring period (data are measured through a combined temperature/humidity sensor installed in a nearby church).
analysis are displayed in Figure 10. The charts show clear-cut peaks at nodes 1 and 4 which are indeed the nodes closest to the parts of the chimney most affected by damage. Node 1 is located near the severe openings caused by the lightning and node 4 is situated where the disconnection of the upper part of the chimney originated. In terms of qualitative assessment, the size of the bars indicates that the damage in the upper part of the structure (position 4) is actually more severe than the damage registered at the bottom level (posi-tion 1). The reason leading to that is conceivably the slenderness of the chimney that, increasing upwards, makes the top part more vulnerable to damage than the bottom part.
5.3 Comparison with other Damage Identification Methods
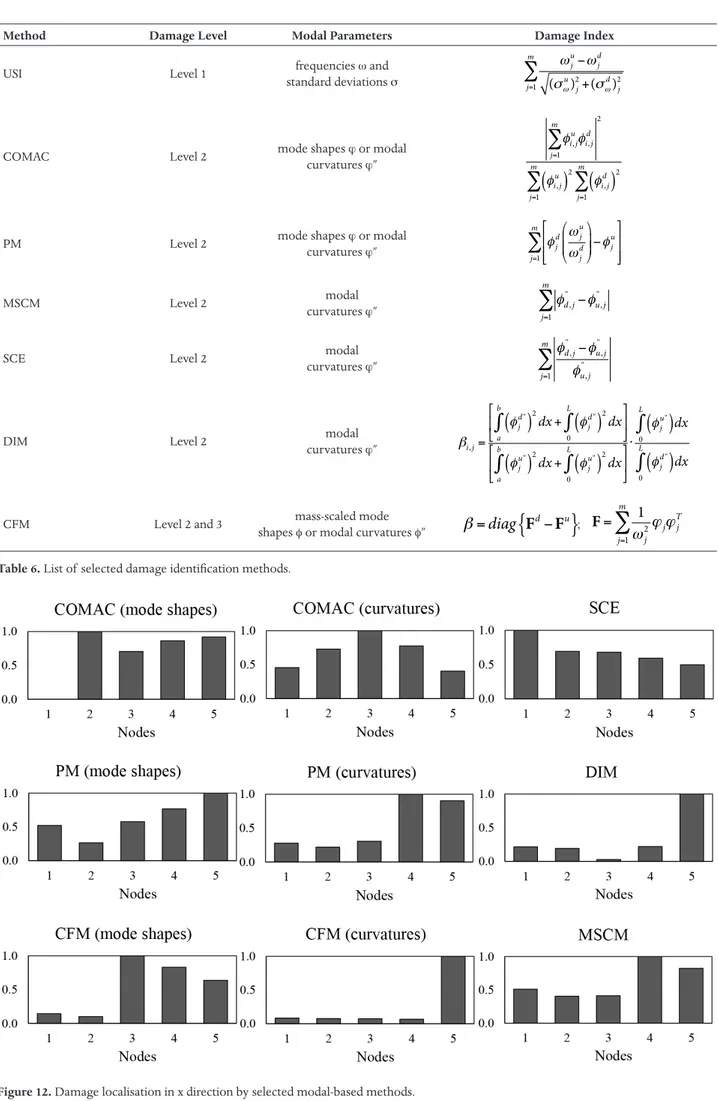
To evaluate the performance and reliability of the spectrum-driven method, the obtained results are com-pared with the ones from other vibration-based damage identification methods applied to the same datasets. The methods selected for the task are the following: Unified Significance Indicator (USI) [Brincker et al. 1995]; Co-or-dinate Modal Assurance Criterion (COMAC) [Ewins 2000]; Parameter Method (PM) [Dong et al. 1992]; Mode Shape Curvature Method (MSCM) [Kim et al. 2003]; Sum of all Curvature Errors method (SCE) [Kim et al. 2003]; Damage Index Method (DIM) [Stubbs et al. 1992]; Changes in Flexibility Matrix method (CFM) [Pandey and Biswas 1994]. The expressions used by each of this
non-model-based methods to identify the damage are briefly indicated in Table 6, specifying level of identifica-tion attempted and modal parameters required to com-pute the different indexes. The modal curvatures needed to compute some of the indexes are numerically derived from the mode shapes through the central difference theorem, whereas mass-scaled mode shapes are com-puted by applying a scaling factor to the known mode shapes [Aenlle et al. 2012], as follows:
(11) Note that the mass matrix M in Equation (11) is obtained based on the assumption of lumped masses in order to simplify and speed up the computation. The first method applied is the USI, estimated for both frequencies and damping values by considering their respective shifts and standard deviations. The presence of damage is clearly detected by the significance
indica-α= 1
ϕT⋅ Μ⋅ϕ
Figure 10. Results of the spectral damage analysis: (a) damage detection via the comparison of eigenvalues local maxima; (b) damage loca-lization via the spectral index (the Arabic numbers indicate the investigated DOFs and the red squares mark the damage areas pinpointed by the spectral index).
Method Damage Level Modal Parameters Damage Index
USI Level 1 standard deviations frequencies ω and
s
COMAC Level 2 mode shapes curvatures ϕ or modal
ϕ″
PM Level 2 mode shapes curvatures ϕ or modal
ϕ″
MSCM Level 2 curvatures modal
ϕ″
SCE Level 2 curvatures modal
ϕ″
DIM Level 2 curvatures modal
ϕ″
CFM Level 2 and 3 shapes mass-scaled mode
φ or modal curvatures φ″ ; ωju−ω j d (σω u) j 2+(σ ω d) j 2 j=1 m
∑
φi,juφ i,jd j=1 m∑
2 φi,ju( )
2( )
φi,jd 2 j=1 m∑
j=1 m∑
φjd ωuj ωdj ⎛ ⎝ ⎜⎜ ⎞ ⎠ ⎟⎟−φju ⎡ ⎣ ⎢ ⎢ ⎤ ⎦ ⎥ ⎥ j=1 m∑
φd,j'' −φ u,j'' j=1 m∑
φd,j'' −φ u,j'' φu,j'' j=1 m∑
βi,j= φjd''( )
2 dx a b∫
+( )
φjd'' 2 dx 0 L∫
⎡ ⎣ ⎢ ⎤ ⎦ ⎥ φu''j( )
2dx a b∫
+( )
φju'' 2 dx 0 L∫
⎡ ⎣ ⎢ ⎤ ⎦ ⎥ ⋅ φju''( )
dx 0 L∫
φjd''( )
dx 0 L∫
β=diag F{
d−Fu}
F = ω1 j 2ϕjϕTj j=1 m∑
Table 6. List of selected damage identification methods.
tors of frequency values, while the significance indica-tors of damping values do not give any warning (Figure 11). Being the USI a Level 1 method, no information about the possible damage location is provided. Concerning the modal-based methods of Level 2 and 3, all indexes are calculated taking into account the nodal response processes in x and y directions sepa-rately. Figure 12 shows the results obtained in x direc-tion. Analysing the bar charts, it is highlighted that:
• the COMAC values for modal displacements indicate the presence of damage at position 1, whereas the COMAC for modal curvatures at positions 1 and 5;
• the SCE pinpoints the first node as possible dam-age location;
• the DIM catches the presence of damage at po-sition 5;
• the PM for both modal displacements and cur-vatures identifies possible damage locations in the upper part of the chimney, namely at nodes 4 and 5, and so does the MSCM;
• the CFM for modal curvatures shows the dam-age at position 5, while the CFM for modal dis-placements at nodes 3, 4 and 5.
The results obtained in y direction are presented in Figure 13. In this case, the following remarks can be made:
• the CFM for modal displacements and the SCE show clear-cut peaks at position 4, while the CFM for modal curvatures pinpoints node 5 as possible damage location;
• the PM for modal curvatures and the MSCM val-ues locate damage in the upper part of the chim-ney at positions 4 and 5;
• the COMAC values for modal curvatures and the PM for modal displacements indicate the dam-age in three points, viz. 3, 4 and 5;
• the COMAC values for modal displacements identify the damage at position 3, followed by nodes 4 and 1;
• the results from DIM locate damage at position 3. To make the comparison easier, the results ob-tained from all selected methods are summarised in Figure 14 with the exception of USI and COMAC. It is observed that the bulk of the methods circum-scribe the damage to the upper part of chimney, whereas the spectral-based method and the SCE correctly identify the position of the most damaged areas.
Going into details, the COMAC provides quite good results (especially for the case of modal dis-placements) since it is based on the correlation be-tween the measured DOFs of the two structural conditions. The dependence on local/nodal system
coordinates is indeed of great help when seeking for local information as those related to the damage position. Regarding the PM, the failure in detecting the damage at position 1 is imputable to the small frequency shift between damaged and undamaged conditions for the lower modes, which are the ones dominating the dynamic response of the bottom part of the structure. Owing to that, the frequency ratio in the index formulation results almost neg-ligible for the lower modes and does not provide accurate information about the damage at the bot-tom level. In what concerns the CFM, this method is able to pinpoint the damage, but limited to the upper part of the chimney. This is due to the inverse proportion of the flexibility matrix to the square of the modal frequencies, with consequent higher sensitivity of the index to changes in the lower-fre-quency modes. But, as shown previously, for the present case-study the vibration modes undergoing most changes in terms of frequencies are the higher modes. It is also remarked that the structural mass only suffered a slight variation between damaged and undamaged states, thus the difference in the scaling factors adopted to estimate mass-normal-ized mode shapes for both scenarios is very small and prevents from getting better results. Similarly, the MSCM does locate damage at positions 4 and 5, but does not provide any information about the position of the two openings. This outcome plausi-bly depends on the formulation of the index itself as the MSCM is based on the difference between modal curvatures belonging to different damage scenarios. Since the curvature changes of the modes dominating the dynamic response of the lower part of the chimney are really minor, the MSCM is not able to locate the damage at the openings level (position 1). The failure of the DIM is likely due to the same reason.
The comparison with other damage indexes demonstrates the efficiency and accuracy of the
spec-tral formulation in locating the damage of the chim-ney and highlights the potentiality of the method as a non-destructive tool for the damage identification of heritage structures.
6. Seismic Vulnerability Assessment
6.1 Limit Equilibrium Analysis
The effects of earthquakes on built environment can be significant, therefore it is imperative to inves-tigate the vulnerability of structures under seismic loading. Generally speaking, structural vulnerability assessment entails the analysis of the seismic capaci-ty of a structure located in an earthquake-prone area in order to check its robustness to withstand a certain earthquake magnitude. As for historic masonry struc-tures, it is widely known that these systems are par-ticularly vulnerable to seismic actions and often expe-rience partial collapses due to the loss of equilibrium of portions of structure that are not able to resist to earthquake-induced loading and behave as rigid bod-ies [Giuffrè, A. Letture sulla meccanica delle murature storiche - Kappa, 1991, Lourenço et al. 2009, D’Ayala and Speranza 2003]. To mitigate the risk of damage of built cultural heritage, standards recommend to eval-uate their vulnerability level against seismic forces by analysing the most meaningful collapse mechanisms of the system. For the present case-study structure, this has been done through a limit equilibrium analysis in conformity with the kinematic approach provided by the Italian Technical Regulations for Construction [DM 14.01.2008]. The codified procedure relies on the assumption of a no-tension masonry material with infinite compressive strength and no sliding between units. The position of the disconnections between the rigid blocks composing the kinematic chain, viz. the position of the hinges about which the collapse mech-anism develops, has been fixed based on the crack pattern inspected in situ before the structural
tion. Figure 15 illustrates the three local mechanisms considered in the limit kinematic analysis, besides the global collapse mechanism. For each case, the hori-zontal loads multiplier α0 that activates the damage
mechanism is determined (Virtual Work Principle). Then, the maximum values of spectral acceleration
a*₀ corresponding to the collapse of each kinematic chain are computed along with the relevant spectral displacements d₀ , allowing to determine the capacity *
curve of the system case-by-case and to evaluate its ul-timate displacement capacity d *ᵤ. Table 7 presents the results obtained from the limit equilibrium analysis. The lowest seismic capacity is associated with both the global mechanism and the first identified local mech-anism, reading values of maximum spectral acceler-ation equal to 0.107g and 0.105g, respectively, while the equivalent spectral displacements correspond to 0.59m and 0.54m. The highest resistance is obtained for the third collapse mechanism, which features val-ues of a*₀ and d₀ * equal to 0.347g and 0.29m.
6.2 Assessment of Seismic Capacity versus Seismic Demand
In order to assess the seismic vulnerability of the chimney, the structural capacity is compared with the relevant seismic demand Δ. Since the system was al-ready damaged, this safety verification is carried out only with respect to the Ultimate Limit State (ULS). According to the Italian regulations [DM 14.01.2008], two criteria can be adopted to verify the fulfilment of the ULS for local collapse mechanisms. The first
crite-rion consists in the simplified verification with q factor (linear kinematic analysis) which is fulfilled if the spec-tral acceleration a*₀ responsible for the activation of the mechanism satisfies the following inequality:
(12) where ag is the peak ground acceleration, S stands for soil coefficient, and q represents the behaviour factor accounting for the energy dissipation capacity of the structure. Yet, if the mechanism involves a part of the structure located at a certain height from the ground level, one should also account for the amplification of acceleration at the level where the kinematic mecha-nism develops. Therefore, beyond Equation (12), the following verification must be carried out:
(13) in which: Se(T1) is the elastic response spectrum, T1 in-dicates the first vibration period of the structure in the considered direction, Ψ(Z) is the first vibration mode of the structure in the considered direction normalised with respect to the total height H of the system, Z in-dicates the height of the centroid of the seismic mass-es generating the kinematic mechanism, γ is the modal participation coefficient and q is defined as above.
The second criterion consists in the comparison between the ultimate displacement capacity d *ᵤ of the kinematic mechanism and the displacement demand of the earthquake Δd(Ts) (non-linear kinematic
analy-a0∗≥
ag⋅S q
a0∗≥ Se(T1)⋅Ψ(Z)⋅q γ
sis). The verification for this ULS implies the fulfilment of the following requirement:
(14) in which SDe is the elastic displacement response spec-trum and Ts stands for secant period. Again, when the mechanism involves a part of the structure situated at a certain distance from the ground level, the requirement in Equation (14) must be complemented with the veri-fication below: du∗≥SDE(T1)⋅Ψ(Z)⋅γ TS T1 ⎛ ⎝ ⎜ ⎞ ⎠ ⎟ 2 1− TS T1 ⎛ ⎝ ⎜ ⎞ ⎠ ⎟ 2 + 0.02TS T1 (15) where SDe, Ts, Ts, Ψ(Z) and γ are defined as above.
According to the Portuguese seismic zonation, Guimarães is located in a zone characterised by a site peak ground acceleration on rock ag = 0.036g for seismic action 1 (earthquakes with offshore epi-centres) and ag = 0.082g for seismic action 2 (earth-quakes with inland epicentres). Notwithstanding the low seismicity level, the vulnerability of the chimney is assessed for either seismic scenario, defining the two corresponding response spectra as specified by the Portuguese National Annexes of Eurocode 8 [EN 1998–1:2004 + AC:2009 Pt, Eurocode 8]. A soil strati-graphic profile of type A and a site coefficient S equal to 1 are assumed for the spectra estimation. The re-sults are summarised in Table 8 where the safety fac-tor SF (capacity over demand ratio) obtained for each
damage mechanism is also indicated. The seismic ca-pacity of the historic chimney is found to be much greater than the relevant seismic demand, being the lowest safety factor equal to 1.97.
7. Conclusions
The paper has presented the study of a historic masonry chimney located in Guimarães, a small town in the North of Portugal characterised by a low seis-micity level. The structure was struck by lightning with consequent aggravation of its poor conditions. Although the extension and severity of damage were remarkable, the changes in the modal properties of the system before and after the restoration works were little. This provided a significant challenge for the dam-age identification, but the proposed spectrum-driven approach proved to be successful in detecting, locating and qualitatively assessing the damage of the structure analysed. Despite the difficulties of the present case study and the limited modal data available, the results showed a good agreement with the experimental ev-idence, while most of the conventional modal-based methods applied to the same datasets resulted to be less accurate and reliable. Advantages and drawbacks of each technique have been extensively discussed in the paper. Lastly, once the most vulnerable parts of the chimney have been identified, a limit analysis was carried out in order to quantify the structural capacity over the seismic demand and to assess the seismic per-formance of the historic structure.
du∗≥SDE(TS) Scenario Mechanism a*0 (g) Da (g) SFa d*u(m) Dd (m) SFd Seismic Action 1 Global 0.107 0.018 6.03 0.23 0.027 8.82 1st Local 0.105 0.015 6.92 0.216 0.023 9.41 2nd Local 0.112 0.018 6.26 0.215 0.027 8.06 3rd Local 0.347 0.029 11.98 0.116 0.059 1.97 Seismic Action 2 Global 0.107 0.041 2.64 0.23 0.025 9.26 1st Local 0.105 0.015 7.27 0.216 0.022 9.88 2nd Local 0.112 0.017 6.58 0.215 0.025 8.47 3rd Local 0.347 0.028 12.58 0.116 0.056 2.07
Table 8. Comparison between seismic capacity and seismic demand.
(Δa is the acceleration seismic demand; Δd is the displacement seismic demand; and SF is the safety factor).
α0∗ d 0∗ du∗ a0∗ Collapse Mechanism M* (103kg) (g) (m) (m) Global 0.129 92.66 0.107 0.59 0.23 1st Local 0.126 71.59 0.105 0.54 0.22 2nd Local 0.134 51.67 0.112 0.54 0.21 3rd Local 0.416 3.35 0.347 0.29 0.12
Table 7. Parameters adopted in the limit equilibrium analysis.
( is the load multiplier; M* is the participating mass; is the spectral acceleration; is the spectral displacement; and is the ultimate displacement).α0
∗ a
The work has shown that a direct correlation ex-ists between dynamic characterization, damage iden-tification and seismic vulnerability assessment. These three aspects need to be addressed properly in order to mitigate the risk of damage of heritage structures located in areas with high seismic activity. Reliable damage identification methods that can be easily im-plemented in the engineering practice for supervised SHM are therefore fundamental.
References
Abdel Wahab, M. M. and G. De Roeck (1999). Damage detection in bridges using modal curvatures: appli-cation to a real damage scenario. Journal of Sound and Vibration, 226(2): 217–235.
Aenlle, M. L., R. Brincker, F. Pelayo and A. F. Canteli (2012). On exact and approximated formulations for scaling-mode shapes in operational modal anal-ysis by mass and stiffness change. Journal of Sound and Vibration, 331(3): 622–637.
Brincker, R., P. Andersen, P. H. Kirkegaard and J. P. Ulfkjær (1995). Damage detection in laboratory concrete beams. In Proceedings of the 13th Inter-national Modal Analysis Conference. Bethel, Con-necticut: Society for Experimental Mechanics, 1, 668–674.
Brincker, R., L. Zhang and P. Andersen (2001). Modal Identification of output-only systems using frequen-cy domain decomposition. Smart Materials and Structures, 10: 441–445.
Cantieni, R. (2005). Experimental methods used in sys-tem identification of civil engineering structures. In: Proceedings of the 1st International Operational Modal Analysis Conference, Copenhagen, 249–260. Carden, E. and P. Fanning (2004). Vibration based
con-dition monitoring: a review. Structural Health Moni-toring, 3(4): 355–377.
D’Ayala, D. and E. Speranza (2003). Definition of Col-lapse Mechanisms and Seismic Vulnerability of His-toric Masonry Buildings. Earthquake Spectra, 19(3): 479–509.
Di Paola, M. (1998). Digital simulation of wind field ve-locity. Journal of Wind Engineering and Industrial Aerodynamics, 74–76: 91–109.
Doebling, S., C. Farrar and M. Prime (1998). A summa-ry review of vibration-based damage identification methods. Shock and vibration digest, 30(2): 91–105. Doebling, S., C. Farrar, M. Prime and D. Shevitz (1996).
Damage identification and health monitoring of structural and mechanical systems from changes in their vibration characteristics: a literature review. Los
Alamos National Laboratory, NM, 132.
De Matteis, G., F. Campitiello, M.G. Masciotta and M. Vasta (2012). Damage identification of masonry structures under seismic excitation. In Computation-al Methods in Stochastic Dynamics, vol.2, Springer Netherlands, ISBN: 978-94-007-5133-0, 345–356. Dong, C., P. Q. Zhang, W. Q. Feng and T. C. Huang
(1994). The sensitivity study of the modal parame-ters of a cracked beam. In Proceedings of the 12th International Modal Analysis Conference. Honolulu, Hawaii, 98–104.
DM 14.01.2008, New technical regulations for construc-tion (NTC 2008) and related explanatory Circular no. 617 of 02.02.2009 (in Italian).
EN 1998–1:2004 + AC:2009 Pt, Eurocode 8: Design of structures for earthquake resistance, Part 1: General rules, seismic action and rules for building (in Portu-guese), Brussels, 2004.
Ewins, D. J. (2000). Modal testing: theory, practice and application. 2nd edition, Research Studies Press LDT. Fan W. and P. Qiao (2010). Vibration-based damage iden-tification methods: a review and comparative study. Structural Health Monitoring, 10(1): 83–111.
Fang, S.-E. and R. Perera (2009). Power mode shapes for early damage detection in linear structures. Journal of Sound and Vibration, 324(1–2): 40–56.
Gentile, A., and A. Messina (2003). On the continuous wavelet transforms applied to discrete vibrational data for detecting open cracks in damaged beams. International Journal of Solids and Structures, 40(2): 295–315.
Gentile, C., and A. Saisi (2007). Ambient vibration test-ing of historic masonry towers for structural identi-fication and damage assessment. Construction and Building Materials, 21(6): 1311–1321.
Giuffrè, A. Letture sulla meccanica delle murature storiche, Kappa, 1991.
Kim, J. T. and N. Stubbs (2003). Crack detection in beam-type structures using frequency data. Journal of Sound and Vibration, 259: 145–160.
Liberatore, S. and G. P. Carman (2004). Power spectral density analysis for damage identification and lo-cation. Journal of Sound and Vibration, 274(3–5): 761–776.
Lourenço, P.B., N. Mendes and R. Marques (2009). Earth-quake assessment of masonry structures: review and applications. In Trends in Civil and Structural Engi-neering Computing. Saxe-Coburg Publications, Stir-lingshire, Scotland, chapter 4, 77–101.
MATLAB (2010). MATLAB User’s Manual, Release 7.10.0. The Math Works, USA.
Masciotta MG (2015) Damage identification based on spectral output signals. PhD Thesis, University of Minho, Portugal – University “G. d’Annunzio”, Italy. Masciotta, M. G., L. F. Ramos, P. B. Lourenço and M.
Vasta (2017). Spectral algorithm for non-destructive damage localisation: Application to an ancient ma-sonry arch model. Mechanical Systems and Signal Processing, 84 (Part A): 286–307.
Masciotta, M. G., L. F. Ramos, P. B. Lourenço, M. Vasta and G. De Roeck (2016). A Spectrum-driven damage identification technique: application and validation through the numerical simulation of the Z24 Bridge. Mechanical Systems and Signal Processing, 70-71: 578–600.
Masciotta, M.G., L. F. Ramos, P. B. Lourenço and M. Vas-ta (2014). Structural Monitoring and Damage Identi-fication on a Masonry Chimney by a Spectral-based Identification Technique. In Proceedings of the 9th International Conference on Structural Dynamics. Porto, Portugal.
Pandey, A. K., M. Biswas and M. M. Samman (1991). Damage detection from changes in curvature mode shapes. Journal of Sound and Vibration, 145(2): 321– 332.
Pandey, A. K. and M. Biswas (1994). Damage detection in structures using changes in flexibility. Journal of Sound and Vibration, 169(1): 3–17.
Peeters, B. and G. De Roeck (1999). Reference-based sto-chastic subspace identification for output-only modal analysis. Mechanical Systems and Signal Processing, 13(6): 855–878.
Peeters, B. and G. De Roeck (2001). One-year monitor-ing of the Z24-Bridge: environmental effects versus damage events. Earthquake Engineering and Struc-tural Dynamics, 30: 149–171.
Ramos, L. F. (2007). Damage identification on masonry structures based on vibration signatures. PhD Thesis, University of Minho, Guimarães, Portugal.
Ramos, L. F., G. De Roeck, P. B. Lourenço, A. Cam-pos-Costa (2010). Damage identification on arched masonry structures using ambient and random im-pact vibrations. Engineering Structures, 32(2010): 146–162.
Ramos, L. F., M. G. Masciotta, P. B. Lourenço and M. Vasta (2013). SHM of a masonry chimney after a lightning accident. In: Structural Health Monitoring 2013, Proceedings of the 9th International Work-shop on Structural Health Monitoring. Stanford, CA (USA), 1–2, 740–747.
Reynders, E., A. Teughels and G. De Roeck (2010). Finite element model updating and structural damage
iden-tification using OMAX data. Mechanical Systems and Signal Processing, 24(2010): 1306–1323.
Reynders, E. and G. De Roeck (2009). Continuous vibra-tion monitoring and progressive damage testing on the Z24 Bridge. In Encyclopedia of Structural Health Monitoring, chapter 126.
Sohn, H., C. Farrar and F. Hemez (2004). A review of structural health monitoring literature: 1996–2001. Los Alamos National Laboratory, NM.
Stubbs, N., J. T. Kim and K. Topole (1992). An efficient and robust algorithm for damage localization in off-shore platforms. In Proceedings of ASCE 10th Struc-tures Congress, 543–546.
SVS (2011). ARTeMIS Extractor Pro User’s Manual, Re-lease 5.4. Structural Vibration Solutions. Aalborg, Denmark.
Vakil-,Baghmisheh M. T., M. Peimani, M. H. Sadeghi and M. M. Ettefagh (2008). Crack detection in beam-like structures using genetic algorithms. Applied Soft Computing, 8(2): 1150–1160.
Yan, Y.J., L. Cheng, Z. Y. Wu and L. H. Yam (2007) De-velopment in vibration-based structural damage de-tection technique. Mechanical Systems and Signal Processing, 21(5): 2198–2211.
*Corresponding author: Maria-Giovanna Masciotta
University of Minho, Department of Civil Engineering, Campus de Azurém, 4800-058, Guimarães, Portugal
email: [email protected]
2017 by Istituto Nazionale di Geofisica e Vulcanologia. All rights reserved