UNIVERSITA’ DEGLI STUDI DI PISA
DIPARTIMENTO DI INGEGNERIA DELL’INFORMAZIONE:
ELETTRONICA, INFORMATICA, TELECOMUNICAZIONI
DOTTORATO DI RICERCA IN INGEGNERIA DELL’INFORMAZIONE
Ph.D. THESIS
D
EVELOPMENT OF METHODS BASED ON VOLTAMMETRY
FOR THE CHARACTERISATION OF LIQUIDS
SUPEVISORS
Prof. Giuliano Manara
____________________
CANDIDATE
Prof. Giovanni Corsini
Andrea Scozzari
____________________
_______________
Dott. Massimo Guidi
Development of methods based on voltammetry for the characterisation of liquids
i
Preface
The growing interest into multi-sensor systems able to determine general attributes of a process under monitoring, has recently involved the qualitative analysis of liquids; various methodologies to develop taste sensors, often referred to as “e-tongues” have been presented in the literature. The common concept in the different approaches presented by various authors, lies in the combination of signals originated by poorly specific sensors for the characterization of liquids.
The fundamental idea of this PhD work is to investigate how an adequate signal processing approach, applied to a mature and affordable sensor technique (voltammetry), can address the issue of extracting an aggregate chemical information, useful to characterize the liquid under measurement, and even to provide information useful for continuous monitoring and change detection purposes.
Among the various application fields of such systems, there are: food and beverage quality tests, pollution monitoring of superficial and ground water, drinking water quality tests and classification, and control of water distribution networks.
This work has been conducted in the framework of a research for innovative monitoring technologies for the assessment of water quality and for the fast characterisation of surface and ground water; nevertheless, the described methodology and the experiences gained are fully applicable to other areas concerning environmental monitoring, industrial control, and security.
What makes the approach based on “taste sensors” a particularly attractive technology, is its capability to provide direct information about the quality of the resource, instead of the complex data sets coming from traditional selective laboratory measurements. Such feature makes this concept particularly suitable to automatic quality surveillance purposes.
In fact, while the information coming from traditional field instrumentation, providing the main physical/chemical parameters, is poor to fully characterise a liquid sample, a complete laboratory analytical measurement is expensive and cannot provide a continuous control over the resource.
The goal of this PhD activity has been to find new and better solutions to improve the processing of the data acquired with respect to the existent, with a specific interest into a sensor technique based on pulse voltammetry, which is a mature analytical technique, here used in a non-traditional way. Moreover, a prototype has been developed and practical measurement experiences have been carried out, to evaluate and improve the capabilities of the processing chain designed.
Development of methods based on voltammetry for the characterisation of liquids
iii
Acknowledgments
This Thesis has been made possible thanks to the contribution and great support from a series of people. I wish to thank all the personnel and researchers of CNR IGG (Institute of Geosciences and Earth Resources) that have always been very available to provide great help and suggestions.
Moreover to the supervisors of this Thesis, I must be very thankful to Dr. Nicola Acito, which has been co-author of a relevant part of the works that I published in the recent years. Also, Dr. Roberto Cioni, for his tangible contribution to the development of the sensors system used in this work.
Many thanks go to the company Acque S.p.A (water Distribution Company for the area of Pisa) and Dr. Paolo Peruzzi in particular, for his availability and expertise in the studies carried out about drinkable water quality.
Last but not least, my parents, that have always supported me in the difficulties, and with which I very much want to share the good things.
Development of methods based on voltammetry for the characterisation of liquids v
Contents
Preface... i Acknowledgments ...iii Contents ... v Introduction ... 1CHAPTER I ... 3
An overview about taste sensors
1.1 Human sense of taste... 41.2 “E-tongue”: the concept... 4
1.2.1 Definition of “E-tongue” ... 4
1.2.2 Working principles ... 5
1.3 A selection of known applications... 6
References……….….9
CHAPTER II ... 9
Taste sensors based on voltammetry
2.1 Electrochemical fundamentals about voltammetry ... 102.1.1 Definition of voltammetry ... 10
2.1.2 The basic step experiment... 12
2.1.3 General remarks about voltammetry ... 14
2.2 Overview of the most common voltammetric techniques ... 15
2.2.1 Current-potential characteristics ... 15
2.2.2 Chronoamperometry, chronocoulometry, polarography ... 15
2.2.3 Techniques involving large amplitude excitation signals... 15
2.3 Signal processing aspects relating to pulse voltammetry... 17
2.4 Signal processing approach ... 18
References………23
CHAPTER III ... 23
A novel approach to water characterisation based on voltammetry
3.1 The prototype developed... 243.1.1 Hardware... 24
3.1.2 Sensor system... 27
Development of methods based on voltammetry for the characterisation of liquids
3.2 Structure of the signal processing chain ...31
3.2.1 General description ...31
3.3 Study of sub-optimal strategies for feature selection ...33
3.3.1 Definition of a discriminability index...34
3.3.2 Selection strategies...38
3.3.3 The impact on real measurements ...45
3.4 Data representation subspace...47
3.5 One proposed technique for supervised classification...50
References………...……….54
CHAPTER IV... 55
Experimental results
4.1 Classification and change detection approach...564.1.1 General remarks about the experimental conditions...56
4.1.2 Brief overview of the experiments...58
4.2 Experiment #1: bottled water discrimination (“Long01”) ...59
4.2.1 Description of the experiment ...59
4.2.2 Results ...60
4.3 Experiment #2: supervised classification (“Day004”) ...65
4.3.1 Description of the experiment ...65
4.3.2 Results ...66
4.4 Experiment #3: characterisation by standard analytical techniques (“Flegrei”) 72 4.4.1 Description of the experiment ...72
4.4.2 Results ...74
4.5 Experiment #4: detection of pollutants (“LaGabella”) ...82
4.5.1 Description of the experiment ...82
4.5.2 Results ...86
4.6 Experiment #5: drifts in long term measurements (“Testt0102”) ...91
4.6.1 Description of the experiment ...91
4.6.2 Results ...92
4.7 Conclusions ...99
References……….……….101
List of figures...103
Development of methods based on voltammetry for the characterisation of liquids
1
Introduction
In many areas of the measurement technology the methods for getting information about a process are rapidly changing. Instead of measuring single parameters there is a need of measuring more general attributes like quality, availability, efficiency, etc. Many processes are complicated and many different physical as well as chemical parameters need to be measured in real-time.
On that account the concepts of electronic noses and tongues have been developed and attract today a wide interest in different applications such as environmental monitoring. Gas sensor arrays noses) have been until now more studied than their wet counterparts (e-tongues). In fact, electronic noses have already been established for qualitative analysis in various fields in analytical chemistry, especially for the food industry and some environmental applications; there are also some prototypes already on the market. Similar concept; but for analysis in water and even food, have recently been described. The above mentioned devices are respectively related to the sense of smell and taste; thus, the terms electronic nose and electronic tongue (or even taste sensor) have been coined.
The bio-mimetic connection of these systems is due to the way that the human sense organs produce signal patterns to be qualitatively interpreted by the brain. Electronic tongues and noses are in fact normally used to give some qualitative answers about the samples studied and only in special cases to predict the concentration of individual species in the sample, in a similar fashion to what traditional analytical chemistry usually does.
The proposed approach allows an original monitoring method, based on distributed low cost sensors, making use of the technology of the e-tongue; this concept now represents an inexpensive and very attractive way to obtain overall quality indicators of a natural resource or, more in general, of a process under monitoring.
Several attempts are found in the literature regarding the concept of electronic tongue. A prototype of an electronic tongue based on voltammetry has been developed in the framework of this PhD activity. Most of the work has been focused on the development of signal processing algorithms to extract from the data series obtained the useful information for classifying liquid samples, and even to detect eventual changes, including the presence of pollutants.
Experiences made with this prototype and the proposed signal processing approach, have demonstrated their capability in classifying water samples of any kind, i.e. bottled mineral water, superficial and ground water from field sampling campaigns, even thermal water, tap water and bottled beverages.
A brief overview of the state of the art for “e-tongue” systems, a description of the prototype developed, the novel methodological approach to the processing of the signal, and the results obtained in several application experiments, are presented in the next Chapters.
In Chapter I, a general description of electronic taste sensor systems is given. A brief summary of the most used techniques in such devices is presented, followed by an overview of
Development of methods based on voltammetry for the characterisation of liquids
the main possible applications. Finally, the advantages of pulse voltammetry with respect to other techniques will be highlighted.
Chapter II gives an overview of the working principles of e-tongues based on voltammetry, paying attention to the fundamentals of voltammetry and pulse voltammetry in particular, which is the proposed technique in this Thesis.
Chapter III describes the methodology that represents the core of this PhD Thesis work; the sensor device, the control software and the data processing approach are described in this sequence. The signal processing approach contains most of the novelty with respect to the known literature.
Chapter IV contains a series of case studies, selected according to their relevancy for the peculiarities of the approach described in this Thesis.
1
CHAPTER I
CHAPTER I An overview about taste sensors
1.1 Human sense of taste
The sense of taste is due to the excitation of taste receptors; receptors for a large number of specific chemicals have been identified, that contribute to the reception of taste. Despite this apparent complexity, five types of tastes are commonly recognized by humans:
• Sweet - usually associated with energy rich nutrients
• Umami - the taste of amino acids (e.g. meat broth or aged cheese) • Salty - allows spontaneous tuning of the diet for electrolyte balance • Sour - typically the taste of acids
• Bitter - allows sensing of various natural toxins
None of these tastes are elicited by a single chemical. Moreover, there are thresholds for the detection of taste that differ among chemicals that taste in the same way.
The sense of taste affords an animal the ability to evaluate what it eats and drinks. At the most basic level, this evaluation is used to:
• prevent consumption of potential poisons or toxins, • select food/drinks according to body needs.
In general, food selection and eventual rejection are mediated through the central nervous system. In fact, the complex pattern of signals transmitted to the brain from the taste receptor cells generates the taste sensations. In a similar fashion, an artificial system that provides a similar kind of information may be developed, with a series of foreseen applications such as the ones cited in paragraph 1.3.
Such a bio-mimetic device can be somewhat specialised for different purposes, and can exceed the human detection thresholds, especially for those substances which may be present or not (i.e. small quantities of pollutant in water), but generally undetectable by the human sense of taste, even if potentially harmful.
One of the main goals of the activity regarding this PhD, is a kind of extension of the artificial sense of taste, in order to be able to distinguish between different classes of water even with very slight differences in their constituents, including those cases in which such differences are due to pollution.
In fact, the aim of such devices does not necessarily reside in the ability to emulate the human senses, but is more focused on the capability to characterise the liquid under measurement, in a way that is inspired by biological systems.
1.2 “E-tongue”: the concept
1.2.1 Definition of “E-tongue”
Electronic tongues and taste sensors are devices used to detect and separate compounds. They are in fact systems able to determine general attributes of a process under monitoring. In some papers, a difference between “electronic tongue” and “taste sensor” is made. For instance in [7] a taste sensor system is described as an array of sensors used to classify the different
CHAPTER I An overview about taste sensors
5
tongue is a more general device not necessarily related to some organolectic feature, which gives qualitative information (even taste) in food, drinks, water, process fluids, etc. However, in most papers both terms are used as synonyms.
Behind these somewhat misleading terms “electronic tongue” and “taste sensor”, one finds some kind of array of sensors. The response patterns of such sensors can be analyzed with pattern recognition routines and/or chemometrical methods, where possible. In general, the basic principle behind an electronic tongue is to make use of non-specific and overlapping signals, via the implementation of some pattern recognition technique, to obtain the necessary discrimination between different classes of liquid, for classification and change detection purposes.
In fact, the sensor array in these systems produces signals, which are not necessarily selective to any particular species in the environment, drinking water, etc. but a signal pattern (often a large dataset) is generated, which can be related to certain chemical/physical features of the sample.
The main advantage of electronic tongues and taste sensors lies in the fact that they can help classifying or detect changes of quality in a shorter time and with a far lower analytical cost than a complete set of laboratory analyses, although they are not intended to replace them. In fact, there is a wide range of applications where an overall information is needed, and, the fast response of the device, together with its low analytical cost, contribute to make the application attractive, without competing with traditional chemometrics in terms of selectivity and quantitative precision.
1.2.2 Working principles
Various approaches have been proposed in literature to make multi-sensor systems for wet-chemical applications such as: ion selective and non-selective (glass) electrodes, lipid/polymer membranes, SH-SAW (Shear Horizontal Surface Acoustic Wave) devices, spectrophotometry and voltammetry.
Both glass electrodes and lipid/polymer membranes are based on potentiometry as working principle and require an array of sensors with different selectivity properties to operate; SAW devices [1] are based on the measurement of the propagation speed and attenuation of an acoustic wave due to acoustoelectric interactions with the fluid; spectrophotometry is based on light spectral transmittance measurements, and has been recently experimented on wines [2]; voltammetry takes information about the concentration and diffusion coefficients of redox active species through a measurement of the current flowing in a metal electrode with an applied potential having a specific waveshape, depending on the kind of voltammetric technique employed.
As to potentiometric techniques, a high discrimination capability among different brands of mineral water using an array of glass ion-selective electrodes (ISE) has been shown in [3] and [4].
Results obtained with arrays of potentiometric sensors applied to different kinds of beverages have been shown also recently in [5] and [6].
The known drawbacks of potentiometric techniques [7] lie mainly in the limitation of the detection to charged species, sensitivity to electrical noise and some requirement in the
CHAPTER I An overview about taste sensors
maintenance of the electrodes, such as preparation and conditioning; it is thus worth looking for simpler and more robust approaches, possibly offering similar performance. It is thus of interest to exploit the effectiveness of the technique based on pulse voltammetry and solid metal working electrodes. This approach offers several advantages, such as simplicity, robustness, and a wide range of analytical possibilities, according to several parameters, such as the shape and material of the working electrodes, the excitation signal chosen, and the particular processing which is performed over the data.
Voltammetry, among other possible techniques, is one of the most extensively used in analytical chemistry; in addition, pulse voltammetry, with the aid of a suitable signal analysis support, has proven to be one of the most attractive techniques for classification and change detection purposes [7, 8, 9, 10].
1.3 A selection of known applications
Among the various present and foreseen applications for e-tongue systems, the main industrial, civil and scientific uses are:
• quality control in food and beverage industry, • environmental monitoring: pollution detection,
• drinkable water: quality assessment and contamination control,
• geochemical surveillance: monitoring of natural systems (study and identification of changings connected with events such as earthquake precursory alterations).
In [1] an e-tongue based on an SH-SAW device, in a dual-delay configuration, has been described. One line is shorted (metallised and electrically shielded), while the other is left free (electrically active). In this way, mass loading and viscosity are measured by the shorted delay line, while permittivity and conductivity are monitored by the free delay line. Such parameters of the liquid under test can be related to taste properties.
An experiment made on the filtering plant of a Swedish drinkable water network is reported in [9, 10]. Differences in water quality before (raw water) and after (clean water) the filters are well detected. Such discrimination capability is discussed in both the articles referenced. The sensor technique used in this works is based on pulse voltammetry; everything has been kept at a very preliminary level with respect to the application, thus a commercial device has been used as potentiostat and no custom development for the application is described.
In [3] an e-tongue based on an array of 29 potentiometric chemical sensors is described. The analysis of Italian bottled mineral water and dry red wines is discussed, particularly in terms of discrimination capability. Other works, based on array of non-specific potentiometric sensors, have been presented by the same research group also recently.
In [2] the fusion of three sensor modalities is discussed for the characterisation of red wines: a combination of e-nose (smell of head-space gas), potentiometry (liquid phase electrochemical characterisation) and colour analysis is proposed. Correlation between the different sensor techniques is discussed, and the enhancement of the discrimination capability is
CHAPTER I An overview about taste sensors
7
Several experiences about the effect of pollutants dissolved in water has been done in this PhD work; the most relevant ones can be found in [11], where a slight contamination by trichloroethylene and tetrachloroethylene is detected in two different case studies, and detection of very small quantities of terbuthylazine (a diserbant) has also been proved in another case study. Said experiments can be found in Chapter IV, which contains a selection of the experiments made during this PhD work.
In general, there are two classes of applications into which the application concepts can be split:
• continuous control for asserting quality (such as the taste of some kind of food), • sporadic measurement for classification by similarity.
The first category regards those problems often labelled as change detection ones, while the second represents a typical supervised classification application.
A supervised classification framework has been developed in this PhD work, and has been presented in [12]. As to the sensor technique, an electrochemical method based on pulse voltammetry has been proposed in this work.
Change detection applications require a high maturity in the sensor and signal processing technique; they actually represent one of the most attractive challenges in this family of methods. Both industrial processes in the food and beverage industry and water distribution networks, with their recent issues regarding security against contamination and terrorist threat, would benefit very much from the advancements of this technology.
CHAPTER I An overview about taste sensors
REFERENCES FOR CHAPTER I
[1] M. Cole, G. Sehra, J. W. Gardner, V. K. Varadan, “Development of smart tongue devices for measurement of liquid properties”, IEEE Sensors Journal, Vol. 4, No. 5, October 2004
[2] M. L. Rodriguez-Mendez, A. A. Arrieta, V. Parra, A. Bernal, A. Vegas, S. Villanueva, R. Gutierrez-Osuna, J. A. de Saja, “Fusion of three sensory modalities for the multimodal characterization of red wines”, IEEE Sensors Journal, Vol. 4, No. 3, June 2004
[3] A. Legin, A. Rudnitskaya, Y. Vlasov, E. Di Natale, C. Mazzone, and A. D’Amico, “Application of electronic tongue for quantitative analysis of mineral water and wine,” Electroanalysis, vol. 11, no. 10–11, pp. 814–820, 1999
[4] P. Ciosek, Z. Brzozca, W. Wroblewski, “Classification of beverages using a reduced sensor array”, Sensors and actuators B, 103 (2004), 76-83
[5] L. Lvova, S. S. Kim, A. Legin, Y. Vlasov, J. S. Yang, G. S. Cha, H. Nam, “All-solid-state electronic tongue and its application for beverage analysis”, Analytica Chimica Acta 468 (2002) 303–314
[6] A. Legin, A. Rudnitskaya, B. Seleznev, Yu. Vlasov, “Electronic tongue for quality assessment of ethanol, vodka and eau-de-vie”, Analytica Chimica Acta 534 (2005) 129–135
[7] P. Hauptmann, R. Borngraeber, J. Schroeder, J. Auge, “Artificial Electronic tongue in comparison to the electronic nose – state of the art and trends”, 2000 IEEE/EIA International Frequency Control Symposium and Exhibition
[8] M. Lindquist, P. Wide, “Virtual water quality tests with an electronic tongue”, IEEE IMTC Budapest (Hungary), May 21-23, 2001
[9] C. Krantz-Rulcker, M. Stenberg, F. Winquist, I. Lundstrom, “Electronic tongues for environmental monitoring based on sensor arrays and pattern recognition: a review”, Analytica chimica acta, 426 (2001), 217-226
[10] F. Winquist, P. Wide, I. Lundstrom, “An electronic tongue based on voltammetry”, Analytica chimica acta, 357 (1997), 21-31
[11] A. Scozzari, P. Peruzzi, R. Cioni, M. Guidi, “An innovative approach to urban water management based on taste sensors”, EGU General Assembly, Wien (Austria), 2006
[12] A.Scozzari, N. Acito, G. Corsini, “A supervised algorithm for water classification by voltammetric measurements”, Instrumentation and Measurement Technology Conference, Sorrento (Italy), 2006
2
CHAPTER II
CHAPTER II Taste sensors based on voltammetry
2.1 Electrochemical fundamentals about voltammetry
2.1.1 Definition of voltammetry
Voltammetry is a group of electroanalytical methods in which information about the analyte is derived from the measurement of a current flowing in a polarised working electrode, as a function of the applied potential. That is, the working electrode potential is forced to adhere to a predetermined program, and the current is measured as a function of the applied potential, or as a function of time.
In the methods described in this Thesis the electrodes are supposed to be microelectrodes, and the solution volume is supposed to be sufficiently large to alter negligibly the concentration of electroactive species with the passage of current.
Mass transfer in solutions occurs either because of a gradient in electrochemical potential or because of convection. As a first step, we can consider an unstirred solution, thus with no convection.
According to the approach developed by Butler and Guggenheim [1, 2, 3], the electrochemical potential in a location P is defined as:
µ
iα=
µ
iα+
z
i⋅
F
⋅
φ
α (2.1)Where: i
z is the charge of species i. F is the Faraday’s constant.
α
φ is the electrical potential at the location P for phase α.
α
µi is the chemical potential of the chemical species i in phase α, defined as:
i j n P T i i
n
G
≠∂
∂
=
, , αµ
(2.2) Where:the quantity G is the Gibbs’ free energy. i
n is the number of moles of i in phase α.
Another way of writing the electrochemical potential can be:
i j n P T i i
n
G
≠∂
∂
=
, , αµ
(2.3)Where G is the electrochemical free energy, and differs from G because it includes the influence of the large-scale (i.e. not due to the ions) electrical effects, as they appear in equation
CHAPTER II Taste sensors based on voltammetry
11
The difference of electrochemical potential between two points (A,B) of a solution can arise because of:
• a difference of concentration of electroactive species over the distance A to B, • an electric field with a non-zero component along the direction A-B.
These two phenomena contribute to the mass transport by diffusion and migration, respectively; in addition, the transport flux of charged species is equivalent to a current density.
In the proximity of an electrode, in general, the electroactive substance is transported by both processes (migration and diffusion).
For non convective mass transfer the general flux equation is given by:
φ
∇
⋅
⋅
⋅
⋅
⋅
−
∇
−
=
j j j j j jD
C
T
R
F
z
C
D
x
J
(
)
(2.4) Where: jD is the diffusion coefficient of species j, j
C is the local concentration of species j.
Stirred solutions, which are mostly used in practice, involve forced convection. In this case, a model has been proposed [4], where it is assumed that convection maintains the concentrations of all the species uniform and equal to the bulk values, till a certain distance δ from the electrode. Within this layer having thickness δ, it is assumed that there’s no solution movement, thus mass transfer is thought to be due by diffusion only.
Information about the controlled potential microelectrode techniques is given here at an introductory level, to allow the reader having a complete view of the approach presented in this Thesis, while a deeper explanation would go outside the scope of this work.
A deep theoretical treatment regarding the fundamentals of electrochemical methods, and specifically about voltammetry, can be found in [4, 5].
The basic component of the measurement system is called potentiostat. A potentiostat is device which injects current into an Auxiliary Electrode (AUX), closing the current loop via a Working Electrode (WE), in order to impose a known difference of potential between WE and a Reference Electrode (REF). Such voltage has to be measured with a high impedance differential amplifier, to make negligible the current going through REF.
The voltage imposed across WE and REF is supposed to be determined by a function generator placed at the input of the potentiostat. The experimental observable, that is obtained from each measurement session, is the response of the system potentiostat-cell to the excitation signal (voltage) used, that is, the loop current i(t).
Better detail about the structure of this device will be discussed in paragraph 3.1.1, where the prototype developed for the experimental setup of this Thesis is presented. A simplified connection diagram, which shows the above mentioned configuration, is reported in Fig. 2.1.
CHAPTER II Taste sensors based on voltammetry
Fig. 2.1 Simplified schematic diagram of the experimental system
2.1.2 The basic step experiment
When the applied excitation signal is a step signal, such as the one shown in Fig. 2.2, the obtained response depends on the levels of the applied potential.
Under the hypothesis that there’s only one dissolved species and that it is electrochemically inactive at potential E1 but reduced at E2, a typical response of the experimental system would be the one shown in Fig. 2.3a. The electroactive species eliminated (reduced) at the electrode (WE) produces a concentration gradient in the proximity of such electrode. Moreover, looking at equation (2.4), it comes clear that the flux (thus the current) is proportional to the concentration gradient.
The decay of i(t) is just due to the fact that the flux causes the depletion volume to thicken. In other words, the slope of the concentration profile Co(x) from the WE surface declines while
current flows, the depletion volume gets higher, producing the described decay of i(t). An example of the concentration profile behaviour vs. time is shown in Fig. 2.3b.
The time-dependent concentration and the shape of i(t) can be calculated by solving the diffusion equation under the applicable hypothesis for the problem considered. Details about the electrochemical and mathematical approach to the problem can be found in [4]. Since solutions in a closed form are almost always very difficult to obtain, some hard hypothesis, which give good approximation with a much simpler mathematics, are generally used. A brief overview of the special cases that are usually considered can be found in Paragraph 2.2.1.
Fig. 2.2 Excitation signal waveform for the basic step experiment
AUX WE REF Potentiostat v(t) controlled i(t) Function generator E1 E2 v(t) t t’ + -
CHAPTER II Taste sensors based on voltammetry
13
Fig. 2.3 a) i(t) for the step experiment. b) Concentration profiles at various times
If steps of different amplitudes are applied to the measurement system (Fig. 2.4a), the response i(t) may go through the following different conditions, depending on the varying amplitude:
• potentials at which the species is not electroactive, since there’s no overpotential for reducing,
• potentials at which a flux is present and still incrementing with higher potential levels,
• range of potentials where the current value is clipped by a mass-transfer limitation, thus not incrementing with higher potential levels.
Such range of possible behaviours is clarified in Fig. 2.4b. Supposing that the current is sampled at instant τ, it is possible to plot i(τ) vs. the correspondent step potential, making what is called a sampled-current voltammetry.
The current-potential curve that is obtained (also called voltammogram), is shown in Fig. 2.5, which has been obtained by interpolation of seven samples.
Fig. 2.4 a) Excitation signals for sampled-current voltammetry. b) Current vs. time for the different steps in potential t’ i(t) t Co(x) x Co*(bulk) t1 t2 > t1 t3 > t2 E2 v(t) t t’ E1 E3 E4 ττττ E5 E6 E7 E0 i(t) ττττ t’ E2 E1 E3 E4 E5 E6 E7 t
CHAPTER II Taste sensors based on voltammetry
Fig. 2.5 Current-potential curve (voltammogram)
2.1.3 General remarks about voltammetry
The electrochemical behaviour of a system can be determined by imposing known varying potentials between WE and REF, recording the current-time curve that is obtained in each experiment.
The different activation overpotential levels, diffusion coefficients and mass-transfer limits that are exhibited by each species in a solution, generate a different contribution to the complex voltammogram obtained; the shape of such contribution depends on the waveform of the excitation signal.
It is also known that the complete electrochemical signature of a system can be obtained by applying a series of steps of different amplitude, always recording the current vs. time curve; the approach proposed in this Thesis derives from this concept.
Voltammetry has proven to be one of the most mature and affordable techniques for providing an aggregate information about the quality of water, beverage and food [6, 7, 8, 9, 10]; LAPV (Large Amplitude Pulse Voltammetry) measurements, derived from standard analytical laboratory techniques, has shown excellent sensitivity and discrimination performance for e-tongue applications [7], where, instead of analysing traditional voltammograms, the large multivariate space generated by the time series of the current signal is used to characterise the fluid under measurement, providing an overall quality information.
In fact, voltammetry, among other possible techniques, is one of the most extensively used in analytical chemistry, and appears to be very promising for classification and change detection purposes.
In the following Chapters a general overview of the available voltammetric methods will be given. Particular attention goes to those techniques which make use of large amplitude excitation signals. ik(ττττ) Ek E2 E1 E3 E4 E5 E6 E7 x x x x x x x
CHAPTER II Taste sensors based on voltammetry
15
2.2 Overview of the most common voltammetric techniques
2.2.1 Current-potential characteristics
As already said in Paragraph 2.1.2, there are a number of special cases according to which the excitation signals are generally classified. This is in order to make the calculation of current-time and current-potential curves easier, under some circumstances that lead to some approximate mathematical solution.
Methods can be classified according to the following special cases:
Large Amplitude Potential Step: current is limited by mass transfer, thus current is independent of potential for activated species and is negligible for the inactivated ones
Small Amplitude Potential Changes: such small variations may be of different shape, the relationship between current and overvoltage is simplified in a linear form
Reversible Electrode Process: when anodic and cathodic effects (oxidation and reduction) are almost simultaneous
Totally Irreversible Electrode Process: when only one of the two effects (oxidation or reduction) is appreciable
Most techniques, as discussed in Paragraph 2.2.2, make use of such approximations.
2.2.2 Chronoamperometry, chronocoulometry, polarography
The kind of experiments that can be made in the known voltammetric methods can be catalogued as follows:
Chronoamperometry: when current is recorded as a function of time in correspondence to a know excitation waveform
Chronocoulometry: integral approach equivalent to chronoamperometry, measuring the amount of charge which passed
Polarography: when samples of the current measurement are taken from a sequence of step experiments and placed on the current-potential plane. The curve obtained is said polarogram.
2.2.3 Techniques involving large amplitude excitation signals
This Paragraph presents a brief overview of the mostly used analytical techniques for voltammetry, where large amplitude excitation signals are used. A wider and more detailed explanation of the presented methods can be found in [11].
Linear sweep voltammetry: it is a chronoamperometry where the excitation signal is a ramp. Typical excitation waveform and response signal are shown in Fig. 2.6.
Polarography: it is classified in various versions, such as pure polarography, tast polarography and sweep polarography. Mostly used for quantitative measurements, it is generally used with renewable Working Electrodes, such as the dropping mercury ones (DME). Current values placed in the current-potential curve are the average or plateau (mass-transfer limited) values calculated for each measurement. The obtained curve is a kind of locus of the
CHAPTER II Taste sensors based on voltammetry
calculated values for each current-time response obtained. Results are similar to the one shown in Fig. 2.5 Current-potential curve (voltammogram).
Triangular wave voltammetry: as for Linear Sweep Voltammetry, makes use of triangular excitation signals, eventually in a cyclic form.
Normal pulse polarography: the excitation waveform is made by successive pulses with linearly increasing amplitude. Again, a polarographic current-potential response is obtained, when sampled current is plotted against potential pulse value. Usually applied to dropping Working Electrodes. Excitation signal and a typical response curve are shown in Fig. 2.7.
Double potential step chronoamperometry: a double step pulse as described in Paragraph 2.2.1, with opposite edges. In [11] this technique is distinguished from pure chronoamperometry by the fact that E1 in Fig. 2.8 differs from the open-circuit potential.
Fig. 2.6 Excitation waveform and typical response for linear sweep voltammetry
Fig. 2.7 Excitation waveform and typical voltammogram for normal pulse polarography; sampled values are usually represented in a stepwise manner. E is the step amplitude, I the sampled current
v(t) t t i(t) v(t) t … I E
CHAPTER II Taste sensors based on voltammetry
17
Fig. 2.8 Example of an excitation signal and a current-time curve for a double potential step chronoamperometry
2.3 Signal processing aspects relating to pulse voltammetry
The fundamental idea of this work is to investigate how an adequate signal processing approach applied to a mature and affordable sensor technique (voltammetry) can address the issue of extracting an aggregate chemical information, useful to characterize the liquid under measurement.
The measurement method proposed here is based on the following idea: instead of analysing traditional voltammograms, samples of the current signal are collected, making a kind of chronoamperometry. The shape of the excitation signal and the configuration of the acquisition system are discussed in Paragraph 3.1.1 and 3.1.2.
The large multivariate space, generated by the time series of the current signal acquired, is used to characterise the fluid under measurement; the work is thus focused on the signal analysis techniques useful to make a measurement system capable to:
• detect changes in a continuous monitoring framework, • perform an automatic classification.
When dealing with data series coming from voltammetric measurements, especially when data come from a high sampling rate pulsed voltammetry, the crucial signal processing issues regard the reduction of dimensionality of the dataset and the extraction of suitable features to enhance the discrimination between different classes.
In fact, the efficiency of the dimensionality reduction algorithms has a beneficial impact on the hardware requirements for a system which has to implement them. The possibility of embedding the computational power in a low-cost monitoring device, strongly depends on how
t v(t) t i(t) E1 E0 E2
CHAPTER II Taste sensors based on voltammetry
efficiently datasets having large dimensionality can be reduced with an acceptable loss of information.
Consequently, one important aspect is to study techniques to extract useful information from the large multivariate space generated by such measurements.
This task can be accomplished in two steps: • dimensionality reduction
• feature extraction.
Both classification and change detection applications require optimising the performance of the data processing system in terms of discrimination capability.
More in detail, both the hardware and the software of the equipment have to be designed taking into account the following basic requirements:
• easy implementation on embedded devices having relatively poor resources, • light computational load,
• high discrimination performance.
The efficiency of the dimensionality reduction and feature extraction algorithm becomes an essential element in the development of such devices, according to the said guidelines.
Thus, one essential aim of this work is to define a classification system that can learn by a suitable training set (eventually acquired in the laboratory) to be used on the field for successive measurements after the tuning process; both electrolytic solutions made in the laboratory and water samples coming from the real world can be used for this purpose. In fact, depending on the target application, different approaches can be used in building up the training set, such as using water samples belonging to different chemical classes for characterisation purposes, or simulating different concentration levels of known pollutants, for change detection and surveillance uses.
Once the classification system has been trained, it is then ready to be used for characterising unknown samples in the successive measurements. This approach is described in 3.2.1, going into further detail in 3.5, finally an example is presented in 4.3.
Measurement repeatability is a fundamental aspect in the development of such an approach, and it involves the design of the measurement cell, the analog front-end and the acquisition strategy as well.
2.4 Signal processing approach
In this Paragraph, a brief overview about the signal processing approaches proposed up to now for pulse chronoamperometric data series, is given. There’s actually not much literature of this kind, essentially because most of the research is focused on innovative sensor techniques, more then better exploiting known ones, with innovative signal processing concepts. Moreover, comparisons with respect to the known literature will be found along the discussion of the proposed signal analysis methodology, in Chapter III.
CHAPTER II Taste sensors based on voltammetry
19
Most of the efforts are essentially focused on the aspects regarding the reduction of dimensionality of the collected data.
The main motivations for dimensionality reduction can be listed as follows: • to reduce the complexity of classifiers,
• to improve classification accuracy with respect to known problems, such as Hughes effect [12, 13] due to insufficient number of observations, or poor generalisation,
• to reduce the computational cost of measurement extraction • to better assess class separability.
In [6, 7, 8] PCA (Principal Component Analysis) is applied to the time-domain samples, where each sample is represented by a component of the observed vector; the dimensionality of the space may be limited before applying PCA, by taking selected samples from the time domain signals; in [7] a factor 30 down-sampling from the original 900Hz sampling rate is proposed, but no criteria for selecting a sub-set of optimal samples is given.
In general, the approach based on PCA implies quite a high computational load. In fact, for spaces having large dimensionality PCA is very intensive computationally; alternative techniques to determine a suitable representation space can be used, as discussed in Paragraph 3.4.
In [9] a Wavelet transform is applied to a high sampling rate time series, to reduce the dataset and to optimize both change detection (monitoring) and classification (discrimination) capabilities. The proposed data processing chain, applicable when a training set of known observations is available, is constituted by:
• Discrete Wavelet Transform (DWT) of the acquired data,
• sort of the transformed coefficients according to the following uni-variate discrimination measure:
∑
∑
∑
= = =−
⋅
−
−
⋅
−
=
q i i q i i i q i mean i within betweenq
n
V
n
m
m
q
V
V
1 1 1 2)
(
)
1
(
)
(
1
1
(2.5) Where:q is the number of classes, i
m is the mean of the selected coefficient in class i, mean
m is the mean of the selected coefficient for the total of the observations, i
n is the number of observations in class i, i
CHAPTER II Taste sensors based on voltammetry
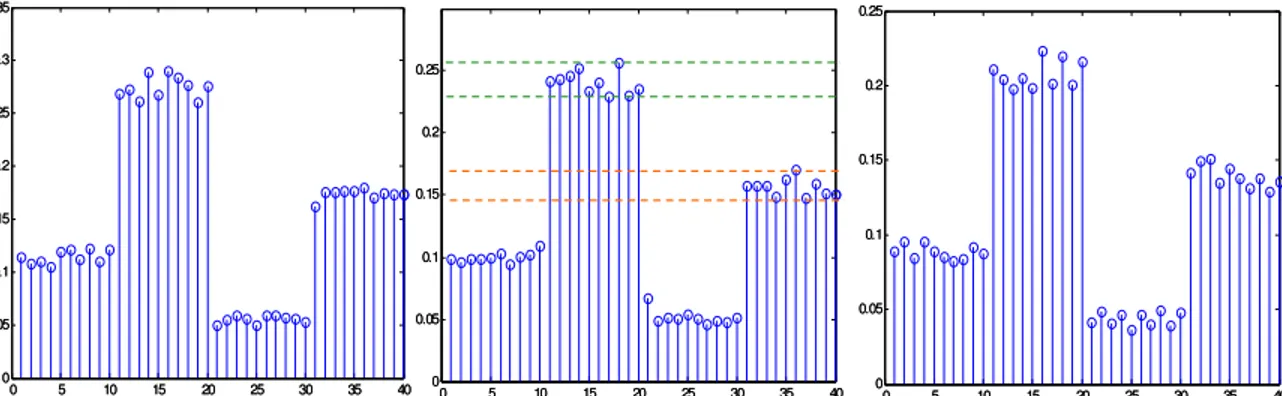
• selection of the first L sorted coefficients according to their discrimination value, • select the subset of coefficients (if it exists), which maximizes the Mahalanobis
distance between clusters,
• apply PCA to said subset and take the first two Principal Components as a representation space.
This processing scheme is prone to the following considerations: • there’s no strategy to determine an optimal value for L,
• in practical experiments L is taken so large (order of thousands) that subset selection becomes slow,
• the first L sorted coefficients are not the best L coefficients. An approach closer to exhaustive optimality can be considered.
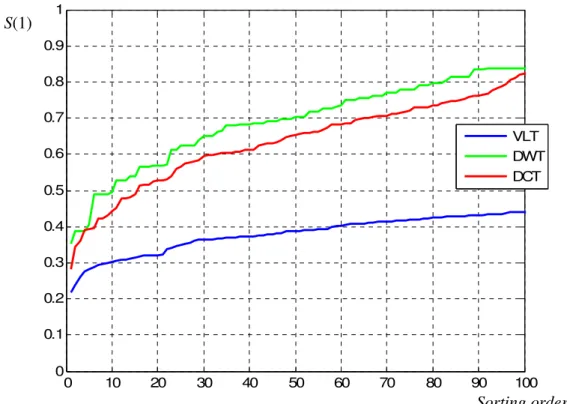
The signal processing scheme proposed in this Thesis, among other peculiarities, aims at finding an optimal (or sub-optimal) dimensionality of the feature space, by using sub-optimal search strategies that do not necessarily group coefficients sorted according to an uni-variate discriminability measure.
A review of data compression methods aimed at saving memory space and computational time, essentially based on the Wavelet transform and Hierarchical PCA is presented in [14].
Two different experiments are presented in the paper, both making use of pulse chronoamperometry, made sequentially with four different Working Electrodes. Aim of such experiments is to compare the compaction performance and class discriminability that it is possible to obtain with different approaches.
To reduce the datasets derived from voltammetric e-tongue measurements, the following three procedures have been experimented:
• Two-step HPCA, first on data coming from each WE, then on the combined data, • Selection of Wavelet transformed samples according to their variance,
• PCA applied to electrochemical parameters extracted from time domain samples (time constant, Faradaic current, peak current).
The weak aspects of this approach can be individuated in:
• data selection according to variance does not imply a direct estimation of discriminability,
• as a consequence, Wavelet transformed data seem to have less performance then the PCA of the electrochemical parameters,
• only information about discrimination capability is given, no classification framework is presented.
In conclusion, especially when developing a device for field use, there’s still the need to make further developments on specific methodologies to:
CHAPTER II Taste sensors based on voltammetry
21 • optimise the discrimination performance,
• develop dedicated supervised classification schemes, • develop affordable change detection algorithms.
CHAPTER II Taste sensors based on voltammetry
REFERENCES FOR CHAPTER II
[1] J. A. V. Butler, Proc. Royal Society, London, 112A, pg. 129, 1926 [2] E. A. Guggenheim, J. Phys. Chem., 33, pg. 842, 1929
[3] E. A. Guggenheim, J. Phys. Chem., 34, pg. 1540, 1930
[4] A. J. Bard, L. R. Faulkner, “Electrochemical methods, fundamentals and applications”, John Wiley & Sons, 1980.
[5] G. Korthum, Treatise on electrochemistry, 1965
[6] M. Lindquist, P. Wide, “Virtual water quality tests with an electronic tongue”, IEEE IMTC Budapest (Hungary), May 21-23, 2001
[7] C. Krantz-Rulcker, M. Stenberg, F. Winquist, I. Lundstrom, “Electronic tongues for environmental monitoring based on sensor arrays and pattern recognition: a review”, Analytica chimica acta, 426 (2001), 217-226
[8] F. Winquist, P. Wide, I. Lundstrom, “An electronic tongue based on voltammetry”, Analytica chimica acta, 357 (1997), 21-31
[9] T. Artursson, M. Holmberg, “Wavelet transform of electronic tongue data”, Sensors and actuators B, 87 (2002), 379-391
[10] L. Robertsson, P. Wide, “Improving food quality analysis using a wavelet method for feature extraction”, IEEE IMTC Ottawa (Canada), May 16-19, 2005
[11] J. Inezedy, T. Lengyel, A. M. Ure, “Compendium of analytical nomenclature”, IUPAC analytical chemistry division, 3rd edition, 1997
[12] G. F. Hughes, "On the mean accuracy of statistical pattern recognizers," IEEE Transactions on Information Theory, Vol. IT-14, No. 1, January 1968.
[13] L. Jimenez, D. Landgrebe, “Supervised Classification in High Dimensional Space: Geometrical, Statistical and Asymptotical Properties of Multivariate Data”, IEEE Transactions on Geoscience and Remote Sensing,Vol 37, No. 6, November 1999
[14] S. Holmin, P. Spangeus, C. Krantz-Rulcker, and F. Winquist, “Compression of electronic tongue data based on voltammetry - a comparative study,” Sensors and Actuators, vol. B 76, pp. 455–464, 2001
3
CHAPTER III
A novel approach to water characterisation
based on voltammetry
CHAPTER III A novel approach to water characterisation based on voltammetry
The design of devices based on the principles illustrated in this Thesis requires a specific methodological approach, such as the one described in this Chapter. A description of the experimental setup and details about the proposed signal processing methodology are given here.
3.1 The prototype developed
3.1.1
Hardware
The equipment used to generate the datasets discussed in this Thesis has been custom designed and built, including the potentiostatic device; this makes possible to take advantage of the many analytical possibilities that voltammetry offers by modifying key working parameters of the instrument (i.e. number and type of the electrodes, shape, duration and amplitude of the excitation waveform). A simplified block diagram of the device is shown in Fig. 3.1.
Both the synthesis of the excitation signal and the collection of the current measurements are controlled by a Personal Computer (PC), where a commercial ISA card (Axiom model AX5621H+ [1]) provides all the necessary I/O (ADC, DAC and digital signals) plus an independent XTAL rate generator used as a timebase for the whole system, separated from the PC system clock.
Said ISA card hosts a SAR A/D converter with S/H stage, 12 bit ADC, 8 TTL compatible digital outputs and an 8254-like configurable counter used as timebase generator; the main specifications of such devices are found in Tab. 3.1.
Parameter Typ. @25°C Unit
SAR A/D resolution 16 bit
No missing codes 15 bit
S/H aperture delay 40 ns
A/D conversion time 8 µs
D/A resolution 12 bit
D/A linearity error ±1/4 LSB
D/A full scale range change settling time
4.5 µs
Tab. 3.1 Main specifications of the A/D and D/A devices used
With the configuration of Fig. 3.1 the potential on the working electrode is tied to the analog ground by the I/V converter (1); the differential electrometer (2) is connected to the
CHAPTER III A novel approach to water characterisation based on voltammetry
25
voltage difference between the reference electrode and the selected working one is equal to the voltage set by the PC via the A/D converter. All this is true until both the voltage assumed by the Counter-Electrode (CE, also said Auxiliary Electrode) and the current which flows through it, lie in the output swing capability of (3).
One or more relays, directly controlled by the PC card digital I/O lines, select the proper working electrode for each phase of the acquisition process.
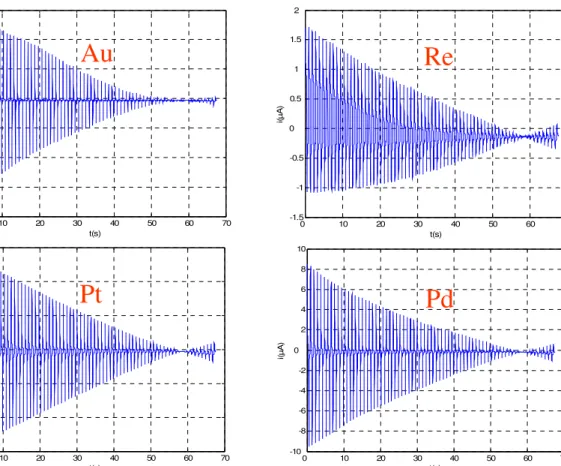
The current flowing through the selected Working Electrode (WE) is converted into a voltage and acquired via the A/D stage; collected data are stored by the PC and form one sampling sequence, such as those shown in Fig. 3.4.
The current signal conditioning circuit has to handle current levels down to the nA; it is based on a DIFET (dielectrically insulated FET) OPAMP (OPA129B), selected for its low bias current and small offset drift and noise, suitable for the application (see the data sheet [14]). A block schematic, that gives better detail of such stage, is reported in Fig. 3.2. To better exploit the dynamic range of the converted signal, two identical stages with different conversion resistors (RI1,2) are selected via a low loss switch (SW2, ADG432B), to get the maximum unsaturated signal between the two paths; to even reduce switch and layout current losses at the input, SW1 has been chosen to be a manual mechanical switch. Full scale signal levels determine the switches’ position, and are dependent on the nature of the water under measurement. Cc capacitors are placed to reduce the consequences of high frequency noise picked up by the cabling and the electrodes, such as switches’ crosstalk and OPAMPs’ oscillation and distortion. Their band limiting effect is neglectible with respect to the following filter, being their pole higher than 1KHz.
To improve the frequency response and linearity of the front end, gain is partially allocated to the later stage, after filtering with a first order filter. The cut-off frequency of said filter, as indicated in Fig. 3.2, is the one chosen for the experiments described in this Thesis; experience has shown that with the excitation signal used, there’s no significant improvement in cutting at higher frequencies; only the usage of smaller electrodes and of faster excitation signals would imply the need for a wider bandwidth.
The four Working Electrodes are made of different solid metals, having different redox properties. Various metals and different quantities of WEs have been presented in the literature. As an example, in [8] the Working Electrodes are four, while in [9] a probe with six WEs has been used.
A first order filter at the input of the control amplifier (3) is necessary to prevent electrode-fluid system nonlinearities from inducing self oscillations in the potentiostat loop, when fast signals are applied at its input. Depending on the electrolyte under measure, the cut-off frequency may range between 5 and 50 Hz for the configuration used.
The shape of the excitation signal is programmable, via the implementation of a virtual waveform generator in the software which runs on the controlling PC. The voltammetry control software has been completely custom developed for this work; it is a DOS application written in PowerBasic language, suitable to run on any x86 platform. Signal analysis software has been developed in MATLAB environment and runs on a separate machine. Data between the two PCs are transferred through their parallel ports.
CHAPTER III A novel approach to water characterisation based on voltammetry
The main guidelines that have driven the design of the hardware are: sampling rate stability, small S/H aperture time (in the A/D converter), precision in the phase relationship between the excitation signal steps and the sampling times. This was to ensure a proper repeatability of the data sequences obtained, in the effort of better evaluating the subsequent signal processing results.
Fig. 3.1 Simplified block diagram of the test set used
Fig. 3.2 Simplified block diagram of the current signal conditioning circuit
+ - Low-pass filter D/A converter + - Low-pass filter A/D converter CE WE1 WE2 REF 1
+
Acquired signal Excitation sequence + - vg(t) iWE(t) 2 3 WE selection command WE3 WE4 1 = I/V converter 2 = Differential electrometer 3 = Control amplifier 4 = Ultrasonic transducer 4CE = Counter Electrode (auxiliary). WE1,2,3,4 = Working Electrodes #1,2,3,4 REF = Reference Electrode (Ag/AgCl)
To the multi I/O board (ADC input) + - RI2 + - RI1 x 10 fc=20Hz Cc1 Cc2 From the WE selector SW1 SW2
CHAPTER III A novel approach to water characterisation based on voltammetry
27
3.1.2
Sensor system
The excitation signal used in the presented experiments corresponds to the Large Amplitude Pulse Voltammetry (LAPV ) method, and the waveshape is the one proposed in [10]. The signal is made by successive pulses of varying amplitude and constant duration (470 ms), starting from +900 mV and stopping at –130 mV, with 71 amplitude steps and a time interval between pulses equal to the pulse duration (470 ms). The excitation function, taken as the instantaneous voltage vg(t) applied to the input of the low-pass filter, is shown in Fig. 3.3.
The acquired data is constituted by the collected sequence of samples of the current signal measured by the I/V converter, thus making a kind of chronoamperometry generated by a sequence of pulse excitations.
In a first version of the sensor system, the Working Electrodes were two wires made of Au and Re, about 5mm long; the Reference Electrode was an Ag/AgCl one, while the Counter-Electrode was a stainless steel plate having an area of about 2 cm2. The first preliminary experiments have been made in this configuration.
In a more recent version, the measurement cell comprises four Working Electrodes, made of Au, Re, Pt and Pd; all of them are encased in a Plexiglas tube filled by an epoxy sealant. The wet surface of each electrode has an area of 0.2 mm2 and it is flattened to make a uniform surface with the epoxy compound.
The usage of Working Electrodes having a small wet surface (even microelectrodes) allows a better performance than by using traditional ones, thanks to their lower capacitance and a better exploitation of the diffusion effect. This implies that the analog front-end must handle smaller currents than with larger electrodes, with the same potentiostat bandwidth, and is prone to higher noise pick-up.
Each water sample under measurement is continuously stirred with a magnetic stirrer inside the measurement cell, during all the time of the measurement session. The volume of water contained in the cell is about 50 ml.
Different cleaning techniques have been experimented: chemical cleaning with H2SO4 1M, followed by rinsing in distilled water, has been performed in the first experiments between any two measurements of liquids belonging to different classes.
In the most updated version, the measurement cell is completed by an ultrasonic transducer placed at its bottom, used for the periodic washing of the wet parts, without making use of any aggressive chemicals or direct mechanical scrubbing, thus preventing any modifications to the electrodes’ surface which may somewhat alter the repeatability of the measurements. Thanks to that, ultrasonic washing appears to be a useful procedure for long-term field use. Chemical cleaning is now used in a sporadic way, especially after long periods of inactivity.
Fig. 3.5 shows the configuration of the electrodes on their mounting probe, which has been designed and built for the measurement cell.
CHAPTER III A novel approach to water characterisation based on voltammetry
Fig. 3.3 Waveshape of the excitation signal used
Fig. 3.4 An example of the acquired signals. The correspondent WE material is shown for each of the time series 0 10 20 30 40 50 60 70 -1 -0.5 0 0.5 1 1.5 2 2.5 3 3.5 4 t (sec.) V g ( V ) t(sec) vg (V ) 0 10 20 30 40 50 60 70 -10 -8 -6 -4 -2 0 2 4 6 8 10 t(s) i( µ A ) 0 10 20 30 40 50 60 70 -15 -10 -5 0 5 10 15 t(s) i( µ A ) 0 10 20 30 40 50 60 70 -1.5 -1 -0.5 0 0.5 1 1.5 2 t(s) i( µ A ) 0 10 20 30 40 50 60 70 -8 -6 -4 -2 0 2 4 6 t(s) i( µ A )
Au
Re
Pt
Pd
CHAPTER III A novel approach to water characterisation based on voltammetry
29
Fig. 3.5 Electrodes’ mounting probe used for the experiments
3.1.3
Software
As already mentioned in Paragraph 3.1.1, the shape of the excitation signal is programmable, via the implementation of a virtual waveform generator in the software which runs on the local (controlling) PC. The voltammetry control software has been developed in two versions:
• a DOS application written in PowerBasic language, as a first version,
• a Windows CE 5.0 application written in C++, suitable to run on any x86 platform. Signal analysis software has been developed in MATLAB environment and runs on a separate machine. Data between the two PCs have been transferred through their parallel ports, due to the availability of very affordable and fast enough applications for the interconnection between DOS and Windows platforms.
DOS for the acquisition PC in the experimental setup has been chosen for its complete absence of time critical issues due to the underlying Operating System; mere experiments without special needs of user interface and connectivity are very easy to handle, in this way. In addition, the development of custom low-level drivers for the direct access to the I/O space is immediate, as well as porting the drivers to microcontroller environments (i.e. simple machines that perform only the acquisition task, sending raw data remotely).
The described solution used for the experimental setup is now being ported to a Windows Mobile (CE 5.0) platform, in the view of providing the field device in its final version with the typical user interface and connectivity (i.e. TCP/IP, FTP, PPP), that are generally available nowadays. In this case, also the MATLAB software, re-written for the Windows CE environment in C++ language, is intended to run on the same target machine. Also, the hardware of the final field version differs from the experimental setup, especially in the acquisition front-end, but it keeps an identical functionality thanks to the high availability of register-compatible devices in the embedded market, which are compliant with the Keithley DAS-16 standard. Working Electrodes (4) Ag/AgCl Reference Electrode Counter Electrode (Auxiliary)
CHAPTER III A novel approach to water characterisation based on voltammetry
In fact, the components of the experimental setup and the software architecture are determined in the view of the development of a portable field instrument with fully embedded and autonomous functionalities.
The functional structure of the software embedded in a portable prototype must take into account two general application frameworks:
• stand-alone operation for continuous monitoring,
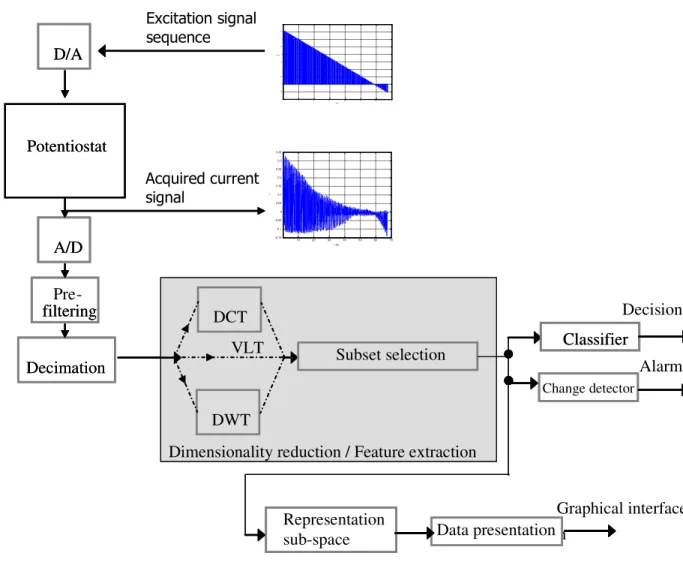
• sporadic laboratory or field use for characterization and supervised classification. Fig. 3.6 shows a complete schema of the functionalities of the prototype.
The embedded device is thought to be connected to a local or remote workstation PC. The first step is therefore to determine the functionalities of the embedded device. These are: acquiring data (continuously or not), signalling alarms upon detection of changes, providing remote connectivity to retrieve data, managing a communication protocol to update working parameters and excitation functions and, finally, visualizing on a local display a representation of the acquired and processed time series.
The second step is to determine which operations have to be carried out by the workstation PC, which implies the implementation of the entire communication protocol and user interface that are not required at the development stage, but are necessary at a certain degree of availability in order to perform field applications. Nevertheless, a more detailed description of the application software framework goes outside the scope of this Thesis.
Fig. 3.6 Complete outline of the functionalities of the embedded prototype
Inside the “e-Tongue” module shown in Fig. 3.6, there are the functionalities of the control software that implements the algorithm for the voltammetric measurement.
Since the sampling interval is set to 1 ms, suitable sampling rate stability and synchronisation between pulse steps and sampling times have been obtained using a monolithic (uninterruptible) software routine that sets the D/A and reads the A/D, each time the sampling
e-Tongue Classifier Change Detector Acquisition Management Alarm Manager Communication manager