1 UNIVERSITA’ DEGLI STUDI DI PISA
A
nno Accademico 2011/2012Tesi di Specializzazione in Gastroenterologia Direttore: Prof. Santino Marchi
TITOLO: IL28B polymorphism in chronic HBV infection: the CC allele does not correlate with the phase of the infection nor with HBsAg clearance in IFN treated patients
Candidato: Beatrice Cherubini Relatore: Prof. Ferruccio Bonino
2
INDEX
1. INTRODUCTION n. Pag da modificare 1
1.1 HBV biology 1
1.1.1 Morphology of HBV 2
1.1.2 HBV Genome and Protein 3
1.1.2.a S gene/HBsAg 5
1.1.2.b PreC/C gene/HBeAg, HbcAg 8 1.1.2.c P gene/Polymerase 10
1.1.2.d X gene/Xprotein 11
1.1.3 HBV life cycle 12
1.1.4 Viral Heterogeneity 15
1.1.4.a S Mutations 16
1.1.4.b PreC/C Mutations: HBeAg Mutants 20 1.1.4.c P Mutations 23
1.1.4.d X Mutations 25
1.1.4.e Genotype/Geographical distribution 25 1.2 Hepatitis B virus infection and disease 28 1.2.1 Diagnosis of HBV infection 31 1.2.2 IL28B polymorphism 32
2. AIM OF THE STUDY 35
3. PATIENTS AND METHODS 36
3.1 Patients 36
3.2 Serology and Histology 38 3.3 Statistical Analysis 41
3
4. RESULTS 43
4.1 IL28B and baseline features -- 4.1.a Distribution according to disease stage -- 4.1.b Distribution according to histology -- 4.2 IL28B and spontaneous outcome of infection -- 4.3 IL28B and response to IFN treatment -- 4.4 IL28B and kinetics of HBV-DNA and HBsAg
decline in 15 HBeAg positive and 27 HBeAg
negative patient during Peg-IFN treatment --
5. DISCUSSION 53
6. CONCLUSIONS 60
4
ABSTRACT
Background and Aim
IL28B polymorphism (IL28Bp) is associated with spontaneous and treatment induced HCV clearance, whereas its role in HBV infection is still debated. We analysed the correlation between IL28Bp and phase and outcome of HBV infection and HBsAg clearance in Interferon (IFN) treated patients.
Patients and Methods. We studied 525 consecutive chronic HBV carriers (63.4% males; median age 47.3 y., range:16-86, genotype D 88%) followed up at the Hepatology Unit of the University Hospital of Pisa since 1998. They were 71 HBeAg pos and 454 HBeAg neg. During follow-up (fu) 138 patients were treated with IFN +/- nucleos(t)ide analogues (NA). IL28Bp SNP rs12979860 was characterized by allele-specific RT-PCR (LightMix, Roche). Quantitative HBsAg (Architect, Abbott) and HBV-DNA (Cobas TaqMan, Roche) were tested at baseline (BL) in all carriers, during therapy (week 1-4-12-24-48) in 42 Peg-IFN treated pts.
Results. In the overall population IL28Bp was: CC 49.7%, CT 40.4% and TT 9.9%. The CC allele prevalence was not statistically different according to age, gender (males: 49.5%), HBeAg status (pos: 59.2%), HBeAg negative inactive (48.2%) or active (49.7%) infection. Median Log HBV-DNA and HBsAg levels at BL in CC (4.46 and 3.34), CT (4.40 and 3.18) and TT (4.34 and 3.19) carriers were comparable. During fu 14/122 (11.5%) inactive carriers cleared HBsAg: 7.4% CC,14.8% CT, 14.3% TT, n.s. Among IFN+/- NA treated pts, 8/29 (27.6%) HBeAg pos (50% CC) and 21/127 (16.5%) HBeAg neg (33.3% CC) lost HBsAg. At multivariate analysis the only independent factor associated with HBsAg loss was genotype non D (P=0.009). During peg-IFN mono-therapy week 12 HBV-DNA, but not HBsAg, became significantly lower in CC (7) than in CT/TT (7/1) HBeAg pos pts (4.94 vs 7.90, P=0.029). No difference was found in HBeAg negative pts.
Conclusions. The IL28B CC allele does not correlate with the phase and the outcome of HBV infection. HBsAg and HBV-DNA levels at BL and HBsAg clearance in IFN +/-NA
5 treated pts were not influenced by the CC allele, although a faster HBV-DNA was found in HBeAg pos CC pts. These findings underline major differences in the mechanisms of natural and therapy induced control of HBV and HCV infections.
1.
INTRODUCTION
1.1 HBV biology
Human Hepatitis B virus (HBV) is classified as a member of the Hepadnaviridae family [Gust et al, 1986] (hepatotropic DNA viruses), that can be divided into two genera: the
Orthohepadnaviruses, infecting only mammals, and the Avihepadnaviruses infecting
birds. To date, two major species have been assigned to the Avihepadnaviruses, the duck hepatitis B virus (DHBV) and the heron hepatitis B virus (HHBV). The Orthohepadnavirus genus includes the four best-known distinct species human hepatitis B virus (HBV), woodchuck hepatitis virus (WHV), ground squirrel hepatitis virus (GSHV) and woolly monkey hepatitis B virus (WMHV). The host range of Orthohepadnavirus varies in the different species allowing in some case the possibility to have more infecting animal models. WHV, is a well studied orthohepadnavirus that occurs naturally in marmots and cannot be transferred to other rodents like its relative GSHV [Summers et al., 1978; Mason et al., 1980]. GSHV can infect woodchucks, thus its host range is not as narrow as the WHV host range. Finally, the WMHV, despite having a non-human primate as its natural host, in contrast to HBV, is not infectious for chimpanzees [Lanford et al. 1998].
6 1.1.1 Morphology of HBV
The infectious HBV virion (Dane particle) is spherical shaped and has a diameter of 42-47 nm. External envelope consists of a cell derived phospholipidic bilayer with three different surface protein embedded in it. These proteins, according to their size are named HB small surface antigen (HBsAg), middle (HBMAg), or large (HBLAg). The nucleocapsid, which forms the inner part of the Dane particle, is around 28 nm in size and contains a single copy of the circular partially double-strand genomic DNA which is covalently linked to the viral reverse-transcriptase (fig 1).
Fig. 1 – HBV structure
The average size of the viral genome is around 3.2 kbp, varying slightly from genotype to genotype and from isolate to isolate. The viral genome encodes for the core protein (HBcAg), the pre-core protein also known as the e-antigen (HBeAg), the polymerase, the three surface proteins, and the X protein.
42-45 nm
Polymerase (P) DNA
Medium Surface protein Large Surface protein Small Surface protein Icosahedral core (C)
7 1.1.2 HBV Genome and Proteome
The HBV genome is a relaxed circular, partially double stranded DNA of approximately 3,200 base pairs. There are four partially overlapping open reading frames encoding the envelope (Pre-S/S), core (Precore/Core), Polymerase, and X proteins (fig. 2) [Tiollais et al. 1985; Seeger et al. 2000]. All open reading frames are in an identical orientation and overlap at least partially. Within the Dane particle the negative strand of the viral genome is present in full-length, thus carrying the whole genome. In contrast, the positive strand spans only ~ 2/3 of the genome in length, being its 3’-end is variable in size [Lutwick et al. 1977; Summers et al. 1975) . The viral polymerase is covalently bound to the negative strand by a phosphotyrosine bond. At the 5’-end of the positive strand a short RNA oligomer originating from the pre-genomic (pg) RNA remains residually bound covalently after the viral DNA synthesis. The negative strand, in contrast to the positive strand, contains on both the 5’-end and the 3’- end a small redundancy of 8-9 nucleotides in length, named the R-region. These redundant structures are essential for viral replication [Seeger et al. 1986; Will et al 1987; Lien et al. 1986]. The viral genome covers four open reading frames, all of them encoded by the negative strand, with 6 start codons, four promoters, two transcription enhancing elements, a poly-adenylation signal motif, and a number of signals for DNA replication.
ε PreC/C(pregenomic mRNA X PreS2/S Pre S1 P o li A A A DR1 DR2 X C preC Pre S1 Pre S2 S P HBV 3,2kb 2114 948 549 2902 318 2 3096 3117 2658 407
8
Fig 2- HBV genome organisation
The major RNA transcripts are polyadenylated, capped and named pre-C/C, preS, and S mRNAs [Enders et al., 1985; Cattaneo et al., 1984]. Moreover, a 0.7 kb long mRNA termed X mRNA occurs occasionally. The 3’-end of all HBV transcripts is common for all of them and created by the polyadenylation signal in the core (C) gene.
1.1.2.a S gene/HBsAg
The S gene encodes for the three distinct but related surface proteins termed S, M and L by a single open reading frame referred as ORF-E. This ORF is 389 or 400 codons in length depending on viral subtype and consists of three 5′ in-phase ATG codons for the initiation of translation and one 3′ TAA termination codon. Thus, the three HBV surface proteins only differ by the length of their N-terminal domains and are essential for envelopment of nucleocapsids. All three envelope components are glycosylated, type II transmembrane proteins, that can form multimers stabilized by disulfide bridges formed by cysteine residues present in the S domain. The L protein is characterized by the addition of a 108 to 119 residue sequence named “PreS1” on the N-terminus of M. Thus, this large protein basically incorporates the preS domain (preS1 and preS2) to the N-terminus of S [Heermann et al. 1984]. Currently, it is clearly recognized that L plays a specific role in the viral cycle: recruitment of a mature viral nucleocapsid for virion budding [Bruss, 2007] and recognition of the cellular (co-)receptor(s) for virus entry [Glebe and Urban, 2007], respectively. The 226 aa S protein traverses the membrane at least twice with transmembrane region 1 (TM1) and TM2 and is produced at the rough endoplasmic reticulum (ER) [Bruss, 2007]. The biosynthesis of the 281 aa M protein is
9 quite similar to S and has a similar topology. This protein differs from S by the N-terminal addition of a 55 residue sequence named “PreS2”. However, the exact role of M in the viral cycle remains unclear. Indeed, its in vivo absence in infected cells does not disrupt viral morphogenesis or particle functionality [Fernholz et al., 1991]. Thereby, this protein seems not to be essential for virus spread and its complete absence from the
Avihepadnavirus genomes reinforces this hypothesis.
S, L, and M proteins are all found as components of the Dane particles. However, the surface proteins are not only incorporated into virion envelopes but also form subviral spherical particles without nucleocapsids. These particles assemble at a pre-Golgi membrane [Huovila et al., 1992] together with lipid, have a diameter of 20 nm, and are spherical or filamentous in shape (fig.3). The Large surface protein is an essential component of both virions and filaments and represents 10% of their envelope proteins. In contrast, it represents only 1% of the 20 nm spherical particles. The M protein is present in equal amounts in Dane particles and filaments and constitutes 10% of the 20 nm spherical particles. S, by itself, is an essential component of virions, filaments and spheres (70-89%). Subviral HBsAg particles exceed virions by a variable factor of 102– 105 and can accumulate up to concentrations of several hundred micrograms per milliliter of serum in the blood of HBV-infected patients [Seeger et al., 2000].
Fig. 3 – Morphology of HBV particles, HBs filaments and HBs spheres - [adapted from: Molecular
Biology of Hepatitis B virus- Heermann KH and Gerlich WH- CRC press (1991)]
10 In addition to the serum, HBsAg can be detected in the infected hepatocytes with
different expression patterns according to the different phases of infection. It has been shown that there is membranous staining of HBsAg associated with variable degrees of cytoplasmic staining of HBsAg during the phase of active hepatitis B virus replication and, by the contrast, solely cytoplasmic staining of HBsAg during the non-replicative phase [Gudat et al., 1975; Ray et al., 1976; Montano et al., 1982]. Membranous staining of HBsAg on the hepatocyte correlated excellently with serum HBV-DNA and could be recognised as a marker of active hepatitis B virus replication [Chu et al., 1995].
1.1.2.b PreC/C gene/ HBeAg, HBcAg
The PreC/C ORF contains two in-frame translation initiation signals separated by 28 codons, thus encoding both precore protein, precursor for the viral e antigen (HBeAg), and Hepatitis B virus core antigen (HBcAg) [Uy et al., 1985; Seeger et al., 1986]. Synthesis of precore protein is initiated from the first ATG and core protein from the second at positions 1814 and 1901 respectively. The precore protein therefore initially contains all of the core protein sequence plus 29 amino acids at its N-terminus. These constitute a signal peptide that directs the nascent chain to the endoplasmic reticulum and the secretion pathway.
The first 19 amino acids are cleaved off and during transport to the cell surface the protein is further matured by removal of the highly basic C-terminal tail. Production and secretion are modulated at both transcriptional [Okamoto et al., 1994; Laskus et al., 1994] and translational [Brunetto et al, 1989; Carman et al., 1989; Okamoto et al., 1990] levels and the protein is released as a soluble antigen, HBeAg [Standring et al., 1988]. HBeAg is not a structural component of the virion, it is not required for viral replication, however its secretion is conserved in both Orthohepadnaviruses and Avihepadnaviruses
11 and its synthesis is tightly regulate at transcriptional and translational levels. This it is
supposed to be due to an immune-regualtory function promoting virus persistence by inducing neonatal tolerance and modulating the immune-response in adults [Chang et al., 1987; Chen et al., 1992, Milich et al., 1997]. The core protein which itself can be phosphorylated by several kinases, is essential for the formation of nucleocapsids. It plays an active role in binding and packaging of the pregenomic RNA, recruitment of the viral polymerase, and thus enables the RT-polymerase/RNA complex to initiate reverse transcription within the newly forming nucleocapsids [Lan et al., 1999; Gerlich et al., 1982 1982; Watts et al., 2002]. Although HBcAg and HBeAg show substantial amino acid sequence homology, they are serologically distinct, and the immune responses to these antigens appear to be regulated independently. HBcAg is highly immunogenic (0,025 mg of HBcAg elicit antibodies production) and functions as both cell independent and T-cell dependent antigen. Immunization with HBcAg preferentially primes Th1 T-cells; and HBcAg-specific Th cells mediate anti-envelope as well as anti-HBc antibodies
production.
HBcAg is a major target of CTL response. High levels of soluble anti-HBc, as observed in most of HBV infected individuals, may compete with B cells Ig receptor mediated uptake of HBcAg with inhibition of TH cell activation. The immune response to HBeAg is strictly T cell-dependent [ Milich et al., 1986] and HBeAg preferentially, but not exclusively, elicits Th0 or Th2-like cells which stimulate the humoral immune reaction [Milich et al., 1997]. In particular, HBeAg-specific Th2 cells may cross-regulate HBcAg-specific Th1 cells or the secreted HBeAg may preferentially behave as a tolerogen and inactivate HBcAg-specific T cells through deletion or clonal anergy in the periphery [Chen et al., 2005; Milich, 1997; Milich et al., 1998]. T-cell anergy is a tolerance mechanism in which the T cell is functionally inactivated following an initial antigen encounter but remains alive in a hypoactivated state.
1.1.2.c P gene/Polymerase
The P ORF, covering nearly 80% of the hepadnaviral genome (1685 nt), encodes a multifunctional protein including the terminal protein (TP) that acts as a primer for HBV
12 DNA synthesis and the viral polymerase that possesses DNA polymerase, reverse transcriptase (RT) and RNaseH activities. During replication, a pre-genomic RNA is produced that encodes for both HBcAg and polymerase [Nassal et al. 1996; Nassal 1999]. Polymerase is the second ORF on this messenger RNA (mRNA) and partially overlaps with the 3’ end of the HBcAg cistron. The HBV polymerase is not proteolytically cleaved to mature enzymatically active proteins, but consists of 4 domains [Lanford et al. 1999]: a TP domain, which becomes covalently linked to negative-strand DNA during initiation of reverse transcription [Weber e al. 1994; Zoulim et al. 1994] a spacer domain, which is very tolerant to mutations and can be partially deleted without affecting polymerase activity [Li et al. 1991; Radziwill et al. 1990; Kim et al. 1999]; the reverse transcriptase/polymerase (RT domain), which contains the conserved regions A through F, characteristic of RNA-dependent RNA polymerase (RdRP) and RNA-dependent DNA polymerase (RdDP) [Poch et al. 1989; Lesburg et al. 1999]; and the ribonuclease H domain (RH domain)[Wei et al. 1996].
1.1.2.d X gene/X protein
The X ORF is located downstream to enhancer 1 (Enh I) and is partly overlapped by the P ORF at its N terminus and by the PreC/C ORF at its C terminus [Tiollais et al. 1985]. Furthermore, the X ORF is overlapped by several cis-elements including enhancer II (Enh II) [Yee, 1989], several cis-elements for transcriptional regulation, and the PreC-C promoter. The X gene is transcribed independently of the other viral transcripts and a separate X mRNA of 0.8 kb has been detected in liver tissues of both human and woodchuck [Kaneko et al.,1988; Guo et al., 1991] as well as in transgenic mice [Kim et al., 1991]. So far, the role of the X protein is not fully understood, indeed, although HBx does not bind DNA, the first activity identified for this viral protein was the ability to activate transcription of viral and cellular genes [Twu et al., 1987]. HBx is a weak transactivator, but it is capable to activate a variety of cellular and viral promoters. This broad spectrum of activities relies on two different mechanisms: either direct interaction with nuclear transcriptional regulators, or activation of signal transduction pathways [Wei et al., 2010]. HBx has also been implicated in pleiotropic activities such as cell cycle
13 regulation, activation of signaling pathways, modulation of apoptotic pathways, and
inhibition of DNA repair [Andrisani et al. 1999; Bouchard et al., 2004; Tang et al. 2006;].
1.1.3 HBV life cycle
Hepatocytes are the primary site of viral DNA replication. It is assumed that viral entry and the host range of hepadnavirus is dependent on the N-terminus of the large surface antigen [Ishikawa et al., 1995; Chouteau et al., 2001; Lambert et al., 1990; Gripon et al., 2005; Urban et al., 2002]. So far, the intrinsic HBV receptor has not been discovered, but from studies on DHBV in primary duck hepatocytes it is assumed that around 104
receptor molecules per cell mediate the rapid binding, followed by a slow uptake of the virus to the cell which can take up to 16 hours [Pugh et al.,1989; Klingmuller et al.,1993; Pugh et al., 1995]. Following entry the nucleocapsid is transported into the cell nucleus, where the viral nucleic acid is released. Release of the viral DNA and disintegration of the nucleocapsid is assumed to take place at the nuclear core complex [Kann et al., 1997; Rabe et al., 2003].
The life cycle of hepadnaviruses is characterized by the synthesis of a 3-kb partially double-stranded, relaxed-circular DNA (rcDNA) genome by reverse transcription of an RNA intermediate, the pregenome. The mechanism of RNA-directed DNA synthesis has been well characterized [Ganem et al., 1994; Seeger et al., 1996]. After virus penetration the DNA reaches the nucleus and is immediately converted by host enzymes to
complete open circular double-stranded DNA and then to supercoiled DNA (cccDNA). Since cccDNA, which accumulates only in the nucleus, is the template for the
transcription of all viral mRNAs, its formation indicates a successful initiation of infection. The viral RNAs include pregenomic RNA (pgRNA), which serves as the template for reverse transcription, as well as three subgenomic mRNAs necessary for the translation of the envelope proteins and the mRNA for the X protein. The pgRNA is both the
template for core and polymerase protein translation and is the matrix for the progeny genomes. The pgRNA bears a secondary structure - named ε-structure - that is present at both the 5’- and the 3’-ends. The ε-hairpin loops at the 5’-end are first recognized by the viral polymerase and act as the initial packaging signal [Bartenschlager et al., 1992;
14 Hirsch et al., 1990; Huang et al., 1991] (Fig.4). In the cytoplasm, the core protein forms the basis for the nucleocapsid. It plays an active role in binding and packaging of the pregenomic RNA, recruitment of the viral polymerase, and thus enables the RT-polymerase/RNA complex to initiate reverse transcription within the newly forming nucleocapsids. Finally, in the endoplasmic reticuluum, the nucleocapsid acquires the external coat. In the early stages of infection the nucleocapsid is also transported to the nucleus in the hepatocyte to increase cccDNA copies [Nassal et al., 1993; Nassal et al., 2000].
Fig.4 –
HBV-DNA is able to integrate into the host genome. The integration occurs in different sites and usually affects only one part of the viral genome, which retains the ability to be transcribed. The integration of HBV-DNA is an early event in the natural history of
infection and is implicated in the pathogenesis of hepatocellular carcinoma: the
integration within or near cellular genes involved in regulating cell cycle, could result in an alteration of their function promoting in the hepatocytes affected a neoplastic
transformation. 5’ 3’ Epsilon Signal Polymerase 3,5kb 3100 3182 1
15 1.1.4 Viral Heterogeneity
Changes in the viral genomes occur randomly as errors in the replication. These can be nucleotide substitutions (point mutations), deletion or insertions. Usually DNA viruses have a more stable genome than those RNA, because of the proofreading capacity of the host enzyme that they exploit for replication. The Hepadnaviridae genome represent an exception. Although their genome is a double-strand DNA, these viruses replicate through a RNA template which is reverse transcribed by a enzymatic complex that lacks the proofreading capacity. On the other hand, the HBV genome in particular, has a very compact organization and even a single nucleotide substitution may result in pleiotropic effect. For this reason, the number of mutations that can be tolerated without losing infectivity and replication capacity is rather limited. [Miller et al., 1989]. Indeed, any mutant selection is related to its biological efficiency and ability to escape immune pressure, both humoral and cellular, and/or selective pressure exerted by antiviral drugs that directly interfere with viral enzymes. Moreover, in chronic hepadnavirus infections, net virus expansion cannot occur indefinitely. The maximum amount of virus, or viral cccDNA, in the liver is limited by the number of hepatocytes that can be infected and the maximum number of cccDNA copies per hepatocyte. In a fully infected liver, new
cccDNA synthesis is prevented unless uninfected cells are generated by liver growth or cell turnover or unless existing cccDNA molecules are lost and replaced within the cell. Turnover of cells or cccDNA thus provides an opportunity for enrichment of one virus strain over another through competitive growth [Zhang et al., 2000]. This explains why, despite the relatively high mutation rate of HBV (approximately 2 x 10⁴ nucleotide substitutions/site/year), only a small proportion of mutants can survive [Girones et al., 1989].
16
1.1.4.a S Mutations
The envelope proteins of HBV are targets of both humoral and cellular immune response that are involved in viral clearance. Anti-HBs antibodies show neutralizing activity and are essential to limit the spread of the infection. As a consequence, envelope proteins have been used in the prophylaxis of HBV infection for preparation of the vaccines and production of antibodies for therapeutic purposes [Neurath et al., 1986; Vento et al. 1987; Nayersina et al.,1993; Jin et al., 1995]. Some of the envelope mutants determine the different subtypes of HBV and may have been selected over centuries perhaps under HLA pressure.
In recent years, many variants have been identified, whose mutations produce changes in the epitopes recognized by the current diagnostic assays and determine the
undetectability of the variant by some of the commercially available HBsAg assays [Carman et al., 1995; Carman et al., 1997]. Most frequently, point mutations occur in the area of the “a” determinant (124-147 aa), and also the immune response induced by recombinant vaccines that are current available seems to focus on this region as target. The first “vaccine escape mutant” described [Carman et al., 1990] was substitution of a Gly residue at position 145 by an Arg residue (G145R), which has been identified also in chronic carriers [Carman et al., 1990]. Many other substitutions in the “a” determinant (I/T126A/N, A128V, Q129H/R, G130N, M133L/T, K141E, D144A/H) have since been associated with immune escape [Cooreman et al., 2001], but G145R is by far the most common variant. Immune escape mutants with substitutions outside of the “a”
determinant have also been described [Oon et al., 1999], the most important of which is P120S/T and the loss of cysteine 124 abolishing HBsAg secretion in a HBsAg
negative/HBV-DNA positive patient. The other medical condition associated with the emergence of envelope variants is treatment with monoclonal antibodies or
hyperimmune human immunoglobulin (HBIG) which is used to prevent HBV recurrence in patients transplanted for HBsAg- positive cirrhosis. Similar to vaccine recipients, a glycine/arginine substitution at position 145 and aspartic acid/alanine at aa 144, are the most common variants found in these cases [Carman et a., 1996]. Another mutant
17 described in a HBsAg negative/HBV-DNA positive patient was the loss of cysteine 124, abolishing HBsAg secretion.
Many mutations affect the PreS domains of the envelope proteins, most of which are deletions [Kay et al., 2007]. PreS mutants emerge in chronic infections, often in patients treated with interferon [Gerner et al., 1998; Santantonio et al., 1992], and probably represent attempts by the virus to evade host immune responses. The emergence of pre-S mutants could play a role in viral persistence; however, their implication in the pathogenesis of liver damage cannot be excluded [Brunetto et al. 1999]. The region of the S gene coding the PreS1 and PreS2 domains is overlapped by the region of the P gene coding the spacer domain of the viral polymerase. This domain gives flexibility to the viral polymerase, but its sequence is not absolute and can suffer in-phase deletions and insertions without affecting the enzymatic activities of the protein. However, there are constraints on PreS1 mutations due to the fact that its N-terminus (residues 21–47 of the genotype D PreS1) is important in viral attachment to hepatocytes [Neurath et al., 1986] and the S promoter is located in the 3’ extremity of the PreS1 coding region. In addition, some mutations can result in intracellular retention of the PreS1 protein [Bock et al., 1997; Melegari et al., 1994] which inhibits virion secretion and is cytotoxic. As a result, although PreS1 deletion mutants are replication competent, they usually need a helper virus and are found as minor viral populations. On the other hand, there appear to be few constraints on PreS2 mutations since its product is not essential for viral
replication, particle morphogenesis and secretion and infectivity [Fernholz et al., 1991]. Mutations include deletion or missense mutation of the PreS2 ATG, thereby abrogating synthesis of the protein, and deletions or alterations of B- and T-cell epitopes. HLA class I-restricted, cytotoxic T cells recognize short viral peptides that are generated by the intracellular processing of endogenously synthesized viral antigens within infected cells, and are expressed at the cell surface in the binding groove of selected HLA class I molecules. Single amino acid substitutions of MHC anchor residues or TCR contact sites have been shown to abrogate CTL responses in vitro by inhibiting either HLA binding or TCR recognition of the peptide. The most common mutation affecting the PreS2 region involves the first part in which is MHC class I-restricted T-cell epitope [Bertoletti et al, 1994; Chisari et al., 1995; Sobotta et al., 2000; Fan et al., 2001;]. An association between pre-S2 mutant (start codon mutants preventing pre-S2 protein synthesis) infection and fulminant hepatitis has been described, and a direct role of these variants in the induction (via an abnormal immune response or a direct cytopatic effect) of severe
18 liver damage has been hypothesized [Pollicino et al., 1997]. Mutations in the S gene may lead to different histological liver features. Glassy or ground glass hepatocytes (GGH) ultrastructurally are characterized by an abundance of smooth endoplasmic reticulum (ER), among which HBsAg is accumulated and are different in morphology and distribution at different replicative stages of chronic HBV infection [Hadziyannis et al., 1973] . Recently, intracellular study have revealed that ground glass hepatocyte may contain specific mutants and exhibit differential biological activities [Wang et al., 2003; Su et a., 2008]. Type I GGHs expressed an inclusion- like pattern of hepatitis B surface antigens and harbored mutants with deletions over pre-S1 region, whereas type II GGHs, distributed in clusters and emerged at late replicative phase, contained mutants with deletions over pre-S2 region that defines a cytotoxic T lymphocyte (CTL) immune epitope, and may represent an immune escape mutant.
1.1.4.b PreC/C Mutations: HBeAg defective Mutants
During chronic HBV infection, two major types of HBV core gene variants frequently occur that affect the expression of HBeAg: the PreCore (PC) mutants and the basal core promoter (BCP) mutants.
As described above, the secretion of the antigen "e" depends on the expression of a specific leader peptide which is encoded by HBV pre-core. In 1989 two independent studies performed in anti-HBe positive patients of the Mediterranean area showed that the most frequent cause of the discrepancy between the presence of HBV DNA and the absence of HBeAg was the infection with HBV variants unable to secrete the soluble form of the HBV nucleocapsidic protein (HBeAg minus mutant)[Brunetto et al, 1989; Carman et al., 1989]. The HBeAg production and secretion are modulated both at the transcriptional [Okamoto et al. 1994; Laskus et al., 1994, Jaw et al., 1991] and
translational levels [Brunetto et al., 1989, A; Carman et al., 1989, Okamoto et al., 1990, Raimondo et al., 1990; Brunetto et al., 1999]. The most prevalent PC mutation that affect the HBeAg expression at the translational level, is a guanine to adenine transition at nucleotide position 1896 (G1896A), which creates a TAG stop codon at codon 28 of the
19 PC protein [Brunetto et al., 1989; Carman et al, 1989; Raimondo et al., 1990; Ganem et al., 2001](fig 5 ).
- Fig. 5 Nucleotide composition of epsilon signal
However, this mutation is located within the epsilon (ε) structure, a highly conserved stem-loop essential for initiation of encapsidation within the viral replication cycle. In order to stabilize this ε structure, the nucleotide at position 1896 is paired with the nucleotide at position 1858, which naturally is a thymidine (T) in genotypes B, C, D, E, and G and a cytidine (C) in genotype A. Therefore, in HBV genotype A, the G1896A mutation usually arises together with a C1858T nucleotide exchange [Lok et al., 1994; Rodriguez-Frias et al., 1995]. These HBV mutant, termed HBeAg minus or defective is predominant, in the mediterranean area, in 90% of HBV chronic carriers anti-HBe
A U C C U G U A C U U G U A U G G G G C A U G G A C A U 5’ 3’ C C U U G G G G G C U U C G A A C C U C C G A A U U G U G C U C U G U
Core translation start codon
1896 NUCLEOTIDE : the mutation from G to A is responsible for the variant HBeAg minus
A U C C U G U A C U U G U A U G G G G C A U G G A C A U 5’ 3’ C C U U G G G G G C U U C G A A C C U C C G A A U U G U G C U C U G U
Core translation start codon
1896 NUCLEOTIDE : the mutation from G to A is responsible for the variant HBeAg minus
20 positive [Brunetto et al, 1989; Raimondo et al., 1990; Kojima et al., 1991; Santantonio et al., 1992; Tong et al, 1992]. As previously shown, wild-type and HBeAg minus HBV may coexist in a HBV carrier and their relative ratio vary over time [Brunetto et al., 1991; Brunetto et al., 1993; Brunetto et al., 1994; Brunetto et al., 1994b; Brunetto et al., 1997]. Furthermore, as discussed later, follow-up studies suggested the important association between different ratios of circulating wild type and HBeAg minus HBV and pathogenetic events during the course of chronic hepatitis B [Brunetto et al., 1994; Brunetto et al., 1997]. In vitro experiment showed that the precore region and pgRNA transcription are under control of regulatory elements such as the Basic Core Promoter (BCP) and the Core Upstream Regulatory Sequence (CURS) [Yuh et al., 1992]. Mutations in these domains appear to affect mRNA transcription, notably by decreasing the synthesis of HBeAg [Okamoto et al., 1994]. Cytokines, such as tumor necrosis factor alpha (TNF-) and interferons alpha and gamma (IFN- and γ), held the transcription inhibitory activity by acting directly on BCP [Romero et al., 1996].
Other mutations that act at translational level are a thymine (T) instead of a cytosine (C) at nucleotide 1817 and an A instead of a G to 1897, both of which give rise to
translational stop codons. Two mutations were also observed: G⇨T and T⇨C in in position 1816 and 1815 respectively, responsible for the elimination of translation start codon of the pre-core region. All these mutations leads to the same result: a defetive virus of “e” antigen [Brunetto et al, 1989; Carman et al., 1989 Santantonio et al., 1992; Tong et al, 1992].
The most common BCP mutation is the double A1762T and G1764A nucleotide
exchange, which results in a decrease of HBeAg expression of up to 70% but enhanced viral genome replication [Buckwold et al., 1996; Hunt et al., 2000; Locarnini et al., 2003]. Moreover, considering the regulatory activity of these region, carriers infected with HBV with the BCP mutations resulting in gene deregulation, may be at increased risk for hepatocellular carcinoma [Lee, 1997].
21
1.1.4.c P Mutations
Mutations in the P gene especially occur following prolonged treatment with drugs interfering with that acting on polymerase activity, nucleos(t)ide analogues in particular. Resistant mutants developed under treatment, showed changes in conserved patterns or domains essential for viral DNA replication. Polymerase domain are A, B, C, D, E and B, C, D are the most affected by mutations. The first resistant mutants have been identified in domain C, where the amino acid methionine (M) at position 204 (numbering according to the nomenclature proposed in 2001 by Stuyver et al.) is replaced by valine (V) or isoleucine (I) , rtM204V or I [Tisdale et al., 1993, Ling et al., 1996, Perillo et al., 1996; Bartholomeusz et al., 1997, Carman, 1997; Locarnini, 1998]. These mutations were first identified in patients undergoing lamivudine treatment, where appeared frequently associated with compensatory mutations (or rtL80V I rtV173L, rtL180M or C) increase either replication efficiency or antiviral resistence [Delaney et al. 2003; Nakanishi et al. 2005; Pai et al. 2005, Warner et al. 2007]. The mutation rtN236T is a primary mutations in the D domain that has been associated with resistance to Adefovir and Tenofovir [Angus et al. 2003]. Another primary mutation able to determine resistance to Adefovir and Tenofovir is located in the B domain and is rtA181V or T or S [Fung et al. 2005; Moriconi et al., 2007]. In addition, many other mutations have been associated with reduced susceptibility: rtV84M rtS85A in the A, rtP237H rtN238T or D in the D domain and rtV214A, rtQ215S in between C and D domains. Drugs that require the
development of multiple mutations in the Pol gene to show restitance are defined with “high genetic barrier”. Patients that show simultaneously rtM204I o V and rtL180M develop resistance to entecavir if one of the following mutations is added: rtI169T, rtT184G, rtS202I, rtM250V [Tenney et al. 2004].
22
1.1.4.d X Mutations
Mutations in the X region may involve replication regulatory elements such as core promoter (CP) and enhancer II: three AT-rich regions are present in CP, each of them would represent an independent binding site for liver-enriched factors for initiating the transcription of the different 3.5 mRNAs [Lopez-Cabrera et al., 1990]. CP mutations are located most frequently in the second AT-rich region (1762 A to T switch and 1764 G to A switch); occasionally, point mutations have been described in the first AT-rich region, whereas no mutations have been observed in the third region, which could induce a decrease in the transcription of genomic mRNA [Okamoto et al., 1994; Sato et al. , 1995]. In fact, it has been shown that point mutations in the TATA box of eukaryotic promoters drastically decrease in vitro transcription, and mutations in the AT region of viral promoters should have similar effects [Corden et al., 1980].
1.1.5.e Genotype and Geographical distribution
Genotypes or genetic subtypes are genetically related strains and have been described for viruses belonging to several different families. Four genotypes, A–D, of HBV, originally designated as genomic groups, were based on > 8% intergenotype and <4% intragenotype divergences, when 18 complete genomes were compared [Okamoto et al. , 1988]. Later research has identified other four HBV genotypes, E–H [Norder et al., 1992; Norder et al. 1994; Naumann et al 1993; Stuyver at al. 2000; Arauz-Ruiz et al. 2002]. Two genotypes, A and F, have been further subdivided into subgenotypes identified by arabic numerals [Kramvis et al., 2002; Kimbi et al. 2004, Norder et al. 2003]. The eight genotypes identified to date, are distributed in different geographical areas. Genotype A is present in North Europe and North America, genotypes B and C are typical of the East Asian countries, genotype D is spread all over in the world but mainly in the mediterranean area, genotype E is most common in Africa, F and H are endemic
23 of South and Central America respectively, finally genotype G was firstly isolated in France but is rare and always found in coinfection with other genotypes (mainly A). HBV genotypes may influence the course of disease and among these relevant biological differences has been recognised. The classical precore (PC) mutation, located at HBV nucleotide 1896 consisting of a G-A substitution that creates a stop codon, is not found in genotype A. Genotype A (and F2) contains a cytosine at position 1858 instead of a uracil, that stabilizes the PC loop, not allowing the 1896 G-A PC mutation to occur [Li et al., 1993]. Indeed, the HBV genotypes B, C, D and E are predisposed to develop the mutation at 1896 PreCore, which will result in an earlier seroconversion to anti-HBe. Genotype A (presumably A2) infection was associated with a significantly higher cumulative rate of sustained biochemical remission, HBV DNA clearance, and HBsAg clearance in patients with chronic HBV infection than genotype D infection [Sanchez-Tapias et al., 2002]. Multiple studies have shown that patients with genotype C experience HBeAg seroconversion at an older age and are more likely to be HBeAg positive at any given age than HBV genotype B [Chen et al., 2004; Kao et al., 2002; Kao et al., 2004]. HBV genotype C is associated with an increase risk of liver inflammation, flares of hepatitis, liver fibrosis, and cirrhosis. Persons infected with genotype D usually convert from HBeAg to anti-HBe in adolescence or early adulthood. The Pre Core mutant is frequently associated with HBV seroconversion in this genotype. While it appears that many persons go into and remain in the inactive carrier phase, some persons develop HBeAg-negative/anti-HBepositive chronic hepatitis B. This can lead to cirrhosis and HCC [Naoumov et al., 1992; Grandjacques et al., 2000; Hadziyannis et al., 2001; Brunetto et al., 2002; McMahon, 2005; Zacharakis et al.,2005]. Genotype F is divided into four subtypes: F1–F4 [Devesa et al., 2008]. Genotype F2 codes for C at position 1858 and therefore PC mutation does not occur, whereas F1 does not and thus PC mutation can occur [Schaefer, 2005].
1.2 Hepatitis B virus infection and disease
HBV can cause a transient or chronic liver disease. The transient or acute infection may be mild and asymptomatic or causing an acute hepatitis with varying degrees of severity to result in 0.5% of patients with fulminant hepatitis. There is no evidence that HBV is
24 directly cytopathic for the infected hepatocyte [Guidotti et al., 1995; Chisari et al., 2000; Guidotti et al., 2006]. Therefore, hepatocellular damage is believed to be induced by the host immune reaction. Correlative clinical studies show that in acute, self-limited
hepatitis B, strong T-cell responses to many HBV antigens are readily demonstrable in the peripheral blood [Chisari et al., 1995]. These responses involve both
major-histocompatibility-complex (MHC) class II–restricted, CD4+ helper T cells and MHC class I–restricted, CD8+ cytotoxic T lymphocytes. By contrast, in chronic carriers of HBV, such virus-specific T-cell responses are greatly attenuated, at least as assayed in cells from the peripheral blood. It has been show that the resolution of infection occurs through the coordinated activity of cytokines (INF g and TNF a) released by lymphocytes and the cytolitic response that leads to infected hepatocytes elimination [Ando et al., 1994; Guidotti et al., 1994a; Guidotti et al., 1994b; Guidotti et al., 1996; Guidotti et al., 1999a; Guidotti et al., 1999b; Guidotti et al., 2000; Kakimi et al., 2001; Tsui et al., 1995]. The natural history of chronic HBV infection develops over decades, the subject is often infected at birth or early in life and keeps for several years a state of tolerance or weak activation during which the level of liver damage is minimal compared to high replication. Indeed, it is assumed that an “immune-tolerant” conditions it is established in those cases in which the host immune system is compromised or does not recognise the viral antigens (i.e., if the exposition to the virus occurs during the intrauterine life) [Milich et al., 1990]. This condition is common in childrens borned from HBeAg-positive mothers and infected with HBV in the perinatal period [Lee et al., 1990; Bortolotti et al., 1990; Moyes et al., 1993]. In this case, the exposure during pregnancy to circulating HBeAg promotes a tolerance state towards viral nucleocapsid antigens (HBcAg and HBeAg), which is the main target of cell-mediated response. The immune-tolerant phase can last for a few years to more than 30 years [Hui et al., 2007]. During this phase, the markers of infection (HBsAg and anti-HBc) and replication (HBeAg and HBV-DNA), are present in the sera of infected individuals whereas are absent those of virus-induced damage (IgM anti-HBc ). In the liver there is either no or minimal liver inflammation or fibrosis, a high percentage of hepatocytes express hepatitis B core antigen, predominantly in the nuclei, while HBsAg show an extensive membranous staining.
Once the viral antigens are recognised by the immune system, the attempt to control the infection through the block of viral replication (cytokine-mediated) and infected
hepatocytes elimination (cell-mediated) begins. Liver infiltration by lymphocytes,
25 “immune-activation”, can persist for years with alternating phases of exacerbation and remission. In the serum are present markers of viral replication, with typical fluctuations in viremia levels, of liver damage and of virus-induced liver damage [Brunetto et al., 2001]. In the liver the expression of HBcAg appears to be focal in the nucleic or
cytoplasmatic whereas HBsAg stains mainly in the cytoplasm either in perinuclear blush to a dense signal corresponding to ground-glass cells. Most frequently, the immune activation leads to an inactive hepatitis B phase, characterized by the absence of HBeAg and the presence of anti-HBe, normal ALT levels, low HBV DNA levels (<2000 IU/ml), and absence or minimal liver fibrosis and inflammation [De Franchis et al., 1993;
Martinot-Peignoux et al., 2002; Zacharakis et al., 2005]. However, a signifcant proportion of patients, after seroconversion, retain evidence of viral replication and virus-induced liver damage. This condition is tipically associated with the prevalence of a viral
population unable to secrete the HBeAg [Bonino et al., 1981; Bonino et al., 1986; Brunetto et al., 1989b; Ulrich et al., 1990; Bonino et al., 1991; Brunetto et al., 1991; Bortolotti et al., 1993; Brunetto et al., 1994; Hadzyannis, 1995; Brunetto et al., 1997; Brunetto et al., 2001; Brunetto et al., 2002]. This HBeAg defective mutant has been demonstrated during the exacerbation of the immune elimination phenomena preceding HBeAg seroconversion to anti-HBe, becoming the majoritary viral population in the HBe negative/anti-HBe positive chronic hepatitis B, which is prevalent in patients infected with genotype D of HBV in the Mediterranean area. The disease caused by HBeAg minus HBV runs usually asymptomatic for three to four decades and reaches the stage of histologic cirrhosis at a median age of about 45 years [Brunetto et al., 2002]. Thereafter cirrhosis progresses to end stage complications in about 25% of patients in about 10 years; recurrent hepatitis B exacerbations accelerate disease progression [Brunetto et al., 2002].
Hepatitis B “e “antigen (HBeAg)-negative Hepatitis B virus (HBV) carriers represents the great majority of cases of serological and clinical standing in many geographical areas, including Europe, having became more prevalent during the last decade because of the aging of the HBV infected population [ Hadziyannis S, Papatheodoridis GV, 2006 ; Zarski JP, Marcellin P et al, 2006]. On the basis of the biochemical and virological profile,
HBeAg-negative carriers can be classified as inactive carriers (normal ALT; HBV-DNA persistently ≤ 2000 IU/mL), with a survival comparable with the noninfected population, at least in Western countries [De Franchis R, Meucci G, Vecchi M et al, 1993 ; Manno M, Camma C, et al, 2004] ; active carriers (AC1) with normal ALT, HBV-DNA levels
26 persistently below 20000 IU/mL and absence of significant liver disease HBV-induced; active carriers (AC) with viremia ≥ 20000 IU/mL independently of ALT values and different stages of liver disease [Brunetto et al, 2010] .
Persistent viral replication is a major cause of chronic liver damage and development of cirrhosis: in a cohort study after a mean follow-up of 10 years about 50% of the patients with chronic hepatitis at baseline developed cirrhosis and persistently detectable HBV DNA was a factor independently associated with disease progression [Brunetto et al., 2002]. Further, cirrhosis development as an end point complication was associated with recurrent hepatitis exacerbations [Brunetto et al., 2002].
Active carriers have a significantly increased risk of life-threatening liver complications such as hepatic decompensation, liver cirrhosis and hepatocellular carcinoma (HCC) [Beasley, 1988]. HBV infection appears to play both an indirect (via liver cirrhosis) and direct role in hepatocellular carcinoma development: the mechanisms of direct HBV oncogenesis are not completely understood, nevertheless either integration of HBV genomic DNA into cellular chromosomes, with disregulation of cellular gene function and transactivating activity of some HBV proteins (such as HBx and HBs truncated forms) had been shown to alter cellular homeostasis.
Antiviral treatments currently available can slow disease progression in case of cirrhosis and lead to the cure of chronic hepatitis in patients with less advanced stage of fibrosis. Several baseline and on-treatment parameters, either virological or related to the phase of HBV infection (viral genotype, HBV-DNA levels, quantitative serum HBsAg levels, etc) can affect the outcome of antiviral treatment and to amend the natural history of HBV-induced liver disease.
1.2.1 Diagnosis of HBV infection
Virological diagnosis and monitoring of hepatitis B virus infection are based on serologic assays detecting specific anti-HBV antibodies, and assays that can detect, quantify or characterize the components of HBV viral particles, such as HBV DNA and various viral antigens. Before the polymerase chain reaction (PCR) revolution, HBV DNA was detected by molecular hybridisation using nucleic acid probes. The sensitivity of these techniques was limited to hundreds of thousands of virions [Bonino et al., 1981; Bonino,
27 1986b]. Now, amplifying a target nucleotide sequence with the most sensitive techniques, can even lead to the detection of viruses in individuals who are negative for other conventional viral markers [Raimondo et al., 2003]. The presence of HBV DNA in peripheral blood is a reliable marker of active HBV replication and reflect the viral activity within the liver. However, the diagnosis of the infection does not necessary imply that the liver is damaged by the virus. As described above, florid virus replication can persist for years without liver damage if the host's immune system does not react against viral antigens [Bonino et al., 1991b; Brunetto et al., 1991b]. Liver disease begins as soon as immunotolerance is lost and the virus infected cells start to be eliminated, therefore hepatitis B represents an injurious way of recovering. Serum IgM anti-HBc are detected in any form of liver disease caused by HBV, independent on the duration of virus infection. Serum anti-HBc IgM are usually detected with high titers during an acute hepatitis B, and with lower titers after the typical flare-ups of alanine aminotransferase (ALT) which occur in chronic hepatitis. These episodes of ALT flare up are preceded by an increase or reappearance of viraemia [Colloredo et al., 1992] followed by rapid decline, whereas the elevation of IgM anti-HBc persist for a longer period due to their extended half life.
HBsAg has been recently shown to represent a new diagnostic tool in the management of HBV infection. HBsAg serum levels vary during chronic hepatitis B infection, becoming lower during the transition from the active to the inactive phase of HBV infection [Nguyen et al 2010; Jaroszewicz et al., 2010; Brunetto et al., 2010]. Recent findings confirm that serum HBV-DNA and HBsAg levels provide complementary information on the status of HBV infection and showed that the single point combined quantification of HBV-DNA (<2000 IU/mL) and HBsAg (<1000 IU/mL) allows the identification of inactive carrier with a very high diagnostic accuracy (94.3%) that is comparable with that of 1-year monthly monitoring [Brunetto et al., 2010]. HBsAg serum levels were shown to correlate with intrahepatic covalently closed circular DNA (cccDNA) levels [Volz et al., 2007] that vary in different patient populations but persist through all phases [Werle-Lapostolle et al, 2004].
28 1.2.2 IL28B polymorphism
Genetic polymorphisms located upstream of IL28B (IFN λ) gene are strongly related to HCV clearance after primary infection and response to Peg-IFN and Ribavirin in chronic HCV (particularly in genotype 1) patients [Honda M, Sakai A, et al, Gastroenterology 2010; Urban TJ, Thompson AJ et al, Hepatology 2010; Thompson AJ, Muir AJ, et al, Gastroenterology 2010; Fischer J, Bohm S et al, Hepatology 2012]. Thus, IL28B polymorphisms are used as genetic markers of the ability of Interferon (IFN) to induce an intracellular antiviral response and are associated with spontaneous and treatment induced HCV clearance, whereas their role in HBV infection is still debated [Sonneveld J.M. et al, 2012; Lampertico P. et al, 2012; Mangia A, 2011].
2. AIM OF THE STUDY
Transition from Active to inactive Chronic HBV infection (defined as HBV-DNA persistently < 2000 IU/ml) and HBsAg clearance are associated with better clinical outcomes. Both conditions can be achieved either spontaneously or after antiviral therapy.
Aim of our study was to analyse in a large cohort HBV carriers the correlations between IL28B polymorphism (rs 12979860; CC alleles vs CT and TT alleles) and virologic and clinical profiles, the natural course of HBV infection and the response to antiviral treatment (IFN +/- NA).
29
3. PATIENTS AND METHODS
3.1 Patients
We studied 525 consecutive chronic HBV carriers (333 males and 192 females; mean age 47.3 years, range 18-86 years), admitted to the Liver Unit of the University Hospital of Pisa since 1998 and followed-up prospectively for a median time of 45.2 months (range, 12-136.2 months). The study was approved by the Ethical Committee of our Hospital and patients gave their written informed consents for participate and for use of genetic material in this study.
Inclusion criteria were: HBsAg positive for at least two years; negative for antibodies against hepatitis C virus (HCV), hepatitis D virus, human immunodeficiency virus; absence of autoimmune disease and drug or alcohol abuse (> 40 g ethanol/day).
At the baseline 71 (13.5%) of 525 carriers were HBeAg positive and 454 (86.5%) were HBeAg negative, 462 (88%) of them being infected by genotype D, 60 (11.4%) by others/mixed genotypes and 3 (0.5%) were not characterized for the viral genotype. To define accurately the phase of infection in each carrier, serum tests were performed monthly during the first 12 months of follow-up and every 3 months thereafter. At the end of 1-year monthly monitoring, HBV carriers were classified according to their biochemical and virological profiles as inactive carriers (IC) if serum HBV-DNA levels were persistently ≤ 2000 IU/mL and ALT normal (<40 U/L); as active carriers with low viremia (AC1) if HBV-DNA levels were persistently < 20000 IU/mL and ALT normal; active carriers (AC2) with viremia ≥ 20000 IU/mL independently of ALT values. Quantitative HBsAg was tested in all cases at baseline and at the end of follow-up. Transient elastography became available in our unit on April 2004 and was performed in all newly enrolled patients and in carriers already in follow-up at that time and at least once a year
30 thereafter. Abdominal ultrasound was performed every 12 months in HBV chronic carriers and every 6 months in patients with histological diagnosis or US signs of cirrhosis.
Liver biopsies were obtained from 126 (94 males) of the 332 HBeAg negative/anti-HBe positive individuals in the AC group; it was not performed in the remaining 79 because of: persistently normal ALT and TE values <6 KPa in 42, histological diagnosis of cirrhosis already present in 28, signs of cirrhosis at ultrasound in 53, refuse to perform the biopsy in 4 patients.
During follow-up 156 patients (29 HBeAg positive and 127 HBeAg negative) were treated with interferon nucleos(t) ide analogues (NA): 43 were treated with IFN-2a (Roferon; Roche SpA) 6-9 MU thrice weekly and 113 with Peg-IFN-2a 180 ug/weekly (Pegasys; Roche SpA), 65 of the latter (16 HBeAg positive) received Peg-IFN+NA combination. In treated patients liver biochemistry and HBV-DNA and quantitative HBsAg measurements were performed at 0-12-24-48 weeks during therapy, at the end of treatment and/or at the end of follow-up. Additional samples (week 1-4) were obtained in 42 patients to analyze the kinetics of HBV markers during Peg-IFN therapy.
A blood sample was collected for IL28B polymorphism (SNP rs 12979860) genotyping at baseline or during follow-up.
3.2 Serology and Histology
Serum biochemistry included aspartate-aminotransferase (AST) and alanine-aminotransferase (ALT), γ-glutamyl transpeptidase, alkaline phosphatase, albumin, gammaglobulins, total bilirubin, prothrombin time, α- fetoprotein were assayed by standard procedures. Virological markers such as HBsAg, antibody to hepatitis B surface antigen (anti-HBs), antibody to hepatitis B core antigen (anti-HBc), HBeAg and anti-HBe, antibody to HCV, antibody to hepatitis D virus and antibody to human immunodeficiency virus were detected by commercially available immunoassays (Abbott Laboratories, N Chicago, IL).
IgM anti-HBc levels were determinated by Axsym CORE-M (Abbott Laboratories, N Chicago, IL), using 0.200 and 0.100-0.200 index as cut-off and gray zone of chronic hepatitis respectively.
31 HBsAg was quantified using the Architect HBsAg assay (Abbott Laboratories; dynamic range , 0.05-250.0 IU/mL) after 1:100 dilution. Serum samples with HBsAg levels <0.05 IU/mL at 1:100 dilution were retested undiluted.
Serum HBV-DNA levels were determinated by COBAS Amplicor Monitor 2.0 HBV assay (Roche Diagnostic System Inc, Mannheim, Germany) with a lower limit of detection of 200 copies/mL and linearity range from 200 to 20,000 copies/mL (conversion factor 5,6 copies= 1 IU), until 2005 and thereafter by COBAS TaqMan assay (Roche, sensitivity 12 IU/ml, dynamic range 6-1.10 X 10⁸ IU/mL.
HBV genotyping was performed by direct sequencing of the region encoding for the small hepatitis B surface protein.
Genotyping of single nucleotide polymorphisms (SNP rs 12979860) near interleukin 28B (IL28B) region was performed in whole blood samples from all subjects, by specific Real Time PCR (LightMix, Roche).
Liver specimens were processed using standard criteria; grading of hepatic inflammation and staging of fibrosis were assessed by Ishak score.
3.3 Statistical Analysis
Data were expressed as median and range values. Continuous variables were expressed as mean ± SD or median and range values. The logarithmic transformation was used for quantitative data without normal distribution. Differences between subgroups were analyzed using corrected Chi-square test, Mann-Whitney rank sum test or Kruskal-Wallis test as appropriate. Factors independently associated with HBeAg to anti-HBe seroconversion in HBe Ag positive patient and HBsAg clearance were identified by using logistic regression analysis.
32
4. RESULTS
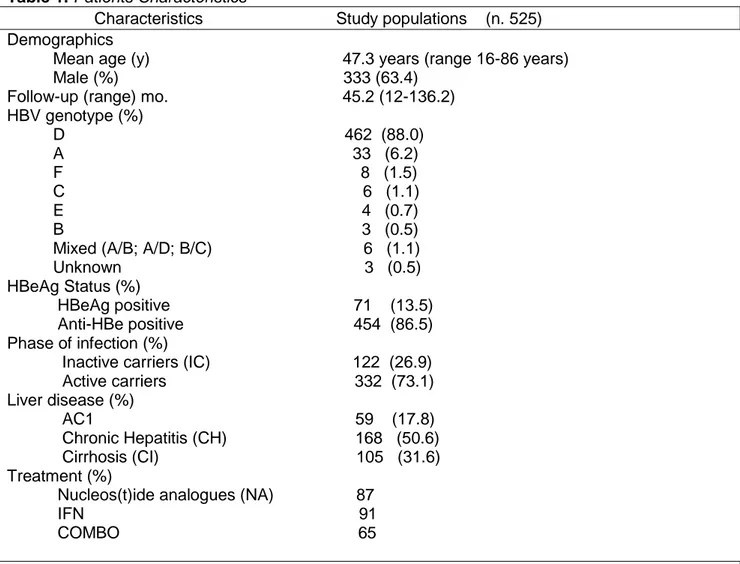
A total of 525 HBsAg carriers was successfully genotyped at rs 12979860 near IL28B gene. Demografic, clinical and virological features of the 525 HBsAg carriers analyzed in the study are summarized in table 1.
Patients were predominantly male of Caucasian origin. All major HBV genotypes were present in the study cohort, with the genotype D (88%) the most prevalent. At the baseline 71 (13.5%) of 525 carriers were HBeAg positive and 454 (86.5%) were HBe negative. According to previous criteria adopted to define the phase of infection, 122 (26.9%) were classified as inactive carriers, 59 (17.8%) were active carriers with HBV-DNA levels < 20000 IU/ml and without significant liver disease (AC1), 168 (50.6%) had chronic active hepatitis and 105 (31.6%) were cirrhotics.
Overall, 156 patients were treated with interferon nucleos(t)ide analogues (NA): 43 were treated with IFN-2a (Roferon; Roche SpA) 6-9 MU thrice weekly and 113 with Peg-IFN-2a 180 ug/weekly (Pegasys; Roche SpA), 65 of the latter received Peg-IFN+NA.
33 Table 1. Patients Characteristics
Characteristics Study populations (n. 525) Demographics
Mean age (y) 47.3 years (range 16-86 years) Male (%) 333 (63.4)
Follow-up (range) mo. 45.2 (12-136.2) HBV genotype (%) D 462 (88.0) A 33 (6.2) F 8 (1.5) C 6 (1.1) E 4 (0.7) B 3 (0.5) Mixed (A/B; A/D; B/C) 6 (1.1) Unknown 3 (0.5) HBeAg Status (%)
HBeAg positive 71 (13.5) Anti-HBe positive 454 (86.5) Phase of infection (%)
Inactive carriers (IC) 122 (26.9) Active carriers 332 (73.1) Liver disease (%) AC1 59 (17.8) Chronic Hepatitis (CH) 168 (50.6) Cirrhosis (CI) 105 (31.6) Treatment (%)
Nucleos(t)ide analogues (NA) 87 IFN 91 COMBO 65
Table 1. Demographic, clinical and virological features of patients analyzed;
- Inactive carriers (IC): persistently serum HBV-DNA levels < 2000 IU/ml and normal ALT (< 40 U/L);
- Active carriers without significant liver disease (AC1): HBV-DNA < 20000 IU/ml;
- Active carriers with Chronic Hepatitis (CH) HBV-DNA ≥ 20000 IU/ml and elevated ALT;
34 4.1 IL28B and baseline features of the patients
In the overall population the prevalence of IL28B was: CC 49.7%, CT 40.4% and TT 9.9%. The CC allele prevalence did not differ in relation to age, gender (males: 49.5%), HBeAg/anti-HBe status (HBeAg pos: CC in 59.2%) and phase of infection (44.3% vs 49.7% in inactive and active carriers) (Fig. 6)
-Fig. 6
Prevalence of IL28B alleles by phase of the infection
CC CT TT 71 454 59.2% 32.4% 8.4% 48.2% 41.6% 10.1% n.s. 44.3% 44.3% 11.4% 49.7% 40.7% 9.6% n.s. 122 332
Not significant differences were observed concerning the distribution of CC allele in genotypes D (CC 52.1%) versus genotypes non-D (CC 53.3%) carriers.
Median HBV-DNA levels at baseline (BL) were 4.46 Log10 IU/ml in CC, 4.40 Log10 in CT and
4.34 in TT carriers (n.s). Median HBsAg levels at baseline were 3.34 Log10 IU/ml, 3.18 Log10
in CT and 3.19 Log10 in TT carriers.
4.1.a Distribution according to disease stage
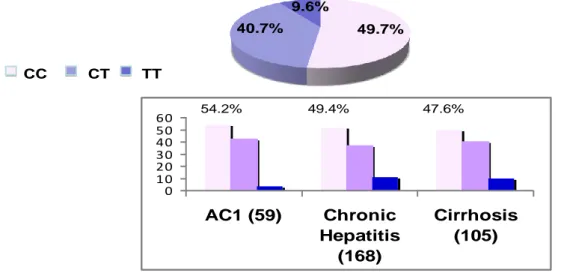
We observed not considerable differences in prevalence of IL28B alleles by severity of liver disease in 332 HBeAg negative active carriers. The prevalence of CC allele in
35 HBsAg carriers with HBV-DNA levels persistently < 20000 IU/ml and without significant liver disease (AC1) was 54.2 %; in patients with active chronic hepatitis 49.4% and in cirrhotics 47.6% (Fig.7)
-Fig. 7
Prevalence of IL28B alleles by severity of liver disease in 332 HBeAg negative active carriers
CC CT TT 49.7% 40.7% 9.6% 0 10 20 30 40 50 60 AC1 (59) Chronic Hepatitis (168) Cirrhosis (105)
AC1 = HBV-DNA < 20,000 IU/ml and normal ALT
54.2% 49.4% 47.6%
4.1.b Distribution according to histology
Liver biopsies were obtained from 126 of the 332 anti-HBe positive individuals in the AC phase. The CC allele prevalence was not statistically different according to the stage of fibrosis assessed by Ishak score (Table 2)
Table 2. Staging of liver fibrosis by Ishak score
C/C C/T T/T Total Staging 0 20 (30.8%) 10 (21.3%) 4 (28.6%) 34 1 15 10 3 28
36 (23.1%) (21.3%) (21.4%) 2 5 (7.7%) 8 (17.0%) 1 (7.1%) 14 3 8 (12.3%) 6 (12.8%) 3 (21.4%) 17 4 4 (6.2%) 4 (8.5%) 0 ( .0%) 8 5 9 (13.8%) 6 (12.8%) 2 (14.3%) 17 6 4 (6.2%) 3 (6.4%) 1 (7.1%) 8 Total 65 47 14 126
4.2 IL28B and spontaneous outcome of infection
Of the 22 HBeAg positive untreated patients 8 (36.3%), had a spontaneous HBeAg/anti-HBeAg seroconversion during a median follow-up of 20 months (range 7-44 m). Not significant differences in the IL28B alleles distribution were observed in such 8 patients who obtained the seroconversion: 5/14 (35.7%) were CC, 2/6 (33.3%) CT and 1/2 (50.0%) TT (Fig. 8)
Of the 122 inactive carriers 14 (11.5%) spontaneously cleared HBsAg: 4/54 (7.4%) CC, 8/54 (14.8%) CT and 2/14 (14.3%) TT during a median follow-up of 31.6 months (range 12-134 m) (Fig. 9).
- Fig. 8
IL28B alleles prevalence and HBeAg to anti-HBe seroconversion in 22 HBeAgHBeAgpositive positive untreateduntreatedpatients
CC CT TT Chi-Square P value HBeAg/anti-HBe seroconversion 5/14 (35.7%) 2/6 (33.3%) 1/2 (50.0%) N.S.
8 patients had HBeAg to anti-HBe seroconversion during a median follow up of 20 months (range 7-44 )
CC CT TT
63.6% 27.3%
37 - Fig. 9
IL28B alleles prevalence and HBsAg loss in 122 HBeAgHBeAgnegative negative inactiveinactive carriers carriers 44.3% 44.3% 11.4% CC CT TT Chi-Square P value HBsAg loss 4/54 (7.4%) 8/54 (14.8%) 2/14 (14.3%) N.S.
14 carriers cleared HBsAg during a median follow up of 31.6 months (range: 12-134 )
CC CT TT
4.3 IL28B and response to IFN treatment
Of the 156 patients who underwent antiviral therapy (IFN +/- NA), 91 were treated with one or more courses of Interferon monotherapy, 65 with combination of INF + NA. Among 156 IFN+/- NA treated pts 29 lost HBsAg: 8 (27.6%) were HBeAg pos (4 CC) and 21 (16.5%) HBeAg neg (7 CC). At the multivariate analysis the only independent factor associated with HBsAg loss was genotype non D (P=0.001) (Fig. 10).
In 29 HBeAg positive treated patients (13 with IFN and 16 with IFN+NA), 16 (55.2%) had HBeAg to anti-HBe seroconversion and 8 (18.3%) cleared HBsAg . Not significant
38 differences in the IL28B alleles distribution were observed in HBV carriers that reached HBeAg to anti-HBe seroconversion (CC 50%) or HBsAg clearance (CC 25%) during antiviral treatment (Fig.12). At the multivariate analysis age, gender, HBeAg status, disease stage, IL28Bp and treatment were not associated with HBsAg loss (Fig.13).
Among 127 HBeAg negative patients 78 were treated with interferon alone and 15 of these (19.2%) lost HBsAg; 49 HBeAg negative patients were treated with COMBO (IFN + NA) and 6/49 (12.3%) cleared HBsAg. At the multivariate analysis the IL28B polymorphisms non one factor (age, gender, genotype and disease stage) was associated with HBsAg lost (Fig. 14-15).
In the soubgroup of 129 genotype D patients treated with IFN +/- NA, 17/129 (13.2%)
cleared HBsAg (35.3% CC): 4/17 (23.5%) HBeAg positive; 13/17 (76.5%) HBeAg negative. At the multivariate analysis no one factor among age, gender, HBeAg status, disease stage, IL28B and treatment was associated with HBsAg clearance (Fig. 11).
- Fig.10
HBsAg Clearance Univariate analysis Multivariate analysis Yes (29 pts) No (127 pts) P OR (95% C.I.) P
Age Median years (range) 43.5 (31-71) 47.0 (17-69) N.S. Gender Males 22 (75.9%) 98 (77.2%) N.S. Genotype D non-D 17 (65.2%) 10 (34.8%) 112 (87.6%) 13 (12.4%) 0.001 0.441 (0.269-0.723) 0.001 HBeAg Positive Negative 8 (27.6%) 21 (72.4%) 21 (16.5%) 106 (83.5%) N.S.
Disease stage Cirrhosis 10 (34.5%) 54 (42.5%) N.S.
IL28B CC(CT/TT vs CC) CT TT 11 (37.9%) 15 (51.7%) 3 (10.3%) 73 (57.5%) 44 (34.6%) 10 (5.7%) 0.160 (0.089) 1.446 (0.928-2.255) 0.103 Treatment IFN IFN + NA 20 (69.0%) 9 (31.0%) 71 (55.9%) 56 (44.1%) N.S.
Factors influencing HBsAg clearance in 156 IFN (+/- NA) treated patients HBsAg clearance in 29 (18%) 29 (18%) pts, median f.u. of 45.2 m (12-136.2)
39 - Fig. 11
HBsAg Clearance Univariate analysis Yes (17 pts) No (112 pts) P
Age Median years (range) 44 (31-71) 47.3 (17-69) N.S. Gender Males 13 (76.5%) 84 (75.0%) N.S. HBeAg Positive Negative 4 (23.5%) 13 (76.5%) 16 (14.3%) 96 (85.7%) N.S.
Disease stage Cirrhosis 5 (29.4%) 50 (44.6%) N.S.
IL28B CC(CT/TT vs CC) CT TT 6 (35.3%) 9 (64.7%) 0 (0.0%) 66 (58.9%) 39 (34.8%) 7 (6.3%) 0.051 Treatment IFN IFN + NA 11 (64.7%) 6 (35.3%) 62 (55.4%) 50 (54.3%) N.S.
Factors influencing HBsAg clearance in 129 Genotype DIFN (+/- NA) treated patients
HBsAg clearance in 17 (13.2%) 17 (13.2%) pts, median f.u. 43.4 m (12-136.2)
40
Response to antiviral treatment in 29 HBeAgHBeAgpositive positive patients
16/29 ( 55.2%)
16/29 ( 55.2%) patientspatientshadhadHBeAgHBeAgtotoantianti--HBeHBeseroconversionseroconversion
8/29 ( 18.3%)
8/29 ( 18.3%) ofofthe the patientspatientsclearedclearedHBsAgHBsAg
CC CT TT Significance P (*) Overall IFN (13 pts) IFN + NA (16 pts) 8/16 (50%) 4/5 (80%) 4/11 (36.4%) 6/11 (54.5%) 2/6 (33.3%) 4/5 (80%) 2/2 (100%) 2/2 (100.0%) 0/0 ( 0%) N.S. N.S. N.S. Overall IFN (13 pts) IFN +NA(16 pts) 4/16 (25%) 2/5 (40.0%) 2/11 (18.2%) 3/11 (27.3%) 2/6 (33.3%) 1/5 (20.0%) 1/2 (50.0%) 1/2 (50.0%) 0/0 ( 0.0%) N.S. N.S. N.S. - Fig. 13
HBsAg Clearance Univariate analysis Yes (8 pts) No (21 pts) P
Age Median years (range) 43.5 (35-59) 40.0 (31-69) N.S. Gender Males 7 (87.5%) 20 (95.2%) N.S. Genotype D 4 (50.0%) 16 (76.2%) N.S.
Disease stage Cirrhosis 1 (12.5%) 5 (23.8%) N.S.
IL28B CC (CT/TT vs CC) CT TT 4 (50.0%) 3 (37.5%) 1 (12.5%) 12 (57.1%) 8 (38.1%) 1 (4.8%) N.S. Treatment IFN IFN + NA 5 (62.5%) 3 (37.5%) 8 (38.1%) 13 (61.9%) N.S.
Factors influencing HBsAg clearance in 29 HBeAgHBeAgpositive positive
IFN (+/- NA) treated patients 8 (27.6%)
8 (27.6%) patientspatientsclearedclearedHBsAgHBsAg
median follow-up: 44.5 months (12-125)