..noi le accenneremo di volo, ma senza che la brevità nuoca all’intento… (Sinibaldi, C., 1802)
2 Università di Bologna
Scuola di Dottorato in Scienze della Terra Ciclo XXII
Coordinatore Prof. Roberto Barbieri
Geological and Structural evolution of the Eurasia Africa plate boundary in the Gulf of Cadiz Central Eastern Atlantic Sea.
Candidato Filippo D’Oriano
Tutore
Prof.ssa Rossella Capozzi
Cotutore Dott. Nevio Zitellini
3
Abstract
Iberia Africa plate boundary, cross, roughly W-E, connecting the eastern Atlantic Ocean from Azores triple junction to the Continental margin of Morocco. Relative movement between the two plate change along the boundary, from transtensive near the Azores archipelago, through trascurrent movement in the middle at the Gloria Fracture Zone, to transpressive in the Gulf of Cadiz area. This study presents the results of geophysical and geological analysis on the plate boundary area offshore Gibraltar. The main topic is to clarify the geodynamic evolution of this area from Oligocene to Quaternary. Recent studies have shown that the new plate boundary is represented by a 600 km long set of aligned, dextral trascurrent faults (the SWIM lineaments) connecting the Gloria fault to the Riff orogene. The western termination of these lineaments crosscuts the Gibraltar accretionary prism and seems to reach the Moroccan continental shelf.
In the past two years newly acquired bathymetric data collected in the Moroccan offshore permit to enlighten the present position of the eastern portion of the plate boundary, previously thought to be a diffuse plate boundary.
The plate boundary evolution, from the onset of compression in the Oligocene to the Late Pliocene activation of trascurrent structures, is not yet well constrained. The review of available seismics lines, gravity and bathymetric data, together with the analysis of new acquired bathymetric and high resolution seismic data offshore Morocco, allows to understand how the deformation acted at lithospheric scale under the compressive regime. Lithospheric folding in the area is suggested, and a new conceptual model is proposed for the propagation of the deformation acting in the brittle crust during this process. Our results show that lithospheric folding, both in oceanic and thinned continental crust, produced large wavelength synclines bounded by short wavelength, top thrust, anticlines. Two of these
4 anticlines are located in the Gulf of Cadiz, and are represented by the Gorringe Ridge and Coral Patch seamounts. Lithospheric folding probably interacted with the Monchique – Madeira hotspot during the 72 Ma to Recent, NNE – SSW transit. Plume related volcanism is for the first time described on top of the Coral Patch seamount, where nine volcanoes are found by means of bathymetric data. 40Ar-39Ar age of 31.4±1.98 Ma are measured from one rock sample of one of these volcanoes. Analysis on biogenic samples show how the Coral Patch act as a starved offshore seamount since the Chattian. We proposed that compression stress formed lithospheric scale structures playing as a reserved lane for the upwelling of mantle material during the hotspot transit. The interaction between lithospheric folding and the hotspot emplacement can be also responsible for the irregularly spacing, and anomalous alignments, of individual islands and seamounts belonging to the Monchique - Madeira hotspot.
5
Riassunto
Il limite di placca tra Iberia e Africa nell’oceano Atlantico centrale si estende dalla giunzione tripla delle Azzorre ad est fino all’ orogene betico-rifano verso ovest. Il regime tettonico lungo il limite di placca varia da transtensivo nei pressi delle Azzorre, trascorrente lungo la zona di frattura Gloria, a compressivo nell’area del Golfo di Cadice. Qui la velocità di convergenza tra le due placche è attualmente di 4 mm/a (DeMets et al. 1994). Negli ultimi anni il Golfo di Cadice è stato interpretato come un limite diffuso di placca. Recentemente è stata scoperta una serie di lineamenti morfologici (lineamenti SWIM, dal progetto europeo che ha acquisito i dati batimetrici che hanno permesso la loro individuazione) attribuiti a strutture trascorrenti che interessano tutto il Golfo di Cadice. Questi sono stati proposti da Zitellini et al. (2009) come costituire il probabile limite di placca tra Iberia e Africa a partire dal Pliocene Superiore (2 Ma). I lineamenti connettono la zona di frattura Gloria con il margine Marocchino e la catena Betico Rifana. Su questo margine, a seguito di una campagna oceanografica avvenuta nel 2008 è stato possibile caratterizzare i lineamenti tramite batimetria ad alta risoluzione e sismica CHIRP. I lineamenti in questo settore si impostano sul prisma di accrezione di Gibilterra, causando evidenti fenomeni gravitativi nella sua parte superficiale.
Uno degli obbiettivi di questa tesi è stato inoltre lo studio delle deformazioni a scala litosferica a partire dall’Oligocene fino ad oggi. La riattivazione di questo margine in regime compressivo è avvenuta a causa della rotazione antioraria di Iberia a partire dall’Oligocene. Tramite lo studio di linee sismiche e dati gravimetrici è stato proposto che a partire dall’Oligocene l’area del Golfo di Cadice sia stata interessata da piegamenti litosferici. Inoltre è stato possibile proporre un nuovo modello concettuale di come si manifestino nella crosta superiore processi legati a piegamento litosferico. Questo modello prevede che si formino
6 sinclinali ad ampia lunghezza d’onda (30 – 140 km) seguite da anticlinali con lunghezze d’onda minori (10 – 80 km).
L’area in esame è stata interessata a partire da 72 Ma dal transito del punto caldo Monchique – Madeira. Numerosi monti sottomarini e piccole colline abissali ne segnano la traccia. In questo lavoro per la prima volta viene descritto in dettaglio uno di questi, il monte sottomarino Coral Patch. Nove edifici vulcanici minori sono stati descritti sulla sua sommità e uno di questi, campionato durante una crociera oceanografica nel 2004, è stato datato a 31 Ma. Inoltre è stato ipotizzato che il magmatismo nell’area abbia interagito con i processi di piegamento litosferico. Questa interazione ha portato ad una distribuzione anomala dei vulcani che spesso, come nel caso del Coral Patch, si allineano lungo le zone di debolezza litosferica causate dai processi tettonici.
7 Table of contents Abstract 3 Riassunto 5 Table of Contents 7 Table of Figures 8 1 Introduction 1.1 Study area 9 1.2 Objectives 11
1.3 Structure of the work 11
2 Data and methodology
2.1 Swath bathymetry 15
2.2 High resolution CHIRP seismic 17
2.3 Seismic reflection data 20
3 Geomorphological and geological setting of the Gulf of Cadiz
3.1 Structural Settings 22
3.2 Main geomorphic features 25
3.3 Gravimetric data 32
3.4 DSDP 35
4 Structural Evolution Eocene-Pleistocene
Paper submitted. 38
5 Recent development of the Eurasia-Africa Plate Boundary Morocco
5.1 Introduction 57
5.2 NEAREST2008 offshore Morocco survey 61
6 Cenozoic magmatic events in the Gulf of Cadiz
Terranova, paper submitted 68
7 Conclusion 85
8 References 87
9 Acknowledgements 93
10 Enclosures
10.1 Plate 1 Morphobathymetric map (Zitellini et al.2009) 10.2 Plate 2 Structural map (modified after Terrina et al….)
8
Table of Figures out of the submitted papers
1.1.1 Central Atlantic Sea 9
1.1.2 Study area 10
1.1.3 Natural Seismicity 11
1.4 The SWIM lineaments 12
2.1.1 NEAREST 2007 Multibeam Survey offshore South Portugal 17 2.3.1 Seismic MCS dataset
2.3.2 Prospective view of the Seine Plain and seismic AR07 line
20 21
3.1.1 Azores Gibraltar Plate boundary 22
3.1.2 Plate kinematics reconstruction 23
3.1.3 Stress map of the study area and structural setting 24
3.2.1 Morpho bathymetric map of the Gulf of Cadiz 25
3.2.2 Seismic line AR06 27
3.2.3 Gorringe Bank shaded relief 28
3.2.4 Slide North side of the Gorringe Bank 29
3.3.1 Free Air Anomaly 32
3.3.2 Bouguer anomaly 33
3.3.3 Crustal density variation 34
3.4.1 Location map of DSDP drilling sites: DSDP 120 and DSDP 135 35
3.4.2 DSDP 120 schematic stratigraphy 36
3.4.3 DSDP 135 schematic stratigraphy 37
5.1.1 Gibraltar accretionary prism 57
5.1.2 NEAREST08 survey offshore Morocco 58
5.1.3 Analog modeling of the SWIM lineaments 59
5.1.4 Al Idrissi mud volcano 60
5.2.1 Landslide zoom on the Moroccan shelf 62
5.2.2 CHIRP line Hyperbole reflection 63
5.2.3 CHIRP line translational domain. 64
5.2.4 Particular of the round scour in the southern margin of the survey 65
9
1 Introduction 1.1 Study area
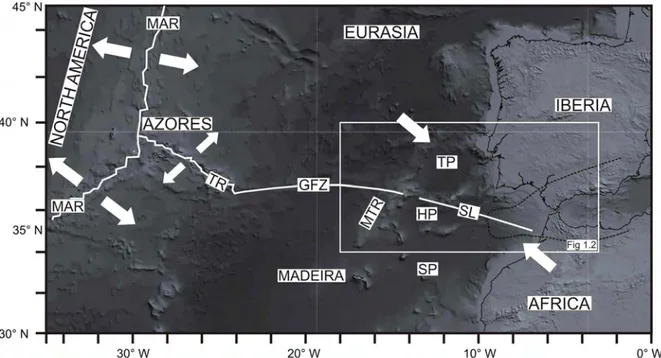
The Gulf of Cadiz is the portion of the Eastern - Central Atlantic bounded by South Iberia and Northwest Morocco (Fig. 1.1.1). Here is located the Eastern end of the Azores-Gibraltar plate boundary. Nowadays, the kinematic of this plate boundary show a progressive change from extension at the Azores, pure right lateral strike slip in the middle at the Gloria trascurrent fault, compression in the Gulf of Cadiz with a relative plate velocity of about 4 mm/a (Argus et al., 1989, DeMets et al., 1994). To the East, the Azores - Gibraltar plate boundary ends against the Gibraltar accretionary prism (Fig. 1.1.2) formed by the westward motion of the Betic – Rif orogenic arc.
Figure 1.1.1 Central Atlantic Sea. MAR: Mid Atlantic Ridge; TR: Terceira Ridge; GFZ: Gloria Fracture Zone; MTR: Madeira Tore Rise; SL: SWIM Lineaments; TP: Tagus abyssal Plain; HP: Horseshoe abyssal Plain; SP: Seine abyssal Plaine; Dashed line; Betic-Rifean Front; White box outlines area of figure 1.2; White arrows indicate relative plate motion along the plate boundaries.
Several huge seamounts are present offshore in the Gulf of Cadiz, as the Gorringe Ridge and the Coral Patch seamounts. Associated to these seamounts are the greatest geoid anomaly in
10 the Atlantic sea with a gravity anomaly of about 400 mGal at the Gorringe and 200 mGal at the Coral Patch (Sandwell and Smith, 1997).
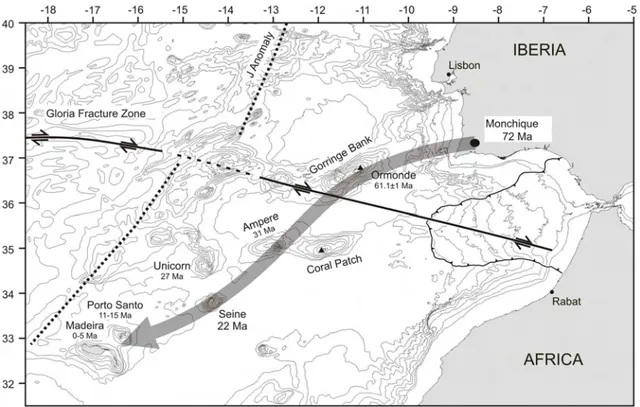
Figure 1.1.2 Study area. Thin solid line, Gibraltar accretionary prism; thick solid line Gloria fracture zone and SWIM lineaments; grey arrow, track of the Monchique – Madeira hotspot.
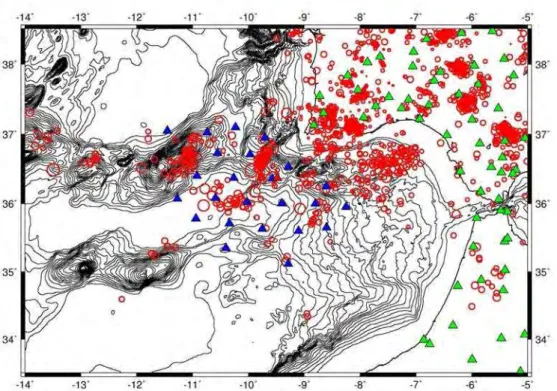
Natural seismicity is heavily concentrated along the Gloria Fracture Zone, while it becomes scattered in the Gulf of Cadiz and Gibraltar region (Fig 1.1.3). In this area the seismicity is located preferentially offshore South Iberia and it is not focused on some particular structures (Grimison and Chen, 1986).
In the last 15 years, this sector of the Eurasia – Africa plate boundary was interpreted as a diffuse plate boundary (Sartori et al., 1994, Hayward, 1996). In particular, Sartori et al. (1994) showed that the compressional deformation is NW-SE trending, and distributed over a wide region. The Gulf of Cadiz is also the source area of several high- magnitude earthquakes, as the 1755 Great Lisbon earthquake with an estimate magnitude of M=8.5 to 8.7 (Martinez-Solares and López Arroyo, 2004). The earthquake was followed by the largest tsunamis ever
11 experienced in the Western Europe Atlantic margin and was observed as far as the Caribbean and North American coasts. In the past twenty years several international project were focused on the area. Thanks to these efforts a huge geophysical and geological dataset was collected.
Figure 1.1.3 Natural seismicity of the Gulf of Cadiz and surrounding area, from August 2007 to April 2008, recorded during the NEAREST project. Blue triangle, OBS station; green triangle, land seismometers station
The Gulf of Cadiz was almost completely mapped by means of high-resolution bathymetry and geophysical seismic data during the ESF SWIM project to constrain the major active structures of the area (Gracia et al., 2003; Zitellini et al., 2004). After the SWIM project new bathymetric compilation is now available (The SWIM multibeam compilation, Zitellini et al., 2009). The SWIM compilation revealed a new set of lineaments, that were called the SWIM
lineaments, cross cutting the Gulf of Cadiz from the eastern termination of the Gloria fault to
the NW Moroccan offshore. Zitellini et al. (2009) proposed this structures to be the recent plate boundary between Iberia and Africa (Fig 1.1.4) and Rosas et al. (2009) showed how, in the last 2 Ma, the deformation was active on these trascurrent structures.
12 Figure 1.1.4 SWIM lineaments cross-cutting Horseshoe Abyssal plain and the Gibraltar accretionary prism. West to East view. Vertical exaggeration 5X.
The Gulf of Cadiz evolution was also influenced by the transit of the Madeira – Monchique hotspot. The track of this hotspot is underlined by a 700 km long, 200 km wide chain of volcanic abyssal hills and seamounts (Fig. 1.1.2). The hotspot volcanism spans in age from the 70-72 Ma at the Monchique volcanic field, in South Portugal, to 14-0 Ma volcanism at Madeira archipelago (Morgan, 1981; Geldmacher et al., 2000). Up to day several aspect of this volcanism are still matter of debate: for example the alignment of seamounts such as the Coral Patch and Ormonde offsets the trace axis (Geldmacher et al., 2005). This anomalous feature of the Monchique – Madeira hotspot track is explained either as related to (1) a volcanism locally controlled by lithospheric discontinuities or (2) magmatism, possibly related to a weak pulsating plume (Merle et al, 2006; Geldmacher et al., 2005). In addiction,
13 the interaction of volcanism with tectonic processes nearby the plate boundary is still not yet well understood because of the scarce information about its submerged part.
1.2 Objectives
Aim of this work is to understand the tectonic processes, at crustal and lithospheric scale, acting in the area from the onset of the counterclockwise rotation of Iberia, during Oligocene, and the consequent reactivation of the Azores Gibraltar plate boundary between Iberia and Africa. The rotation of Iberia caused extension in the Bay of Biscay and the reactivation of a compressive stress regime offshore SW Iberia and in the Gulf of Cadiz. This study intend mainly to enlighten the processes that were active during this compressive stage.
In this work, the interaction between tectonic setting and the alkaline hotspot volcanism belonging to the Madeira – Monchique volcanic province, is also analyzed. This volcanism is present in the area from Late Cretaceous in South Portugal to Recent at the Madeira archipelago.
Furthermore, in this study the deformation associated to the WNW-ESE-oriented dextral strike-slip movement across the Gibraltar accretionary prism in the vicinity of the Moroccan coast is analyzed.
1.3 Structure of the work
This thesis is constituted by seven chapters. After a general introduction on the study area (chapter 1), the principal data and methodology used during this work are shown in chapter 2. Geological and Geomorphological setting of the study area are treated in chapter 3. Chapter 4 presents a paper “submitted to Geology” focused on the mode of deformation acting near the Plate boundary, from Eocene to Pleistocene, while Chapter 5, contains a work on the tectonic process acting in this sector from Pleistocene to Recent, along and in the vicinity of the WNW
14 – ESE SWIM faults, on the plate boundary offshore Morocco. The following chapter 6, presents a paper concerning volcanism episodes not related to the opening of the Atlantic Ocean and examine the interaction of this volcanism with the tectonic processes acting in the area. This paper is submitted to Terra Nova. The main conclusions of this work are discussed in Chapter 7.
15
2 Data and methodology 2.1 Swath bathymetry
In the last decade the Gulf of Cadiz has been intensively investigated. One of the major outcomes of these researches was the publication of the “Bathymetry of the Gulf of Cadiz,
North-East Atlantic: the SWIM multibeam compilation” (Zitellini et al., 2009). This map is
the result of a collaboration with several European and Italian scientific partners, 19 surveys for more than 200 days (Enclosure 1). The map was built from a dtm with 100 m x 100 m cells resolution and the digital data are available on line as supplementary material with cells resolution of 250 m x 250 m.
Model RESON SeaBat 8160
Operating frequency: 50 KHz
Swath angle: 150°
Operating Depth: 5 – 3000 mt
Beam number: 126
Vertical resolution:
1.4 cm with range until 750 m
2.9 cm with range between 1000 m and 1500 m
8.6 cm with range between 1500 m and 2500 m
TABLE 2.1 Technical parameter of the RESON multibeam system of the R/V Urania during the NEAREST cruises.
16 Two of the surveys mentioned above were the Nearest 2007 and Nearest 2008 cruises carried out in the frame of the European project NEAREST (http://nearest.bo.ismar.cnr.it). Two bathymetric surveys were acquired and began part of the compilation. The research cruise was carried out with the 61 meter R/V Urania, owned and operated by SO.PRO.MAR. and on long-term lease to CNR. I had the opportunity to be on board and to acquire and reprocess the data at the Centro di Calcolo facilities in ISMAR-Bo.
R/V Urania was equipped with a RESON 8160 multibeam systems and a DGPS FUGRO positioning system. The navigation and the bathymetric acquisition was done with the PDS2000 software by RESON. During the acquisition CTD casts were performed to calibrate the Sound velocity values on the acquisition software (Table 2.1).
The data was stored in SIMRAD binary format (*.all) to be reprocessed by the most common bathymetric processing software. To reprocess the data I used the: NEPTUNE / Konsgberg, CARAIBES / Ifremer and MB system / Columbia University (Caress and Chayes, 2009) softwares. After reprocess classical digital terrain model (dtm) are built using GMT (Wessel and Smith, 1995 & 1998) to make bathymetric map.
NEAREST 2007 survey was done on the South Portuguese continental shelf offshore Portimao (Fig. 2.1.1). This survey covers 400 km2 of the external continental shelf and the first part of the continental slope at depth between 100 m bsl and 300 m bsl. The shelf is characterized by a general flat morphology, somewhere interrupted by meter scale high hundreds meters long, bedrock ridges. The southern margin of the continental shelf and the slope characterized by the head of three small arcuate canyons. These develop on a 11° dip slope and connect to the continental shelf through a structural flat area at 300 m bsl.
The results of NEAREST 2008 survey offshore Morocco are presented and discussed on chapter 5.
17 Figure 2.1.1 NEAREST 2007 survey, bathymetric shaded relief map (Coloured area: 25 m x 25 m cell size resolution). Blue bathymetry from Gulf of Cadiz Multibeam Compilation (Zitellini et al., 2009) 100 m x 100 m grid resolution.
2.2 High-resolution CHIRP seismic
Hull-mounted and towed sub-bottom profilers have become common within the academic community and are typically acquired during high-resolution multibeam bathymetric surveys. Sub-bottom profilers emit a chirp signal that characterized by frequencies of 3-7 KHz which often penetrates the bottom 100 meters or more. Sub-bottom profilers get more deep penetration with low frequency, thus a chirp center frequency near the “old” 3.5 kilohertz is generally used (Henkart, 2009).
The high-resolution sub-bottom seismic data, acquired during NEAREST 2007 and 2008 cruises with a BENTHOS CHIRP II (Table 2.2), were processed with SeisPrho (ISMAR) software (Gasperini and Stanghellini, 2009). The program allows the users to handle SEG-Y
18 data files (and other non-standard formats) carrying out a processing sequence over the data to obtain, as a final result, bitmap images of seismic sections. The resulting images have been interpreted on screen or printed, then the interpretation was reported on cartographic software as QGis or GMT. During this three years a large database of sub bottom lines acquired during several oceanographic cruises has been created using GIS software.
Factory Benthos
Model Chirp II
Installation Hull mounted
Number of transducers 16
Transducers type AT 471
Signal generator / DSP CAP-6600 Chirp II Workstation
DSP Sonar Signal Processing 16 bit A/D, continuous FFT
Operating sweep frequency 2 – 7 kHz
Ping rate Variable, operator selectable (max 12 ping/sec)
Sweep Length Variable, operator selectable
Multiping option yes
Gain Automatic gain control
Bottom tracking Interactive
Navigation / Annotation NMEA 0183
Data format SEG Y
Printer Alden
Acquisition software SwanPRO / ChirpScan II
Processing software SeisPRO / SwanPRO
Location controller / recorder Recording room (room # 525) Table 2.2 CHIRP seismic sub bottom profiler on board R/V Urania during NEAREST cruises.
19 During this period I had the chance to take part in two oceanographic surveys, the Nearest 2007 and Nearest 2008 cruises, in the area of the Gulf of Cadiz and to acquire directly Chirp data helpful to my study. In particular CHIRP data have been used for the geo-morphological interpretation of the NEAREST08 Morocco bathymetric survey (chapter 5) and for the geological interpretation of the Coral Patch seamount (chapter 6).
20
2.3 Seismic reflection data
2D seismic multichannel (MCS) data have been the main dataset used in this work. ISMAR-BO participated in the last 20 years to several international and national scientific projects during which a large dataset of seismic lines was acquired (Fig. 2.3.1). Data available and interpreted during this thesis belong to several survey: RIFANO 1992 (Sartori et al., 1994), BIGSET 1998 (Zitellini et al., 2004 a), VOLTAIRE 2004 (Zitellini et al., 2004 b), IAM 1993 (Banda et al., 1995), SWIM 06, SISMAR 2001 (Contrucci et al., 2004) and ONHYM-ONAREP 1987 (Flinch, 1993).
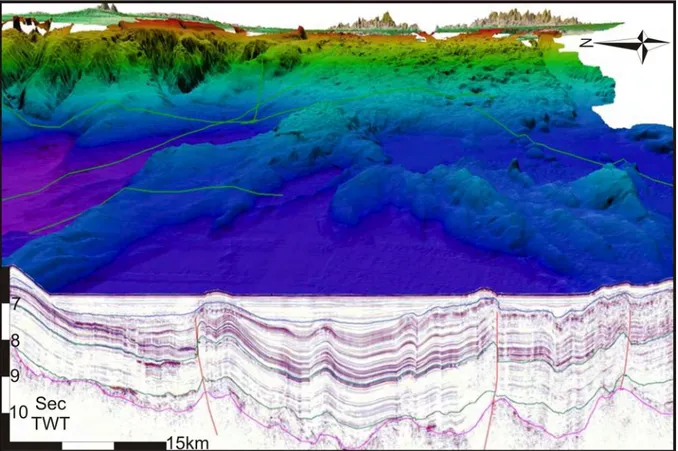
Figure 2.3.1 Seismic lines dataset collected in the last 15 years at ISMAR for the area offshore SW Iberia. TP: Tagus abyssal Plain; GB: Gorringe Bank; HP: Horseshoe abyssal Plain; CP: Coral Patch; SP: Seine abyssal Plain; GAP: Gibraltar Accretionary Prism. Red line: Seismic AR07 line in Fig. 2.4.2.
21 Seismic interpretation is based on the recognizing of faults and unconformities, seismic facies and reflectors termination (Payton, 1977). Seismic facies are defined on the basis of change in reflection style including continuity, wavelength and amplitude (Mitchum et al., 1977; Bally 1987).
Figure 2.3.2 Seismic line AR 07 and 3D view bathymetry of the Gulf of Cadiz. (SW to NE view). Vertical scale in second Two way Time. For location see Fig. 2.4.1.
In particular for this thesis about 5000 km of MCS were interpreted. The review of these seismic dataset collected in the last 15 years at ISMAR-BO permits to directly correlate, for the first time, the principal regional unconformity in the three main basins of the area, Seine, Horseshoe and Tagus Abyssal plains. In turn, this allows to correlate the main tectonic events and their temporal development on the whole oceanic domain of the Gulf of Cadiz. The constraining of the temporal evolution of the main tectonic events, at regional scale, permits to better understand the events responsible of the main geological structures in the area at lithospheric scale.
22
3 Geomorphological, structural and geophysical setting of the Gulf of Cadiz 3.1 Structural Settings
Kinematic model proposed in the last 10 years (Rosembaun et al., 2002; Schettino & Scotese 2005) shows that the Gulf of Cadiz area was characterized by a poliphasic tectonic regime from the onset of Atlantic oceanization to Recent.
Palinspastic restoration, based on the study of oceanic magnetic anomaly lineations (Srivastava et al., 1990), show how the Eurasia - Africa plate boundary (Fig. 3.1.1) owns the present day configuration only since Late Oligocene times. Since first continental break-up, the region recorded complex plate interactions outlined in Fig.3.1.2.
Figure 3.1.1 The Azores Gibraltar plate boundary Line (AGL); NA: North America Plate; MAR: Mid Atlantic Ridge; TR: Terceira Ridge; GFZ: Gloria Fracture Zone; SL: SWIM Lineaments; Dashed line mark the Betic Rifean chain.
The continental margins of South Iberia and Morocco formed during Jurassic continental break-up between North America and Africa while the western continental margin of Iberia formed as a result of the Cretaceous separation of from North America. As a consequence, the Tagus, Horseshoe and Seine Abyssal Plains correspond to oceanic crust of Late Jurassic-Early
23 Cretaceous age. Starting approximately from Chron M0 (~125 Ma) Iberia moved independently until Chron 34 (~85 Ma) when appeared welded to Africa. At Chron 13 (~34 Ma), contemporaneously with the Pyrenean continental collision, the boundary jumped again South of Iberia and only at Chron 6 reached the present day plate-tectonic configuration.
Figure 3.1.2 Plate kinematics reconstruction after Rosembaun et al., 2002, (in a fixed Eurasia references). Blue arrows: movement vectors for the Coral Patch Seamount; red arrows: movements vector for the Gorringe Bank. These two seamounts are chose to enlighten the stress field acting in the Horseshoe abyssal plain between them. Seismic lines permit to consider the Coral Patch as part of Africa plate and Gorringe Bank as part of Iberia plate since the Jurassic breakup.
The Europe-Africa plate boundary now trends roughly E-W, connecting the Azores-Triple Junction to the Gibraltar Strait along the so called Azores-Gibraltar Line (AGL in Fig. 3.1.1). Along this line the plate motion is divergent East of the Azores with a dextral strike-slip component, transform in the middle segment, the Gloria fault, and convergent to the East of the Tore-Madeira Rise where the upper crust appears affected by diffuse compression (Sartori
24 et al., 1994). At about 2.0 Ma the localization of the deformation offshore Iberia started to be focused along ESE-WNW strike-slip faults (Rosas et al., 2009) controlling the present-day plate interaction between Iberia and Africa.
Further eastward, the eastern part of the AGL is buried by deformed sediments of the accretionary wedge related to westward-trending Miocene emplacement of the Gibraltar orogenic arc.
Figure 3.1.3 a) Stress map of the study area, color bar strain rate and b)Recent tectonic setting, (bottom arrow: direction of relative movement of Africa with respect to Iberia). GFZ: Gloria Fracture Zone; Modified after Zitellini et al. (2009).
In the area between the Gorringe Ridge and the Gibraltar Strait, compressive stress trends mainly NNW-SSE with plate convergence rate of 4 mm/y (DeMets et al., 1994). The Gorringe Ridge, the Coral Patch Ridge, and the series of Abyssal hills in the Seine Abyssal
25 Plain formed by northwest to southeast-trending thrusting during the latest stages of the Eurasia-Africa convergence.
3.2 Main geomorphologic features
The main morphological features of the Gulf of Cadiz (Fig. 3.2.1) are described hereafter from South to North, from the Moroccan offshore to the West Iberia continental margin and abyssal plain systems. The Gibraltar accretionary prism domain is introduced at the end of the chapter.
Figure 3.2.1 Morpho bathymetric map of the Gulf of Cadiz, SWIM compilation.
(LC Lisboa Canyon; TAP Tagus Abyssal Plain; SV San Vicente Canyon; GB Gorringe Bank; HS Hirondelle seamount, HAP Horseshoe Abyssal Plain; AS Ampère seamount; CP Coral Patch seamount; CPR Coral Patch Ridge; GAP Gibraltar accretionary prism; SAP Seine abyssal plain; MP Mazagan Plateau).
Zitellini et al. (2009) published a bathymetric compilation map of a great part of the Gulf of Cadiz (Fig.3.2.1 and Plate 1) merging high-resolution bathymetric surveys performed in the
26 last ten years by several European Oceanographic Institutes. The results is a bathymetric map, (100 m x 100 m grid resolution) that improved the knowledge of the whole area.
The Moroccan Mazagan platform, West of Casablanca, is a 50-60 km wide continental shelf. In this sector four DSDP site (545, 544, 546, 547) (Hinz et al., 1982) reveal the stratigraphy and the evolution of the continental margin showing how the present day continental slope is strongly influenced by the presence of a Cretaceous drowned carbonate platform buried below it. The continental platform gently dips from the coast and is abruptly interrupted by a highly inclined slope connected to the Seine Abyssal plain. The slope, with a mean inclination about 5°, presents a classical canyon - ridge - canyon morphology. In several parts this escarpment can reach slope values around 30°-40°, this steepness resulting by erosive process acting on the old carbonate platform buried below this escarpment.
Northwest of the Moroccan shelf there is the Seine Abyssal Plain. This plain, about 400 km long x 250 km wide, has a mean depth of 4400 m and can be divided in two parts. Toward the West, there is a starved flat basin with only few abyssal hills on the northern side. East of 10°30’ W the plain is interrupted by ridges and hills that arise up to 3500 m bsl. Seismic data show how these hills and ridges are of two types: the first one is formed by a regular, sub-parallel top-thrust anticlines, the second one is formed by isolated to aligned diapiric hills. Ridges are commonly 10 to 20 km wide, with a maximum length about 50 km. Diapiric domes are generally of rounded in shape, 5 km wide, rising about 200-300 m from the flat plain. On the western margin a series of rounded shape hills arise for about 200 m from the 4400 m deep, flat abyssal plain. Seismic data reveal that these structures are the morphological expression of deep diapiric structures flowing up to the sea-bottom (Fig. 3.2.2). These diapiric domes are aligned ENE – WSW. Some of these hills are also present eastward, on the top of the Gibraltar accretionary prism.
27 The presence of these diapiric structures cutting all the sedimentary layers of the accretionary prism, without sign of tectonic lateral displacement, testify the inactivity of the accretionary prism at least at the toe of this structure.
Figure 3.2.2 MCS line AR06 in the Seine Plain, Blue arrow: diapirs; Red arrow: thrust in the accretionary prism; Yellow line: onlap unconformity.
The northern part of the Seine abyssal plain ends at the toe of the 200 km long, WSW-ENE oriented Coral Patch Ridge. This long chain of ridges and seamount starts from the North, at 9°30’ W - 35° 30’N, with a 1000 m high seamount and ends to the South with the Coral Patch seamount. On the top of this ridge, halfway between the Coral Patch seamount and the northern Coral Patch Ridge, is located the site of DSDP 135 (see chap. 3.4). The Coral Patch seamount, well described in chapter 6, is a large seamount rising 3800 m from the surrounding abyssal plains. On the top at least nine well preserved volcanic edifices are present. The slopes of the seamount are steep and characterized by gully-like scours and gravitative phenomena. To the west, the Coral Patch is connected through a thin saddle to the Ampere seamount. This is a volcanic seamount rising up to 250 m bsl with a classical conic volcanic shape down to 1000 m bsl. The basal part of the Ampere seamount is elongated in a WSW-ENE direction as the Coral Patch. The Ampere and Coral Patch Ridge separates the Seine abyssal plain from the Horseshoe Abyssal Plain. This is long 300 km with a mean width of 65 km, is elongated toward NE with depth ranging from 4750 m and 4900 m bsl. Only few
28 abyssal hills rise from the HAP in the eastern sector. These hills seem to be aligned from WNW to ESE; they have been interpreted by Rosas et al. (2009) and Zitellini et al. (2009) as the morphological expression in the area of a set of trascurrent faults, the SWIM lineaments, crosscutting all the Gulf of Cadiz from the Gloria fault to the Moroccan coast. The Western termination of the Horseshoe Abyssal Plain corresponds to the Tore Madeira Rise, formed by a series of seamounts and abyssal hills, roughly aligned N-S.
Figure 3.2.3 Gorringe Bank shaded relief map, Mercator Projection, coordinates in meters. White box location of Figure 3.2.4.
The Horseshoe Abyssal Plain is bounded to the North by the impressive slope of the Gorringe Bank and Hirondelle Seamount. The Gorringe Bank is a 4800 m high seamount elongated SW - NE, 200 km long and 80 km wide. The top is made up of two main reliefs, the Gettisburg seamount on the southwestern part, and the Ormonde seamount on the northeastern end, both rising up to 50 m bsl. In between it is located the sites of DSDP 120 (see chap. 3.4), the two
29 peaks have a flat top surface because of winnowing process during last glaciations; observed morphologies suggest the presence of outcrops of the substratum. The North flank of the Gorringe is characterized by a slope with a mean inclination varying between 7° ad 10°. On this slope a giant landslide is present, with the head escarpment at 2500 m bsl, 20 km wide (Fig. 3.2.3, 3.2.4). The toe deposit of the slide is 20 km wide on the northern abyssal plain, at 5000 m bsl. The slide surface is around 350 km2 and it is long 45 km from the hinge of the head escarpment to the toe of the accumulation zone. The source area is 20 km long and is from 15 to 20 km wide.
Figure 3.2.4 Giant Slide on the Northern flank of the Gorringe Bank. Red line: headwall; Black dashed line: Toe deposit. Vertical exaggeration 5X, location on figure 3.2.3.
The Hirondelle seamount, bounds the North western sector of the Horseshoe Abyssal Plain West of the Gorringe Bank, it arises 2000 m from the adjacent abyssal plains and is characterized by elongated SW-NE small ridges, probably due to the accretion of new oceanic crust during the initial stage of the oceanization (Rovere et al., 2004). Moreover, the Hirondelle is crosscut by a linear depression extended from the NW sector to ESE, this
30 depression is interpreted as part of the SWIM trascurrent lineaments (Zitellini et al., 2009). Unfortunately, westward to the Hirondelle, the unique bathymetric data are the Gebco predicted topography (Sandwell and Smith, 1997) that do not have the resolution sufficient to check the westward continuation of the SWIM lineaments.
North of Gorringe Bank and Hirondelle seamounts, the deepest abyssal plain of the area, the Tagus Abyssal Plain, is present. This plain has a mean depth of 5000 m bsl and is bounded to the East by the Iberian continental slope. No particular features are detected at the sea-bottom on this extremely flat plain. The West Iberia Continental margin, instead, shows many of different morphological structures. In this work, is taken into consideration the part comprised between the Lisbon Canyon to the North and the S. Vicente Canyon to the south. Lisbon Canyon, as well as the Cape S. Vicente Canyon, starts on the continental platform and reaches the abyssal plain acting as a connector for the silicoclastic sediment transport from land to the distal abyssal systems (Purdy, 1975).
The South Iberian continental platform starts East of Cape S. Vicente. It can be divided into two main levels at different depth. From the coast, often represented by high-cliffs and Ercinian basements outcrops, a first gently sloping platform extends for ten to twenty kilometers to a depth of 120 m, then, below, a second sub-horizontal platform at depth between 200 and 700 m is present (Terrinha et al, 1998; Rovere et al, 2002). The continental shelf morphology down to -120 m bsl is influenced by Ercinian substratum outcrops between Cape S. Vicente and Faro lagoon. The two set of plateau are formed by prograding neogenic units and then influenced by the strong Mediterranean Outflow Water (MOW) current.
Both the Iberian and the Moroccan platforms terminate to the East against the Gibraltar Accretionary Prism. This is the offshore continuation of the Betic-Rifean arc. Overall, the accretionary wedge is characterized by a mean moderate slope (<2° in general). However, along its external and internal boundaries the seafloor can locally reach slopes up to 10°. The
31 surface appears scattered by large sub-circular scours and depressions (Rosas et al., 2009). Seismic data show that this morphology is the surface expression of the geological thrust and fold structures of the wedge, covered by few meters of recent sediments. The North-Eastern sector of the Gibraltar Accretionary Wedge is also affected by the Mediterranean Outflow Water current that models and control the local sediment fabric and transport, in fact many conturite fields are present. The central sector of the prism shows two lobes. The lower boundary of these two lobes corresponds approximately to the -2000 m bathymetric contour, and they are marked by arcuate bands of steep (around 10°) slopes. The southern lobe presents several elongated WNW-ESE lineaments cutting the sea-bottom. These lineaments are part of the SWIM lineaments of Zitellini et al. 2009. They cut all the prism from the HAP to the Moroccan margin. Lineaments in this sector influenced and drove the gravitational bodies that in several place are confined by these WNW – ESE oriented lineaments.
32
3.3 Gravimetric data
Gravity data have been used to investigate crustal density variation. The Sandwell and Smith altimetry derived Free Air Anomaly (Sandwell and Smith, 1997) and the Multibeam topographic data have been used for the gravity inversion. The gravimetric processing was done at INGV La Spezia institute. First the gravity-bathymetric correlation was determined using the Nettleton approach in order to compute the best crustal density for Parker inversion; this method gave a 2600 g/cm3 as mean crustal density. Next, the predictable signal due to water/crust and crust/mantle boundaries were removed from the Free Air Anomaly.
Figure 3.3.1 Free Air Anomaly (Sandwell and Smith, 1997), for the multibeam compilation area
33 This was done by using a crustal layer bounded by the topography and by a flat 14 km depth Moho. Finally a modified Parker algorithm (Caratori Tontini et al., 2008) was used to compute crustal lateral density variation. The range in density variation is between 2.0 and 3.1 g/cm3.These are preliminary results. In fact seismic line will be used to constrain sediment/basement and crustal/mantle bounderies in order to perform new gravity inversion.
The gravimetric data are used to validate the lithospheric folding model presented on chapter 4.
Figure 3.3.1: Bouguer anomaly, corrected for the Gulf of Cadiz Bathymetric Compilatio, UTM 29 Projection.
34 Figure 3.3.3: Crustal density variation computed using the Caratori & Tontini (2008) algorithm.
35
3.4 DSDP
The Atlantic continental margin between North Iberia and Morocco was matter of several studies implying ODP, IODP and DSDP project. In particular 4 zones were drilled on 27 sites during several leg of this projects.
Figure 3.4.1 Location map of DSDP drilling sites: DSDP 120 and DSDP 135; TP: Tagus abyssal Plain; HP: Horseshoe abyssal Plain; SP: Seine abyssal Plain.
The main topic of the drilling project was to study the mode of rifting, subsequent drifting and complete oceanization of the Atlantic Sea, that occurred from the late Jurassic to middle Cretaceous. In particular from North to South the Galizia Margin (ODP sites 103, 149, 173, 637, 638, 639, 641, 398, 897, 898, 899, 900, 901, 1065, 1067, 1068, 1069, 1070, 1276, 1277 Boillot et al., 1985; Sawyer et al., 1994; Whitmarsh et al., 1998), the Gorringe Bank (DSDP 120) the Coral Patch Ridge (DSDP 135) and the Moroccan Margin (DSDP sites 370, 544, 545, 546, 547) were drilled between 1970 and 2001.
Two DSDP (120 and 135) wells drilled in the Gulf of Cadiz (Figures: 3.4.1, 3.3.2, 3.4.3) are used in this work to calibrate and correlate seismo – stratigraphic interpretation.
36
Figure 3.4.2 schematic stratigraphy.
The well DSDP 120 (Ryan et al. 1973), located at 36°41.388'N 11°25.938'W on the northern flank of the Gorringe Bank, reach a depth of 253.4 m from the sea bottom (Fig 3.4.2). During the drilling, because of technical problem, only 8 core fragments were recovered, so the sampled material was only the 19.8% of the total length of the well.
At DSDP 120, Lower-Middle Miocene and Lower Cretaceous (Albian, Aptian, Barremian) gray and green, partly silicified nannofossil oozes were cored. The inferred stratigraphic section (Fig. 3.4.2) contains two significant unconformities: (l) a hiatus in bathypelagic sedimentation between Cretaceous and Miocene; (2) an abrupt change in sediment facies across this unconformity, silicified nannofossil ooze yielding poor assemblages of planktonic foraminifera (suggestive of original deposition near or below the lysocline) and younger chalks and oozes unaffected by solution with rich, diverse assemblage.
The well reached the basement at 251.7 m below the sea bottom, the basement rocks consist of spilitic basalt, serpentinite, and meta-gabbro. This ophiolitic rock give a radiometric Giurassic age.
37 Figure 3.4.3 DSDP 135 schematic stratigraphy.
The well DSDP 135 (Hayes et al. 1972), located at 35°20.802'N 10°25.458'W on the Coral Patch Ridge, drilled 687 m of recent to Aptian sediments (Fig 3.4.3) and did not reach the basement.
The upper part of the core consist of 325 m of calcareous mud from Pleistocene to Recent in age. Under this unit pelagic sediments with little carbonate fraction and terrigenous quartz dominated sediment are recovered. The bottom part of the DSDP 135 is characterized, below 560 m, again by calcareous sediments, Aptian in age. A major unconformity is represented by a hiatus in the sedimentation between Oligocene and Upper Eocene.
38
4 Structural Evolution Eocene-Pleistocene Paper submitted to Geology
TITLE
Synclines as prime expression of compressional deformation of the lithosphere: the Central Atlantic segment of the Iberia-Africa Plate Boundary
AUTHORS
N. Zitellini, Istituto di Scienze Marine, Sede di Bologna (ISMAR), Via Gobetti 101, 40129, Bologna, Italy.
S. Cloetingh, Faculty of Earth and Life Sciences, VU University (ISES), De Boelelaan 1085, 1081 HV Amsterdam, The Netherlands.
F. D’Oriano, Dipartimento Scienze della Terra e Geologico Ambientali, Via Zamboni n.67, 40127, Bologna, Italy
E. Burov, Lab. Tectonique UMR7072, Case 129, University of Paris 6, 4 Place Jussieu, Paris 75252, France.
KEYWORDS
lithospheric deformation, compressional reactivation, Drakkar structures, Africa-Iberia plate interactions.
ABSTRACT
Quantitative analysis of deep penetrating multi-channel seismic (MCS) lines, supplemented by gravity data, documents the fine structure of intra-plate deformation adjacent to the convergent Europe-Africa plate boundary offshore Gibraltar, Central Atlantic. In the brittle lithosphere, the deformation is expressed by crustal folding with the development of 30-190 km wide large wavelength synclines, bounded by short wavelength anticlines. The synclines
39 are almost symmetrical with wavelengths characteristic either for coupled or decoupled lithosphere. The spatial characteristics of the deformation show a striking similarity with the intraplate deformation in the northeastern Indian Ocean in terms of inferred mantle wavelengths. In contrast, the observation that in the Gulf of Cadiz only syncline structures are well expressed, suggests that gravity prevents the formation of anticlines of the same wavelength during the first stages of plate convergence, and only later one vergence will prevail, as in the Indian Ocean.
INTRODUCTION
Since the discovery of intraplate deformation in the form of oceanic lithospheric folding in the Northeastern Indian Ocean, numerous studies have provided evidence in support of this style of deformation in several areas around the globe (e.g. Stephenson and Lambeck, 1985; Stephenson and Cloetingh, 1991; Burov et al., 1993; Burg and Podlachikov, 1999; Cloetingh et al., 1999). Most of these studies have addressed folding in continental lithosphere since, due to its mechanical stratification, continental lithosphere is in general more prone to folding than oceanic lithosphere (Sokoutis et al., 2005). However, studies of continental lithosphere folding have been hampered by sub-aerial erosion removing part of the record of associated vertical motions and wiping out much of the high-frequency, short-wavelength records of folding (Cloetingh et al., 1999). Oceanic lithosphere and offshore rifted margin lithosphere has no such drawbacks, allowing the determination of the full spectrum of intraplate wavelengths due to folding. Due to its high strength, folding of oceanic lithosphere requires high stress levels such as observed in the Indian plate (see also Cloetingh and Wortel, 1985, Stein et al, 1989). Similar high stress levels are likely generated also in the proximity of plate boundaries in contrast to the interiors of oceanic plates where exceptionally high stress levels are generally not observed. Lithosphere regions adjacent to plate boundaries may thus be likely candidates for folding in oceanic domains. We present the results of a new quantitative
40 analysis of a set of MCS profiles offshore SW Iberia (Fig.1), acquired parallel to the motion vector of Africa with respect to Iberia. The data set, collected during the AR92 R/V Explora Cruise (Sartori et al., 1994), provides new evidence for folding of continental and oceanic lithosphere.
GEOLOGICAL SETTING
Palinspastic restorations (Plate 1), based on oceanic magnetic anomaly lineations (Srivastava et al., 1990), show that the Eurasia/Africa plate boundary underwent complex plate
interactions, acquiring its present configuration only since late Oligocene times (Plate 1h). The continental margins of South Iberia and Morocco formed during Jurassic continental break-up between North America and Africa while the western continental margin of Iberia formed as a result of the Cretaceous separation between Iberia and North America (Plate 1c). As a consequence, the Tagus, Horseshoe and Seine Abyssal Plains correspond to oceanic crust of Late Jurassic-Early Cretaceous age.
In the Atlantic, the Europe-Africa plate boundary (Plate 1h) now trends roughly E-W, connecting the Triple Junction to the Gibraltar Strait along the so-called Azores-Gibraltar Line (AGL). Along this line, plate motion is divergent east of the Azores, transform in the middle segment (Gloria fault), and convergent to the east of the Tore-Madeira Ridge where the upper crust appears affected by diffuse compression (Sartori et al., 1994) with plate convergence of 4 mm/y (DeMets et al., 1994). Further eastward, the termination of the AGL is buried by the deformed sediments related to westward Miocene emplacement of the Gibraltar orogenic arc (Fig.1). During the Eocene-Late Pliocene stages of Eurasia-Africa convergence, northwest and southeast directed thrusting originated the Gorringe Ridge, the Coral Patch Ridge and the series of abyssal hills in the Seine Abyssal Plain (Zitellini et al., 2009). At about 2.0 Ma (Rosas et al., in press) the localization of the deformation offshore
41 Iberia started to be focused along ESE-WNW strike-slip faults controlling the present-day plate interaction between Iberia and Africa (Zitellini et al., 2009).
DEFORMATION OFF SW IBERIA: CONSTRAINTS FROM MCS DATA
The seafloor off SW Iberia and in the Gulf of Cadiz has attracted considerable attention during the last decade (Sartori et al. 1994; Hayward et al. 1999; Gutscher et al., 2002; Terrinha et al., 2003; Gracia et al., 2003; Medialdea et al., 2004; Zitellini et al. 2001, 2004) due to the occurrence of pronounced anomalous topography. The area is also considered to be the source area of the 1755 Lisbon earthquake (Plate 1a). Spectacular features include the Gorringe Bank, a large uplifted block of oceanic mantle characterized by shallow-depth peridotite outcrops, and by one of the largest geoid anomalies of the oceans (Bergeron and Bonin, 1991).
Figure 1 displays line drawings of three parallel MCS lines exhibiting the spatial variation of the deformation pattern of the area. Line AR10 encompasses the deformation of the thinned continental margin offshore SW Iberia. Lines AR03-08 and AR07 comprise the full deformation zone of the oceanic domain, situated between the undeformed sediments of the Tagus and Seine Abyssal Plains.
Line AR10 (Fig.1 and Plate 1j) shows the deformation due to Europe-Africa convergence of
Late Jurassic-Early Cretaceous thinned continental crust of the rifted SW Iberia margin that began in the Eocene. The seismic line shows the presence of a large syncline bounded by two top thrust anticlines with opposing, outward verging, thrust planes. The width of this structure measured from the two opposite bounding faults is 90 Km (Fig.1) with peak to peak distance between the bounding anticlines of 63 km. The two bounding faults, as shown in Plate 1, are at high angle throughout the sediment cover and are blind thrusts, not reaching the surface. In
42 the upper crust however, they propagate at lower angle with a dip of 24° (Zitellini et. al., 2001). The bounding faults merge on a common, almost horizontal, detachment fault at 11 sec. TWT depth, at approximately 18 km, where the earthquake activity of the structure is concentrated. Zitellini et al. (2001) interpreted this horizon as an intra-crustal decoupling level.
Within the sedimentary cover, which is approximately 3 sec TWT thick and which records presently active shortening (Zitellini et al., 2004), the unconformity that marks the onset of compression can be recognized (Plate 1, shot point 1500, 5s depth). Most of the deformation is concentrated on the bounding anticline structures while the intervening syncline, once formed, remained practically undeformed, becoming an important regional basin depocenter. At present, however, no clastic sedimentation occurs as a result of compression induced uplift that triggered the formation of the San Vicente Canyon within the syncline axis (Plate 1j).
Line AR03-08 connects the Gorringe Bank with the Coral Patch Ridge (Fig. 1i). These two
parallel ridges can be regarded as analogues, at a larger scale, of the anticline structures described above. The Gorringe/Coral Patch ridges show shortening accommodated mainly by two, inward directed faults bounding a less deformed, wide, syncline. The peak to peak distance of the anticlines is about 165 Km. At the Gorringe Bank the bounding thrust exposes mantle rocks, implying lithospheric, low angle decoupling whereas at the Coral Patch Ridge the bounding fault increases its dip upward, without reaching the surface, similar to the previous AR10 line case. The occurrence of mantle rocks at the Gorringe Ridge can be explained if the seafloor was floored by peridotite, exhumed during the initial stages of Cretaceous separation between Iberia and North America, as in the Galicia Bank (Rovere et al., 2004). Deformation across the Gorringe-Coral Patch ended during Middle-Late Miocene as indicated by the on-lapping sedimentary units of the Tagus and Horseshoe (HS) Abyssal Plains (Zitellini et al., 2004). As in line AR10, the syncline become a basin depocenter,
43 storing 3 km of syn-post deformation sedimentary deposits. Once more, we observe that most of the brittle deformation is concentrated at the bounding anticline structures while the syncline did not experience important deformation. The vertical set of faults cross-cutting the HS Plain are related to later dextral strike-slip motion (Zitellini et al., 2009) that started later, at the end of Pliocene time (2.0 Ma).
Line AR07 illustrates the deformation that occurred on the 160 Ma old (Srivastava et
al.,1990), Late-Jurassic, oceanic crust of the Seine plain, 200 km offshore Morocco. Expressed as a set of parallel folds emerging from the Seine Plain, the deformation took place from Eocene until Late Pliocene. In section, the presence of a large syncline is observed which encompasses and contains a smaller one. As in the previous cases, the synclines are confined laterally by a set of opposite verging high angle inverse faults, marked by anticlines (Fig.1 and Plate 1l). The spatial separation between two bounding anticlines of the same order is 82 km and 34 km. The onset of folding and faulting is recorded by a regional unconformity for the larger structure and by a local unconformity for the smaller one. The relations between these unconformities show that deformation moved toward the centre (centripetal) in time. However, once formed the larger and the smaller structures grow together. In this sector the onset of the compressional stage is synchronous with the onset of deformation in the HS area, as shown by the good correlation of a region-wide, pre-folding unit. A regional unconformity marks the end of the major stage of compression, at about 2 Ma, when deformation focused in the HS plain transcurrent structures (Zitellini et al. 2009).
DISCUSSION AND CONCLUSIONS
The seismic sections reveal that deformation in the brittle lithosphere is expressed as a set of large synclines possessing variable wavelengths (Fig. 1). These are bordered by short wavelength anticlines generated above two antithetic thrust faults dipping inward, towards the
44 syncline axis. Deformation of synclines with relatively shorter wavelengths involve the Late Jurassic continental crust of the Iberian continental margin (Line AR10) and the Jurassic oceanic crust offshore the Moroccan margin in the Seine Plain (Line AR07). Larger wavelength deformation appears to be restricted to the oceanic lithosphere of the Gorringe/Coral Patch region (Lines Ar03-08). Table 1 summarizes the main characteristics of these structures. We term these structure “Drakkar” given their close similarity with the hull of the Viking ships.
Gravity data furnish the means to explore the lithosphere character of the Drakkar structures. In particular, lateral density variations are mirrored by the long wavelength of the gravity field (Cloetingh et al., 1999). Free-air gravity anomalies of the region (Plate 1b) appear directly correlated with the longer wavelength topographic structures of the area (Plate 1a). In fact, the pronounced positive gravity anomalies over the Gorringe Bank and the Coral Patch ridge are separated by a gravity low, corresponding to the syncline that connects them. In contrast, the shorter wavelength Drakkar structures such as the set of folds in the Seine plain do not display any direct gravimetric correlation. This is an indication that the Drakkar structures of the Gorringe/ Coral-Patch pair are conformable with the deep lithosphere deformation, while the short wavelength tectonic deformation occurring in the Seine Plain implies decoupling between the upper oceanic crust and the mantle.
Figure 2 displays folding wavelengths against the thermal ages of the lithosphere as observed offshore SW Iberia together with other documented studies. There is a good correlation between the wavelengths and the thermal ages of the Drakkar structures for different decoupling levels that have been inferred from MCS data. Besides the 18 km deep intra-crustal decoupling level along the continental margin of SW Iberia, Figure 2 reveals that two decoupling levels act in the Seine Plain, one within the crust and one deeper at the mantle transition. The Gorringe-Coral patch structure instead resides in the coupled crust-mantle field.
45 Despite the general agreement between field data and previous theoretical models for the lithospheric folding wavelength in the upper crust, a substantial divergence is observed between folding models and the Drakkar structures. Classical models, in fact, predict deformation made up of synclines and anticlines with constant wavelength (Fig. 3a,c). We observe only the syncline development with deformation focused on the bounding top thrust anticlines with slight deformation within them as sketched in Fig. 3b,d. In the Gulf of Cadiz this occurs both in coupled and in mechanically decoupled lithosphere (Fig.2), suggesting that syncline development forms the principal mode by which the upper lithosphere responds to lithospheric folding during the initial stage of compressional deformation. This is also shown by Burov and Cloetingh (2009) (Figure DR-1) which presents the results of a numerical model for folding of a weak lithosphere similar to the case of the offshore Iberian margin (i.e. Line AR10); although generalized in terms of adopted timing, erosion and sedimentation rates, the model predicts that, in this rheologically state, asymmetric anticlines-synclines structures can develop similar to those observed in the study area.
The most obvious force preventing the full development of anticlines is gravity, both for mechanically coupled and uncoupled lithosphere. Meanwhile, the sedimentary load of this basin can, as gravity, enhance the development of the synclines. An immediate consequence of this mechanical behavior of the upper lithosphere is the generation of almost symmetrical, barely deformed basins, of particularly large dimensions in cases of mechanically coupled lithosphere, which are predicted to occur during the first stage of plate convergence.
ACKNOWLEDGEMENTS
This study was funded through grants of the EU Specific Program “Integrating and Strengthening the European Research Area”, Sub-Priority 1.1.6.3, “Global Change and Ecosystems”, contract n. 037110 (NEAREST); Netherlands Research Centre for Integrated
46 Solid Earth Science (ISES). Istituto di Scienze Marine, Sede di Bologna (ISMAR-BO) contribution n. XXX .
REFERENCES CITED
Bergeron, A., and Bonnin, J., 1991, The deep structure of Gorringe Bank (NE Atlantic) and its surrounding area: Geophysical Journal International, v. 105, p. 491-502.
Bonnet, S., Guillocheau, F., Brun, J.-P., and Van den Driessche, J., 2000, Large-scale relief development related to Quaternary tectonic uplift of a Proterozoic-Paleozoic basement: The Armorican Massif, NW France: Journal of Geophysical Research, v. 105, p. 19273-19288.
Burg, J.P., and Podladchikov, Y., 1999, Lithospheric scale folding; numerical modeling and application to the Himalayan syntaxes: International Journal of Earth Sciences, v. 88, p. 190-200.
Burov, E., Lobkovsky, L., Cloetingh, S., Nikishin, A., 1993. Continental lithosphere folding in Central Asia. Part 2: constraints from gravity and topography. Tectonophysics 226, 73-87.
Burov, E. and Molnar, P., 1998. Gravity anomalies over the Ferghana Valley (central Asia), and intracontinental deformation. Journal of Geophysical Research 103, 18137-18152. Burov, E., and Cloetingh, S., 2009, Interactions of mantle plumes and lithospheric folding:
impact on intra-plate continental tectonics. Geophysical Journal International, in press. Cloetingh, S., Burov, E., Beekman, F., Andeweg, B., Andriessen, P.A.M., Garcia-Castellanos,
D., De Vicente, G., and Vegas, R., 2002, Lithospheric folding in Iberia: Tectonics, v. 21, p. 1041 doi:10.1029/2001TC901031.
Cloetingh, S., Burov, E., and Poliakov, A., 1999, Lithosphere folding: primary response to compression? (from Central Asia to Paris Basin): Tectonics, v. 18, p. 1064-1083.
47 Cloetingh, S., and Wortel, R., 1985, Regional stress field of the Indian Plate: Geophysical
Research Letters, v. 12, p. 77-80.
DeMets, C., Gordon, R. G., Argus, D. F., Stein, S., 1994, Effect of recent revisions to the geomagnetic reversal time scale on estimates of current plate motions: Geophysical Research Letters, v. 21, p. 2191-2194.
Gracia, E., Danobeitia, J., Verges, J., Zitellini, N., Rovere, M., Accetella, D., Ribeiro, A., Cabral, J., Matias, L., Bartolome, R., Farran, M., Casas, D., Maldonado, A., Pazos, A., Cordoba, D., and Roset, X., 2003, Mapping active faults offshore Portugal (36 degrees N-38 degrees N); implications for seismic hazard assessment along the Southwest Iberian margin: Geology (Boulder), v. 31, p. 83-86.
Gutscher, M.A., Malod, J., Rehault, J.P., Contrucci, I., Klingelhoefer, F., Mendes-Victor, L., and Spakman, W., 2002, Evidence for active subduction beneath Gibraltar: Geology, v. 30, p. 1071-1074.
Hayward, N., Watts, A.B., Westbrook, G.K., and Collier, J.S., 1999, A seismic reflection and GLORIA study of compressional deformation in the Gorringe Bank region, eastern North Atlantic: Geophysical Journal International, v. 138, p. 831-850.
McAdoo, D.C., and Sandwell, D.T., 1985, Folding of oceanic lithosphere: Journal of Geophysical Research, v. 90, p. 8563-8569.
Medialdea, T., Vegas, R., Somoza, L., Vazquez, J.T., Maldonado, A., diaz del Rio, V., Maestro, A., Cordoba, D., and Fernandez-Puga, M.C., 2004, Structure and evolution of the "Olistostrome" complex of the Gibraltar Arc in the Gulf of Cadiz (eastern Central Atlantic):evidence from two long seismic cross-section: Marine Geology, v. 209, p. 173-198.
Nikishin, A.M., Cloetingh, S., Lobkovsky, L.I., Burov, E.B., and Lankreijer, A.C., 1993, Continental lithosphere folding in Central Asia; Part I, Constraints from geological observations: Tectonophysics, v. 226, p. 59-72.
48 Rosas, F.M., Duarte, J.M., Terrinha, P., Valadares, V., and Matias, L., 2009. Morphotectonic
characterization of major bathymetric lineaments in NW Gulf of Cadiz (Africa-Iberia plate boundary): insights from analogue modelling experiments: Marine Geology, in press, doi:10.1016/j.margeo.2008.08.002.
Rovere , M., Ranero, C. R., Sartori, R., Torelli, L., and Zitellini, N., 2004. Seismic images and magnetic signature of the Late Jurassic to Early Cretaceous Africa–Eurasia plate boundary off SW Iberia, Geophysical Journal International, v. 158, p. 554-568. Sandwell, D. T., W. H. F. Smith, 1997, Marine gravity anomaly from Geosat and ERS 1
satellite altimetry: Journal of Geophysical Research, v. 102 , No. B5, p. 10039-10054. Sartori, R., Torelli, L., Zitellini, N., Peis, D., and Lodolo, E., 1994, Eastern segment of the
Azores-Gibraltar line (central-eastern Atlantic); an oceanic plate boundary with diffuse compressional deformation: Geology (Boulder), v. 22, p. 555-558.
Sokoutis, D., Burg, J.-P., Bonini, M., Corti, G., and Cloetingh, S., 2005, Lithospheric-scale structures from the perspective of analogue continental collision: Tectonophysics, v. 406, p. 1-15.
Srivastava, S.P., Roest, W.R., Kovacs, L.C., Oakey, G., Levesque, S., Verhoef, J., and Macnab, R., 1990, Motion of Iberia since the Late Jurassic; results from detailed aeromagnetic measurements in the Newfoundland Basin: Tectonophysics, v. 184, p. 229-260.
Stein, C.A., Cloetingh, S., and Wortel, R., 1989, Seasat-derived gravity constraints on stress and deformation in the northeastern Indian Ocean: Geophysical Research Letters, v. 16, p. 823-826.
Stephenson, R.A. and Cloetingh, S., 1991, Some examples and mechanical aspects of continental lithospheric folding: Tectonophysics, v. 188, p. 27-37.
49 Stephenson, R., and Lambeck, K., 1985, Isostatic response of the lithosphere with in-plane stress; application to central Australia: Journal of Geophysical Research, v. 90, p. 8581-8588.
Terrinha, P., Pinheiro, L.M., Henriet, J.P., Matias, L., Ivanov, M.K., Monteiro, J.H., Akhmetzhanov, A., Volkonskaya, A., Cunha, T., Shaskin, P., and Rovere, M., 2003, Tsunamigenic-seismogenic structures, neotectonics, sedimentary processes and slope instability on the Southwest Portuguese Margin: Marine Geology, v. 195, p. 55-73. Zitellini, N., Gràcia E., Gutscher M.A., Matias L., Masson D., Mulder T., Terrinha P.,
Somoza L., DeAlteriis G., Henriet J.P., Dañobeitia J.J., Ramella R., Abreu M.A. and Diez S., 2009. The quest for the Iberia-Africa Plate boundary west of Gibraltar. Earth and Planetary Science Letters, v. 280, p. 13-50.
Zitellini, N., Mendes, L.A., Cordoba, D., Danobeitia, J., Nicolich, R., Pellis, G., Ribeiro, A., Sartoi, R., Torelli, L., Bartolome, R., Bortoluzzi, G., Calafato, A., Carrilho, F., Casoni, L., Chierici, F., Corela, C., Correggiari, A., Della Vedova, B., Gracia, E., Jornet, P., Landuzzi, M., Ligi, M., Magagnoli, A., Marozzi, G., Matias, L., Penitenti, D.,
Rodriguez, P., Rovere, M., Terrinha, P., Vigliotti, L., and Ruiz, A.Z., 2001, Source of 1755 Lisbon earthquake and tsunami investigated: Eos, Transactions, American Geophysical Union, v. 82, p. 285.
Zitellini, N., Rovere, M., Terrinha, P., Chierici, F., Matias, L., and Team, B., 2004, Neogene through Quaternary Tectonic reactivation of SW Iberian Passive Margin: Pure and applied Geophysics, v. 161, p. 565-585.
FIGURE CAPTIONS
Figure 1. Sketch map of the studied area with line drawing of deep seismic reflection profiles
50 direction active from Eocene to Late Pliocene. Inset shows the bathymetry of the studied area (Data from GEBCO97 Digital Atlas Web site:www.gebco.net) with toponyms.
Figure 2. Comparison of observed (solid square, circle and triangle) wavelengths of folding
offshore Iberia with theoretical predictions for oceanic lithosphere (McAdoo and Sandwell, 1985) in the absence (solid line) or presence (dotted line) of a thick sedimentary column (representative for the intraplate area in the NE Indian Ocean) and continental lithosphere (gray bands) (Cloetingh et al., 1999). Also shown for comparison are other estimates (open squares, circles and triangles) for wavelengths documented from geological and geophysical studies (Arctic Canada: Stephenson and Cloetingh, 1991; Central Asia: Nikishin et al., 1993; Britany: Bonnet et al., 2000; Mainland Iberia: Cloetingh et al., 2002, NE Indian Ocean: McAdoo and Sandwell, 1985; Stein et al., 1989). Both offshore Iberia (solid square and circle) and mainland southern Iberia (open solid square and circle) are characterized by separate dominant wavelengths for crust and mantle folds, reflecting decoupled modes of lithosphere folding. Note the similarity in wavelength of the inferred folding in the Gorringe Bank and Ampere Patch area (solid triangle) and the Central Indian Ocean (open triangle).
Figure 3. Four modes of continental folding: a) Folding of coupled oceanic lithosphere,
typical for the NE Indian Ocean (McAdoo and Sandwell, 1985; Stein et al., 1989); b) Folding of partially decoupled oceanic lithosphere, with a possible decollement between crust and upper mantle at oceanic Moho depths. Activation depends on the degree of shortening and the magnitude of horizontal stress, which can lead to the development of large-scale synclinal deformation as observed in the Gorringe-Coral Patch area in the far field of the Africa-Iberia plate boundary (see Figs 1 and 2, line AR03-08) as well as to decoupled crustal scale folding in the area offshore Morocco closer to the Africa-Iberia plate boundary (see Figs 1 and 2, line AR07); c) Decoupled continental lithosphere folding with separate wavelengths for crustal