© The Author(s) 2018. Published by Oxford University Press on behalf of The Gerontological Society of America. All rights reserved.
For permissions, please e-mail: [email protected]. 1643
doi:10.1093/gerona/gly239 Advance Access publication October 17, 2018
Research Article
Using the Multidimensional Prognostic Index to Predict
Clinical Outcomes of Hospitalized Older Persons:
A Prospective, Multicenter, International Study
Alberto Pilotto, MD, PhD,
1,* Nicola Veronese, MD,
1Julia Daragjati, PhD,
2Alfonso J. Cruz-Jentoft, MD,
3Maria Cristina Polidori, MD,
4Francesco Mattace-Raso,
MD,
5Marc Paccalin, MD,
6,7Eva Topinkova, MD,
8Giacomo Siri, ScD,
1Antonio Greco,
MD,
9Arduino A. Mangoni, MD,
10Stefania Maggi, MD,
11Luigi Ferrucci, MD
12on behalf of
the MPI_AGE Investigators
1Department of Geriatric Care, Orthogeriatrics and Rehabilitation, E.O. Galliera Hospital, National Relevance and High Specialization
Hospital, Genoa, Italy. 2Geriatrics Unit, San Antonio Hospital, Padua, Italy. 3Servicio de Geriatría, Hospital Universitario Ramón y Cajal
(IRYCIS), Madrid, Spain. 4Department of Medicine II, University of Cologne Medical Faculty, Germany. 5Department of Internal Medicine,
Section of Geriatric Medicine, Erasmus University Medical Center, Rotterdam, The Netherlands. 6Geriatrics Department, Poitiers
University Hospital, France. 7Centre Investigation Clinique 1402, University of Poitiers, France. 8Department of Geriatrics, First Faculty of
Medicine, Charles University in Prague, Czech Republic. 9Geriatrics Unit, IRCCS CSS, San Giovanni Rotondo, Italy. 10Department of Clinical
Pharmacology, School of Medicine, Flinders University and Flinders Medical Centre, Adelaide, Australia. 11Aging Section, National
Research Council, Padova, Italy. 12National Institute on Aging, Baltimore, Maryland.
See Acknowledgements for members of MPI_AGE Investigators
*Address correspondence to: Alberto Pilotto, MD, Department of Geriatric Care, Orthogeriatrics and Rehabilitation, E.O. Galliera Hospital, Mura delle Cappuccine 14, 16128 Genoa, Italy. E-mail: [email protected]
Received: August 8, 2018; Editorial Decision Date: October 5, 2018
Decision Editor: Anne Newman, MD, MPH
Abstract
Background: Multidimensional Prognostic Index (MPI) is useful as a prognostic tool in hospitalized older patients, but our knowledge is derived
from retrospective studies. We therefore aimed to evaluate in a multicenter, longitudinal, cohort study whether the MPI at hospital admission is useful to identify groups with different mortality risk and whether MPI at discharge may predict institutionalization, rehospitalization, and use of home care services during 12 months.
Methods: This longitudinal study, carried out between February 2015 and August 2017, included nine public hospitals in Europe and Australia.
A standardized comprehensive geriatric assessment including information on functional, nutritional, cognitive status, risk of pressure sores, comorbidities, medications, and cohabitation status was used to calculate the MPI and to categorize participants in low, moderate, and severe risk of mortality. Data regarding mortality, institutionalization, rehospitalization, and use of home care services were recorded through administrative information.
Results: Altogether, 1,140 hospitalized patients (mean age 84.1 years, women = 60.8%) were included. In the multivariable analysis, compared to
patients with low risk group at admission, patients in moderate (odds ratio [OR] = 3.32; 95% CI: 1.79–6.17; p < .001) and severe risk (OR = 10.72, 95% CI: 5.70–20.18, p < .0001) groups were at higher risk of overall mortality. Among the 984 older patients with follow-up data available, those in the severe-risk group experienced a higher risk of overall mortality, institutionalization, rehospitalization, and access to home care services.
Conclusions: In this cohort of hospitalized older adults, higher MPI values are associated with higher mortality and other negative outcomes.
Multidimensional assessment of older people admitted to hospital may facilitate appropriate clinical and postdischarge management.
Keywords: Multidimensional Prognostic Index; Prognosis; Hospital; Cohort study; Aged
Introduction
Increasing attention has been paid to the correct identification of mortality prognostic tools to help clinical decision making in diag-nostics and therapeutics and to tailor appropriate interventions for the older frail patient (1).
Older adults are characterized by heterogeneous health status and health and functional trajectories, especially in the last years of life (2). Accordingly, clinical practice recommendations increasingly suggest that clinical decisions regarding older patients, including, for example, cancer screening or glycemic control in diabetes mellitus treatment, should take into account patients’ life expectancy and/or prognosis for negative health outcomes (3,4).
The prognosis of complex older patients is not only ruled by the severity of individual diseases, but strongly related to the presence of multimorbidity and to the degree of physical, cognitive, biological, and social impairment (5). The comprehensive geriatric assessment (CGA), capable to effectively explore these domains, is the main tool to determine the prognosis of frail older persons (6). A systematic review of 16 common prognostic tools in geriatric medicine, how-ever, identified very few prognostic indices for mortality that meet the requirements of accuracy and calibration required to be used in different settings (7).
Among the indices used in the hospital setting, the Multidimensional Prognostic Index (MPI) (8) has been identified as a well-calibrated tool with a good discrimination and accuracy both for short and long-term mortality (9). Moreover, the MPI is the only one based on information obtained from a CGA that explores comprehensively not only health aspects, but also functional, cogni-tive, and nutritional domains, as well as cohabitation status, using standardized and extensively validated rating scales, widely known by the clinicians (8). The MPI significantly predicts mortality in older patients hospitalized for different reasons, but data to support this come mainly from retrospective studies (8–14).
The aim of this study was to prospectively evaluate whether the CGA-based MPI at admission to hospital is useful to identify dif-ferent mortality risk groups in terms of increased survival during 12 months of follow-up in a multicenter and longitudinal cohort study. Moreover, we investigated whether MPI at discharge is useful to predict other outcomes significantly associated with higher risk of mortality, such as institutionalization, rehospitalization, and use of home care services.
Methods
Study Population
This was an observational study conducted according to the World Medical Association’s 2008 Declaration of Helsinki, the guidelines for Good Clinical Practice, and the Strengthening the Reporting of Observational Studies in Epidemiology (STROBE) guidelines (15).
Inclusion criteria were the following: (a) age more than 65 years, (b) admitted to hospital for an acute medical condition or for a relapse of a chronic disease, (c) ability to provide an informed con-sent or availability of a proxy for informed concon-sent and willingness to participate in the study, and (d) complete CGA during hospitaliza-tion. Nine geriatric units across Europe and Australia were included. The recruitment period was from February 2015 to July 2016, with the end of 1-year follow-up in August 2017.
The ethical committees of each center approved this observa-tional study. Informed consent was given by participants who under-went initial evaluation and/or their proxies for their clinical records
to be used in this study. All patient records and information were anonymized and de-identified prior to the analysis.
Main Exposure: MPI
MPI was developed by the inclusion of information from eight dif-ferent domains of the CGA (8):
1. Functional status was evaluated by Katz’s Activities of Daily Living (ADL) index (16), which defines the level of dependence/ independence in six daily personal care activities (bathing, toilet-ing, feedtoilet-ing, dresstoilet-ing, urine and bowel continence, and transfer-ring) in and out of bed or chair.
2. Independence in the Lawton’s Instrumental Activities of Daily Living (IADL) (17), which assesses independence in eight activi-ties that are more cognitively and physically demanding than ADL, that is, managing finances, using telephone, taking medi-cations, hopping, using transportation, preparing meals, doing housework, and washing.
3. Cognitive status through the Short Portable Mental Status Questionnaire (SPMSQ) (18), a 10-item questionnaire investigat-ing orientation, memory, attention, calculation, and language; validated versions were used in each local language.
4. Comorbidity was examined using the Cumulative Illness Rating Scale (CIRS) (19). The CIRS uses a 5-point ordinal scale (score 1–5) to estimate the severity of pathology in each of 13 systems, including cardiac, vascular, respiratory, eye-ear-nose-throat, upper and lower gastrointestinal, hepatic, renal, genitourinary, musculo-skeletal, skin disorder, nervous system, endocrino-metabolic, and psychiatric behavioral disorders. On the basis of the ratings, the Comorbidity Index (CIRS-CI) score, which reflects the number of concomitant diseases, was derived from the total number of categories in which moderate or severe levels (grade from 3 to 5) of disease were identified (range from 0 to 13). Comorbidities, at hospital admission, were descriptively reported using the International Classification of Disease, Tenth Revision (20). 5. Nutritional status was investigated with the Mini Nutritional
Assessment–Short Form (MNA-SF) (9), which includes informa-tion on: (a) anthropometric measures (body mass index, weight loss), (b) neuropsychological problems and recent psychological stress, (c) mobility, and (d) decline in food intake.
6. Risk of developing pressure sores was evaluated through the Exton Smith Scale (ESS), a five-item questionnaire determining physical and mental condition, activity, mobility, and incontin-ence (21).
7. Medication use was defined according to the Anatomical Therapeutics Chemical Classification code system (ATC classi-fication) and the number of drugs used by patients at admission was recorded. Patients were defined as drug users if they took a medication included in the ATC classification at the moment of hospital admission.
8. Cohabitation status included living alone, in an institution, or with family members.
For each domain, a tripartite hierarchy was used, that is, 0 = no problems, 0.5 = minor problems, and 1 = major problems, based on conventional cutoff points derived from the literature for the singu-lar items. The sum of the calculated scores from the eight domains was divided by 8 to obtain a final MPI risk score ranging from 0 = no risk to 1 = higher risk of mortality. Also, the MPI was expressed as three grades of risk: MPI-1, low risk (MPI value ≤ 0.33); MPI-2, moderate risk (MPI value between 0.34 and 0.66); and MPI-3, high
risk (MPI value > 0.66) (8). MPI requires between 15 and 25 min-utes for its complete execution and the results can be automatically obtained through the program Calculate-MPI, which can be down-load for free by the www.mpiage.eu website. The program is an.exe file and allows to run out the tests to obtain the numeric value of the single domain (ADL, IADL, SPMSQ, CIRS, MNA, ESS, drugs, cohabitation) as well as the final MPI score. Tests are available also in printable PDF format, as shown in the Supplementary Material.
Main Outcomes
Participants were followed for 12 months from hospital discharge and mortality was categorized as in-hospital (if it happened in the index hospital admission) or postdischarge. Vital status was assessed, when appropriate, by consulting the Registry Offices of the cities in which the patients were residents at the time of the evaluation.
Overall mortality (as sum of in-hospital and 1 year, at home) was considered as primary outcome of our research. Institutionalization, rehospitalization, and access to home care services were considered as secondary end points. These outcomes were investigated using admin-istrative data and phone interviews with patients and/or caregivers.
Statistical Analysis
A sample size of 1,000 participants was deemed sufficient, assuming a fixed Type I error alpha of 5% and a statistical power of 80%,
to detect an increase in mortality at 1 year equivalent to a risk of at least 36% for those participants classified as MPI-2 and at least 37% for those participants classified as MPI-3, set the MPI class 1 as the reference. One-year mortality was taken for the reference class equal to 10% (22).
General characteristics were reported as frequencies (percent-ages) and mean ± standard deviation, for categorical and con-tinuous variables, respectively. Mortality incidence rates were computed as the number of deaths per person-year. Comparisons across MPI categories were performed using the Kruskal–Wallis test for singly ordered contingency tables, and linear by lin-ear association test, for categorical and continuous variables, respectively.
Logistic binary regression analysis was run, taking MPI at ad-mission (in categories or as increase in 0.1 points) as exposure and overall (in-hospital + postdischarge) mortality, in-hospital mortality, and postdischarge (1-year) follow-up mortality as outcomes. The strength of the association between MPI at admission and these outcomes were reported as odds ratios (ORs) with 95% confidence intervals (CIs), adjusted for age, gender, center, and primary diag-nosis. We also reported the adjusted risk that come from the adjusted predicted probability of the outcome of interest for each level of MPI, when the other covariates in the model are at their means. For all the outcomes, receiver operator characteristic curves were ana-lyzed to compare the sensitivity and specificity of MPI in predicting
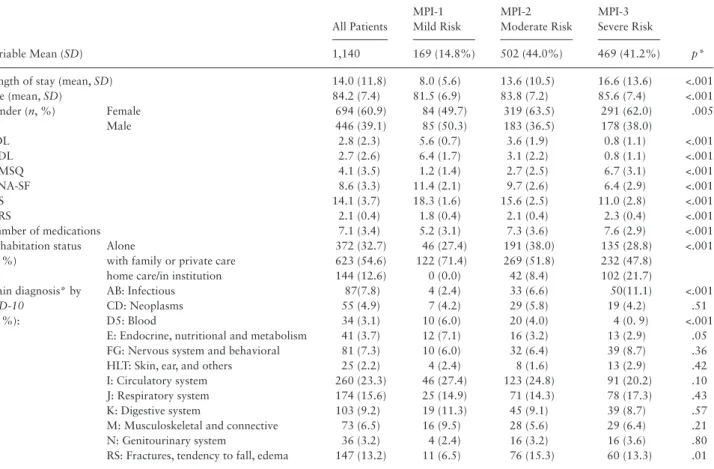
Table 1. General Characteristics of Older Patients at Baseline According to MPI Grade
Variable Mean (SD) All Patients MPI-1 Mild Risk MPI-2 Moderate Risk MPI-3 Severe Risk p* 1,140 169 (14.8%) 502 (44.0%) 469 (41.2%)
Length of stay (mean, SD) 14.0 (11.8) 8.0 (5.6) 13.6 (10.5) 16.6 (13.6) <.001
Age (mean, SD) 84.2 (7.4) 81.5 (6.9) 83.8 (7.2) 85.6 (7.4) <.001 Gender (n, %) Female 694 (60.9) 84 (49.7) 319 (63.5) 291 (62.0) .005 Male 446 (39.1) 85 (50.3) 183 (36.5) 178 (38.0) ADL 2.8 (2.3) 5.6 (0.7) 3.6 (1.9) 0.8 (1.1) <.001 IADL 2.7 (2.6) 6.4 (1.7) 3.1 (2.2) 0.8 (1.1) <.001 SPMSQ 4.1 (3.5) 1.2 (1.4) 2.7 (2.5) 6.7 (3.1) <.001 MNA-SF 8.6 (3.3) 11.4 (2.1) 9.7 (2.6) 6.4 (2.9) <.001 ESS 14.1 (3.7) 18.3 (1.6) 15.6 (2.5) 11.0 (2.8) <.001 CIRS 2.1 (0.4) 1.8 (0.4) 2.1 (0.4) 2.3 (0.4) <.001 Number of medications 7.1 (3.4) 5.2 (3.1) 7.3 (3.6) 7.6 (2.9) <.001 Cohabitation status (n, %) Alone 372 (32.7) 46 (27.4) 191 (38.0) 135 (28.8) <.001
with family or private care home care/in institution
623 (54.6) 122 (71.4) 269 (51.8) 232 (47.8) 144 (12.6) 0 (0.0) 42 (8.4) 102 (21.7) Main diagnosis* by ICD-10 (n, %): AB: Infectious 87(7.8) 4 (2.4) 33 (6.6) 50(11.1) <.001 CD: Neoplasms 55 (4.9) 7 (4.2) 29 (5.8) 19 (4.2) .51 D5: Blood 34 (3.1) 10 (6.0) 20 (4.0) 4 (0. 9) <.001
E: Endocrine, nutritional and metabolism 41 (3.7) 12 (7.1) 16 (3.2) 13 (2.9) .05
FG: Nervous system and behavioral 81 (7.3) 10 (6.0) 32 (6.4) 39 (8.7) .36
HLT: Skin, ear, and others 25 (2.2) 4 (2.4) 8 (1.6) 13 (2.9) .42
I: Circulatory system 260 (23.3) 46 (27.4) 123 (24.8) 91 (20.2) .10
J: Respiratory system 174 (15.6) 25 (14.9) 71 (14.3) 78 (17.3) .43
K: Digestive system 103 (9.2) 19 (11.3) 45 (9.1) 39 (8.7) .57
M: Musculoskeletal and connective 73 (6.5) 16 (9.5) 28 (5.6) 29 (6.4) .21
N: Genitourinary system 36 (3.2) 4 (2.4) 16 (3.2) 16 (3.6) .80
RS: Fractures, tendency to fall, edema 147 (13.2) 11 (6.5) 76 (15.3) 60 (13.3) .01
Notes: ADL = Activities of Daily Living; CIRS = Comorbidity Index Rating Scale; ESS = Exton-Smith Scale; IADL = Instrumental Activities of Daily Living; ICD-10 = International Classification Disease, Tenth Revision; MNA-SF = Mini Nutritional Assessment–Short Form; SD = standard deviation; SPMSQ = Short Portable Mental Status Questionnaire
*Diagnosis was missing in 24 patients.
these negative outcomes, measuring the relative area under the curve with the correspondent 95% CI.
After excluding people dead during hospitalization and those with no data at follow-up, in secondary analyses, MPI at discharge was used for analyses having overall mortality, institutionalization, rehospitalization, and access to home care services as outcomes.
Two-sided alternatives with a significance level (alpha = 0.05) were considered for all the tests. STATA 12 (Stata Statistical Software: Release 12; StataCorp, College Station, TX) software was used.
Results
Characteristics of the Study Population
The study population included 1,140 hospitalized patients (mean age 84.2 ± 7.4 years, women = 60.8%).
Table 1 shows the characteristics of participants according to their MPI grade at admission: 169 patients (14.8%) were in the MPI-1 (mild risk of mortality group), 502 patients (44.0%) in the MPI-2 (moderate-risk group), and 469 patients (41.2%) in the MPI-3 (severe risk). Participants with higher MPI values (ie, MPI-3, severe risk) were more likely to be females (p = .005) and older (p < .001) as well as of having significantly worse scores in all the domains considered in the MPI, as expected (p < .001 for all comparisons). Participants clas-sified in the MPI-3 group (high risk) lived more frequently in institu-tions (p < .001) and had a longer length of stay in hospital (p < .001). Regarding main diagnoses at hospital discharge, participants included in the higher MPI-risk group had a significant higher prevalence of infectious diseases (p < .001) or fractures/tendency to fall (p = .01) than participant included in the MPI-1 low-risk group.
MPI at Admission and Mortality
Table 2 shows the association between MPI (at admission) and mor-tality. In the multivariate analysis, taking participants in the low-risk group as reference, those in the moderate (OR = 3.32, 95% CI: 1.79–6.17, p < .001) and high-risk groups (OR = 10.72, 95% CI: 5.70–20.18, p < .001) were at significantly higher risk of mortal-ity. Similar findings were evident when taking postdischarge (1-year) and in-hospital mortality as outcomes.
Modelling MPI at admission as continuous variable, each increase in 1 decimal point in MPI at admission was significantly associated with a higher risk of overall (OR = 1.60, 95% CI: 1.45–1.76, p < .001), in-hospital mortality (OR = 1.54, 95% CI: 1.29–1.86, p < .001), and postdischarge (1-year) mortality (OR = 1.57, 95% CI: 1.42–1.74, p < .001) (Table 2).
Finally, MPI had a good discriminatory power for all the end points considered, as showed by the correspondent values of area under the curves reported in Table 2 being 0.77 (95% CI: 0.74–0.80; Figure 1a) for overall mortality, 0.79 (95% CI: 0.73–0.85; Figure 1b) for in-hospital mortality, and 0.76 (95% CI: 0.73–0.79; Figure 1c) for 1-year mortality.
Prognostic Value of MPI at Hospital Discharge
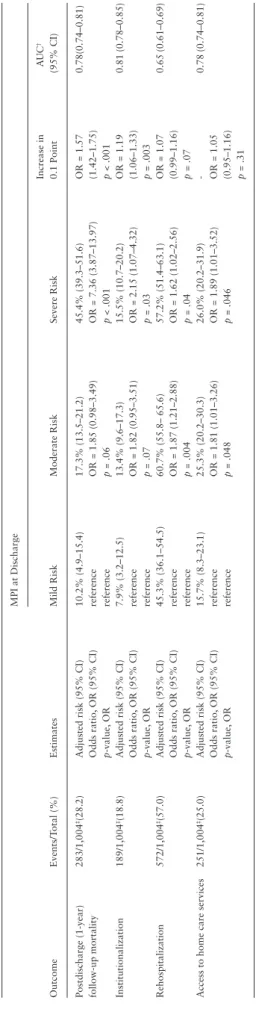
In 984 older participants, the MPI was available also at discharge. During hospitalization, MPI improved (ie, delta MPI < 0) in 350 participants (35.6%), worsened in 264 participants (ie, delta MPI > 0; 26.8%) whereas MPI did not change in 370 participants (ie, delta MPI = 0; 37.6%). As reported in Table 3, taking those with MPI-1 mild risk as reference and after adjusting the analyses for potential confounders, participants in the severe-risk group at discharge
expe-rienced a higher risk of mortality (OR = 7.36, 95% CI: 3.87–13.97, Table 2.
L
ogistic R
egression on Baseline MPI Influencing Mor
tality Risk in Hospitaliz
ed Older P atients Outcome Events/T otal (%) Estimates MPI at Admission Mild Risk Moderate Risk Severe Risk Increase in 0.1 Point AU C † (95% CI)
Overall (in-hospital + post discharge) mortality
358/1,140 (31.4)
Adjusted risk (95% CI)
8.0% (3.7–12.2) 22.4% (18.3–26.5) 48.2% (42.7–53.7) OR = 1.60 (1.45–1.76) p < .001 0.77 (0.74–0.80) Odds ratio, OR (95% CI) reference 3.32 (1.79–6.17) 10.72 (5.70–20.18) p-value, OR reference p < .001 p < .001 In-hospital mortality 75/1,140 (6.6)
Adjusted risk (95% CI)
0.7% (0.0–1.7) 2.5% (1.2–3.9) 6.4% (3.9–9.0) OR = 1.54 (1.29–1.86) P < .001 0.79 (0.73–0.85) Odds ratio, OR (95% CI) reference OR = 3.78 (0.81–17.66) OR = 9.99 (2.18–45.80) p-value, OR reference p = .09 p = .003
Postdischarge (1-year) follow-up mortality
283/1,004
‡(31.4)
Adjusted risk (95% CI)
6.9% (3.0–10.9) 19.1% (15.2 – 23.0) 42.8% (37.1–48.5) OR = 1.57 (1.42–1.74) p < .001 0.76 (0.73–0.79) Odds ratio, OR (95% CI) reference OR = 3.17 (1.64–6.13) OR = 10.04 (5.12–19.68) p-value, OR reference p = .001 p < .001 Notes
: All data (except for
A
UCs) are reported as odds ratios (ORs) are adjusted for age,
gender
, center
, and primary diagnosis.
A
UC
=
area under the curve; CI
=
confidence intervals; MPI
=
Multidimensional Prognostic
Index.
†A
UCs were related to model with MPI in category
.
‡75 participants were dead during hospitalization and 61 were lost at the follow-up.
p < .001), institutionalization (OR = 2.15, 95% CI: 1.07–4.32, p = .03), rehospitalization (OR = 1.62, 95% CI: 1.02–2.56, p = .04), and access to home care services (OR = 1.89, 95% CI: 1.01–3.52, p = .046) (Table 3). Using the MPI at discharge as continuous vari-able did not significantly change our findings (Table 3).
Similarly to MPI at admission, MPI at discharge had a good dis-criminatory power for all the end points considered, as showed by the correspondent values of area under the curves ranging from 0.65 (95% CI: 0.61–0.69) for rehospitalization to 0.81 (0.79–0.85) for institutionalization (Table 3).
Discussion
In this real-world prospective observational study of a large cohort of hospitalized older individuals in different countries with different health care systems, we found that MPI was a significant predictor not only of mortality (both short and long term), but also of other negative outcomes, such as institutionalization, rehospitalization, and higher use of home care services. MPI showed a good discriminatory power and accuracy in predicting all the end points included in our investigation.
Because of the expansion in number of old and very old patients in the population, a progressively larger percentage of the hospital-ized patients are old and frail. The development of prognostic tools appropriate for the evaluation of hospitalized older patients is cap-turing increasing attention. Recent guidelines suggest to incorpor-ate life expectancy as a key factor in weighing the benefits and the burdens of both diagnostic and therapeutic interventions (23–26). Prognostic indices may offer an important tool to the clinician for better understanding the appropriate clinical decision making for older adults (5). It is widely known that failure to consider prognosis in the context of clinical decision making can lead to poor care (4). For example, hospice is often underutilized for patients with non-malignant yet life-threatening diseases (27), whereas healthy older patients with good prognosis have low rates of cancer screening pre-cluding them early interventions (7,28). Thus, simple and reliable tools for the estimation of the prognosis of the older patients are needed to tailor clinical management of older patients.
The MPI has been validated in more than 12,000 older patients with acute or relapses of chronic conditions (such as pneumonia, heart failure, gastrointestinal bleeding, chronic renal failure, liver cir-rhosis, dementia, and transient ischemic attack, using mortality as outcome (22,29). A previous multicenter study, involving more than 2,000 hospitalized older patients, has shown that MPI is a more ac-curate prognostic predictor than three frailty indices commonly used in clinical practice for mortality (30). Even if of importance, these data were derived from already collected retrospective data (8–14). The research reported here was specifically designed and conducted
Figure 1. Receiver operating characteristic (ROC) curves for baseline Multidimensional Prognostic Index (MPI) in predicting overall (a), in-hospital (b), and 1-year (c) mortality.
Table 3.
L
ogistic R
egression on MPI at Disc
harge and Neg
ati ve Outcomes in Hospitaliz ed Older P atients Outcome Events/T otal (%) Estimates
MPI at Discharge Mild Risk
Moderate Risk Severe Risk Increase in 0.1 Point AU C † (95% CI)
Postdischarge (1-year) follow-up mortality
283/1,004
‡(28.2)
Adjusted risk (95% CI)
10.2% (4.9–15.4) 17.3% (13.5–21.2) 45.4% (39.3–51.6) OR = 1.57 (1.42–1.75) p < .001 0.78(0.74–0.81) Odds ratio, OR (95% CI) reference OR = 1.85 (0.98–3.49) OR = 7.36 (3.87–13.97) p-value, OR reference p = .06 p < .001 Institutionalization 189/1,004 ‡(18.8)
Adjusted risk (95% CI)
7.9% (3.2–12.5) 13.4% (9.6–17.3) 15.5% (10.7–20.2) OR = 1.19 (1.06–1.33) p = .003 0.81 (0.78–0.85) Odds ratio, OR (95% CI) reference OR = 1.82 (0.95–3.51) OR = 2.15 (1.07–4.32) p-value, OR reference p = .07 p = .03 Rehospitalization 572/1,004 ‡(57.0)
Adjusted risk (95% CI)
45.3% (36.1–54.5) 60.7% (55.8– 65.6) 57.2% (51.4–63.1) OR = 1.07 (0.99–1.16) p = .07 0.65 (0.61–0.69) Odds ratio, OR (95% CI) reference OR = 1.87 (1.21–2.88) OR = 1.62 (1.02–2.56) p-value, OR reference p = .004 p = .04
Access to home care services
251/1,004
‡(25.0)
Adjusted risk (95% CI)
15.7% (8.3–23.1) 25.3% (20.2–30.3) 26.0% (20.2–31.9) - OR = 1.05 (0.95–1.16) p = .31 0.78 (0.74–0.81) Odds ratio, OR (95% CI) reference OR = 1.81 (1.01–3.26) OR = 1.89 (1.01–3.52) p-value, OR reference p = .048 p = .046 Notes
: All data (except for
A
UCs) are reported as odds ratios (ORs) are adjusted for age,
gender
, center
, and primary diagnosis.
A
UC
=
area under the curve; CI
=
confidence intervals; MPI
=
Multidimensional Prognostic
Index.
†A
UCs were related to model with MPI in category
.
‡75 participants were dead during hospitalization and 61 were lost at the follow-up.
to confirm the retrospective findings mentioned before. We con-firmed that the MPI is significantly associated with a higher risk of mortality in older hospitalized patients. Compared to the previous works regarding MPI, the prospective design can overcome the in-trinsic limitations of retrospective studies, in particular recall bias of the participants, the absence of a priori hypothesis and, sometimes, the presence of missing data not recorded at the baseline (31).
Another finding of our research is that the MPI score confirms to be sensitive to variations of health status during hospitalization. Indeed, in almost 1,000 hospitalized participants with data at dis-charge, more than one third had a substantial improvement in their MPI score, whereas in about one fourth we observed a worsening. These findings confirm previous results that MPI is able to capture the modifications of the patient clinical conditions over hospital stay (32) and suggest that it could be used to monitor the effectiveness of interventions in hospitalized older patients.
This work for the first time reports that MPI is a significant pre-dictor not only of mortality, but also of other negative outcomes of public health importance in older people, such as rate of institution-alization, rehospitinstitution-alization, and use of home care services. These find-ings might be of importance for clinicians and health care managers in order to identify not only people at higher mortality risk, but also those with specific needs of health or social care. Although one third of the patients included in our analyses died during the 1 year of follow-up, more than 50% were rehospitalized and about one quar-ter were placed in nursing home or needed home-care services. As our study found that the risk of these negative outcomes significantly increases with the increase of MPI score, our findings suggest that MPI could be used for identifying people with potentially higher care needs. Very interesting, MPI accurately predicts the negative health outcomes independently from the different health and social care organizations of the participant centers and countries. As these results were based on a large multicenter study, without selective exclusion criteria, with different causes of admission to the hospital and conse-quently including patients observed in daily practice, we also believe that MPI could be considered as having a good external validity and so applied for better following patients after their discharge at home.
The findings of our study should be interpreted within its limi-tations. First, the follow-up of these patients was limited to 1 year; therefore, we cannot exclude that significant differences in predicting negative outcomes by MPI in older patients with different mortality risk could emerge with longer follow-up. Moreover, we did not include the competing risk by death for the analysis of the secondary out-comes, possibly introducing a bias. Second, even if the power of MPI in detecting negative outcomes may be considered good (1,5), the area under the curves were lower than 0.90, thus suggesting unexplained variation in mortality. However, it should be noted that other indices that commonly drive clinical decisions, such as the congestive heart failure, hypertension, age >75 years, diabetes mellitus, prior stroke 2 or transient ischemic attak, or thromboembolism (CHADS2) index to help determine warfarin therapy (33), the Framingham risk score to help determine lipid therapy (34), and the thrombolysis in myocardial infarction risk score to help determine invasive therapy for unstable angina (35), had similar values in C-index. Finally, even if most of the scales included in the MPI are well known and routinely collected by health care professionals involved in many geriatric programs, it is pos-sible that in other settings the execution of the MPI can require a spe-cific training and more time than that reported in the present study.
In conclusion, in this large cohort of hospitalized older adults, a significant association between higher MPI values and higher all-cause mortality and other negative outcomes was found, over 1 year
of follow-up. These findings clearly indicate the value of assessing older people admitted to hospital in order to choose the most appro-priate clinical management for these individuals. Therefore, future randomized controlled trials with different kinds of multidimen-sional interventions and including a consistent part of people having different degrees of frailty are needed to confirm or not the present observations.
Supplementary Material
Supplementary data is available at The Journals of Gerontology, Series A: Biological Sciences and Medical Sciences online.
Funding
This work was supported by the MPI_AGE European project co-funded by the Consumers, Health, Agriculture, and Food Executive Agency (CHAFEA) in the frame of the European Innovation Partnership on Active and Healthy Ageing Second Health Programme 2008–2013. The contents of this article are the sole responsibility of the authors and can under no circumstances be regarded as reflecting the position of the European Union. The funding agen-cies had no role in design or conduct of the study; collection, management, analysis, and interpretation of the data; and preparation, review, or approval of the manuscript. The study was based on administrative data sets, and the participants were not identifiable to the authors.
Acknowledgements
MPI_AGE Investigators: Clarissa Musacchio (1), Romina Custureri (1), Matteo Simonato (2), Mario Durando (2), Carmen Miret-Corchado (3), Beatriz Montero-Errasquin (3), Anna Meyer (4), Dirk Hoffmann (4), Ralf-Joachim Schulz (4), Lisanne Tap (5), Angelique Egberts (5), Marie-Laure Bureau (6, 7), Thomas Brunet (6, 7), Evelyne Liuu (6, 7), Helena Michalkova (8), Pavla Madlova (8), Daniele Sancarlo (9), Grazia D’Onofrio (9), Kimberley Ruxton (10).
Conflict of Interest Statement
None declared.
References
1. Siontis GC, Tzoulaki I, Ioannidis JP. Predicting death: an empirical evalu-ation of predictive tools for mortality. Arch Intern Med. 2011;171:1721– 1726. doi:10.1001/archinternmed.2011.334
2. Gill TM, Gahbauer EA, Han L, Allore HG. Trajectories of disability in the last year of life. N Engl J Med. 2010;362:1173–1180. doi:10.1056/ NEJMoa0909087
3. Schoenborn NL, Bowman TL II, Cayea D, Pollack CE, Feeser S, Boyd C. Primary care practitioners’ views on incorporating long-term prog-nosis in the care of older adults. JAMA Intern Med. 2016;176:671–678. doi:10.1001/jamainternmed.2016.0670
4. Lee SJ, Leipzig RM, Walter LC. Incorporating lag time to benefit into prevention decisions for older adults. JAMA. 2013;310:2609–2610. doi:10.1001/jama.2013.282612
5. Gill TM. The central role of prognosis in clinical decision making. JAMA. 2012;307:199–200. doi:10.1001/jama.2011.1992
6. Pilotto A, Cella A, Pilotto A, et al. Three decades of comprehensive geri-atric assessment: evidence coming from different healthcare settings and specific clinical conditions. J Am Med Dir Assoc. 2017;18:192.e1–192. e11. doi:10.1016/j.jamda.2016.11.004
7. Yourman LC, Lee SJ, Schonberg MA, Widera EW, Smith AK. Prognostic indices for older adults: a systematic review. JAMA. 2012;307:182–192. doi:10.1001/jama.2011.1966
8. Pilotto A, Ferrucci L, Franceschi M, et al. Development and validation of a multidimensional prognostic index for one-year mortality from compre-hensive geriatric assessment in hospitalized older patients. Rejuvenation Res. 2008;11:151–161. doi:10.1089/rej.2007.0569
9. Sancarlo D, D’Onofrio G, Franceschi M, et al. Validation of a Modified-Multidimensional Prognostic Index (m-MPI) including the Mini Nutritional Assessment Short-Form (MNA-SF) for the prediction of one-year mortality in hospitalized elderly patients. J Nutr Health Aging. 2011;15:169–173. 10. Bureau ML, Liuu E, Christiaens L, et al.; MPI_AGE Project Investigators.
Using a multidimensional prognostic index (MPI) based on comprehen-sive geriatric assessment (CGA) to predict mortality in elderly undergoing transcatheter aortic valve implantation. Int J Cardiol. 2017;236:381–386. doi:10.1016/j.ijcard.2017.02.048
11. Pilotto A, Addante F, Ferrucci L, et al. The multidimensional prognostic index predicts short- and long-term mortality in hospitalized geriatric patients with pneumonia. J Gerontol A Biol Sci Med Sci. 2009;64:880– 887. doi:10.1093/gerona/glp031
12. Pilotto A, Addante F, Franceschi M, et al. Multidimensional Prognostic Index based on a comprehensive geriatric assessment predicts short-term mortality in older patients with heart failure. Circ Heart Fail. 2010;3:14– 20. doi:10.1161/CIRCHEARTFAILURE.109.865022
13. Sancarlo D, Pilotto A, Panza F, et al. A Multidimensional Prognostic Index (MPI) based on a comprehensive geriatric assessment predicts short- and long-term all-cause mortality in older hospitalized patients with transient ischemic attack. J Neurol. 2012;259:670–678. doi:10.1007/s00415-011-6241-4 14. Volpato S, Bazzano S, Fontana A, Ferrucci L, Pilotto A; MPI-TriVeneto
Study Group. Multidimensional Prognostic Index predicts mortality and length of stay during hospitalization in the older patients: a multicenter prospective study. J Gerontol A Biol Sci Med Sci. 2015;70:325–331. doi:10.1093/gerona/glu167
15. von Elm E, Altman DG, Egger M, Pocock SJ, Gøtzsche PC, Vandenbroucke JP; STROBE Initiative. The Strengthening the Reporting of Observational Studies in Epidemiology (STROBE) statement: guidelines for reporting observational studies. J Clin Epidemiol. 2008;61:344–349. doi:10.1016/j. jclinepi.2007.11.008
16. Katz S, Downs TD, Cash HR, Grotz RC. Progress in development of the index of ADL. Gerontologist. 1970;10:20–30.
17. Lawton MP, Brody EM. Assessment of older people: self-maintaining and Instrumental Activities of Daily Living. Gerontologist. 1969;9:179–186. doi:10.1093/geront/9.3_Part_1.179
18. Pfeiffer E. A Short Portable Mental Status Questionnaire for the assess-ment of organic brain deficit in elderly patients. J Am Geriatr Soc. 1975;23:433441. doi:10.1097/00006199-199911000-00009
19. Linn BS, Linn MW, Gurel L. Cumulative illness rating scale. J Am Geriatr Soc. 1968;16:622–626. doi:10.1111/j.1532-5415.1968.tb02103.x 20. Harris ST, Zeng X, Ross T, Ford L. International Classification of Diseases,
10th Revision training: what coders are saying. Health Care Manag (Frederick). 2014;33:91–93. doi:10.1097/HCM.0b013e3182a9d640 21. Bliss MR, McLaren R, Exton-Smith AN. Mattresses for preventing
pres-sure sores in geriatric patients. Mon Bull Minist Health Public Health Lab Serv. 1966;25:238–268.
22. Pilotto A, Panza F, Ferrucci L. A multidimensional prognostic index in common conditions leading to death in older patients. Arch Intern Med. 2012;172:594; discussion 594–595. doi:10.1001/ archinternmed.2011.1891
23. Brown AF, Mangione CM, Saliba D, Sarkisian CA; California Healthcare Foundation/American Geriatrics Society Panel on Improving Care for Elders with Diabetes. Guidelines for improving the care of the older person with diabetes mellitus. J Am Geriatr Soc. 2003;51 (suppl 5 Guidelines):S265–S280. doi:10.1046/j.1532-5415.51.5s.1.x
24. Force USPST. Colon cancer screening (USPSTF recommendation). U.S. Preventive Services Task Force. J Am Geriatr Soc. 2000;48:333–335. 25. Mottet N, Bellmunt J, Bolla M, et al. EAU-ESTRO-SIOG guidelines on
pros-tate cancer. Part 1: screening, diagnosis, and local treatment with curative intent. Eur Urol. 2017;71:618–629. doi:10.1016/j.eururo.2016.08.003 26. Freedman RA, Keating NL, Pace LE, Lii J, McCarthy EP, Schonberg MA.
Use of surveillance mammography among older breast cancer survivors by life expectancy. J Clin Oncol. 2017;35:3123–3130. doi:10.1200/ JCO.2016.72.1209
27. Casarett D, Karlawish J, Morales K, Crowley R, Mirsch T, Asch DA. Improving the use of hospice services in nursing homes: a ran-domized controlled trial. JAMA. 2005;294:211–217. doi:10.1001/ jama.294.2.211
28. Walter LC, Covinsky KE. Cancer screening in elderly patients: a frame-work for individualized decision making. JAMA. 2001;285:2750–2756. 29. Pilotto A, Sancarlo D, Daragjati J, Panza F. Perspective: the challenge
of clinical decision-making for drug treatment in older people. The role of multidimensional assessment and prognosis. Front Med (Lausanne). 2014;1:61. doi:10.3389/fmed.2014.00061
30. Pilotto A, Rengo F, Marchionni N, et al.; FIRI-SIGG Study Group. Comparing the prognostic accuracy for all-cause mortality of frailty instruments: a multicentre 1-year follow-up in hospitalized older patients. PLoS One. 2012;7:e29090. doi:10.1371/journal.pone.0029090
31. Vandenbroucke JP. Observational research, randomised trials, and two views of medical science. PLoS Med. 2008;5:e67. doi:10.1371/journal. pmed.0050067
32. Volpato S, Daragjati J, Simonato M, Fontana A, Ferrucci L, Pilotto A. Change in the multidimensional prognostic index score during hospitaliza-tion in older patients. Rejuvenahospitaliza-tion Res. 2016;19:244–251. doi:10.1089/ rej.2015.1715
33. Rietbrock S, Heeley E, Plumb J, van Staa T. Chronic atrial fibrillation: incidence, prevalence, and prediction of stroke using the Congestive heart failure, Hypertension, Age >75, Diabetes mellitus, and prior Stroke or transient ischemic attack (CHADS2) risk stratification scheme. Am Heart J. 2008;156:57–64. doi:10.1016/j.ahj.2008.03.010
34. D’Agostino RB Sr, Grundy S, Sullivan LM, Wilson P; CHD Risk Prediction Group. Validation of the Framingham coronary heart disease predic-tion scores: results of a multiple ethnic groups investigapredic-tion. JAMA. 2001;286:180–187.
35. Antman EM, Cohen M, Bernink PJ, et al. The TIMI risk score for unstable angina/non-ST elevation MI: a method for prognostication and thera-peutic decision making. JAMA. 2000;284:835–842.