Index
1. Introduction and literature review ... 3
2. Numerical Models and methods ... 5
2.1 General Considerations ... 5
2.2 Numerical Methods ... 6
2.3 Turbulence Models ... 6
3. Flow Blockage in the open square ELSY FA ... 7
3.1 ELSY FA CFD Model ... 7
3.2 ELSY FA Results ... 9
3.2.1 Nominal unperturbed solution ... 9
3.2.2 A deep analysis of the case ββββ=0.2, lead ... 12
3.2.3 The effect of the flow blockage area fraction ββββ ... 17
3.2.4 The effect of Buoyancy ... 21
3.2.5 The Effect of the Reynolds number (flow) ... 22
3.2.6 The Effect of the Prandtl number (fluid)... 24
3.2.7 Transient behavior ... 29
4. Flow Blockage in the hexagonal wrapped ALFRED FA ... 30
4.1 ALFRED FA CFD Model ... 30
4.2 ALFRED FA RESULTS ... 34
4.2.1 Nominal unperturbed solution ... 34
4.2.2 A deep analysis of the case ββββ=0.2, lead ... 37
4.2.3 The effect of the flow blockage area fraction ββββ ... 42
4.2.3 The effect of the blockage position: central, intermediate, wall-neighbor ... 45
5. Conclusions ... 47
6. Nomenclature ... 48
1. Introduction and literature review
The flow blockage accident in a Fuel Assembly of a nuclear reactor consists in a partial or total occlusion of the flow passage area in a fuel sub-assembly. This leads in general to a reduced heat transfer in the FA and to a temperature peak in the clad which can eventually lead to the fusion of the clad itself. A partial blockage at the fuel assembly foot is generally not considered dangerous for the integrity of the FA, and it will not be considered here. The most likely blockage in a bundle is at the lower spacer grid, and, if the spacer grid is positioned in the active region, a remarkable effect can be evidenced and a possible damage can occur.
In principle, in this latter case, two different effects can be distinguished:
a. A local effect due to the stagnation-recirculation/wake region downstream the blockage, with
a local minimum of the heat transfer and a clad temperature peak;
b. A global effect due to the lower mass flow rate in the blocked subchannels; this fact leads to
an increase of the bulk fluid temperature with respect to the ‘unblocked’ regions and a consequent peak in the clad temperature at the end of the active region.
In figure 1, a very conceptual representation of the flow blockage accident is shown. The flow passes the obstacle and a recirculation region with relatively low velocities can be evidenced just downstream the blockage. This flow pattern leads the phenomenology described above as a local effect (a) and a global effect (b).
Figure 1 Schematic representation of a flow blockage.
As a consequence of the above considerations, the most critical (and conservative) case to be considered from the safety point of view is that of a blockage at the beginning of the active zone,
where the local effect (a) is present, and the global effect (b) is maximum because the entire active length is available to heat up the bulk temperature in the blocked subchannels.
In this report, numerical analysis will be presented on flow blockage in heavy liquid metal cooled fuel assemblies, and this has to be considered the main focus. Due to the crucial role of the heat transfer in the stagnation/recirculation wake region in this context, the turbulence level in this region must be assessed carefully. In fact, in the case where the turbulence thermal diffusion overcomes the molecular diffusion, the clad temperature peak downstream the blockage is largely independent by the nature of the fluid, i.e. by the Prandtl number. On the opposite, if the recirculation region is a ‘stagnation’ region with low turbulent heat transfer, the physical nature of the coolant, and in particular the Prandtl number, plays the major role in the assessment of the peak temperature. From the literature, it is not very clear which of the two options is the correct one, although some simplified theories assume that the turbulence dominates downstream the blockage and therefore the temperature peak is independent by the Reynolds and the Prandtl number. Probably, a systematic comparison between different coolants is missing and thus conclusions are dubious.
In any case, the short literature review will be focused on flow blockage studies in liquid metal cooled
bundles, i.e. sodium and lead, being the flow blockage phenomena in light water reactors a quite different matter because of the unity Prandtl number.
For the heavy liquid metal cooled GEN-IV reactors studied in these years by the scientific community, the flow blockage accident must be considered as one of the reference accidents, and probably the most dangerous for the core integrity. In fact, most of the know accident occurred in the LBE cooled fast reactors of the Russian nuclear submarines ‘alpha’, are apparently due to a flow blockage accident [1], [2].
An interesting review on flow blockage phenomena in LMFBR fuel assemblies is given in [3]. The paper gives a quite complete review of the investigations on flow blockage in sodium reactors and keeps into account all the technical and scientific development of ‘60s and ‘70s on sodium cooled fast reactors. The review especially refers to experimental and analytical investigations performed in United States and Germany, and the authors develop an analytical approach to predict the flow blockage effects.
The blockages at the foot of a fuel assembly tend to have insignificant effects in the fuel assembly unless flow is reduced grossly and therefore would be detectable in the case of closed FA.
The effect of blockage on reactor safety depends in principle on several factors: size and location of the blockage, nature of the coolant, fuel pin power, and coolant velocity in the assembly. In closed FA, blockages in flow channels will increase the hydraulic resistance and reduce the flow rate.
Experimental data on Clinch River Breeder Reactor (CRBR), the Fast-Flux test facility (FFTF), and the German Sodium-cooled fast Reactor (SNR) are provided in the review. CRBR and FFTF have 217 fuel pins each assembly and are wire-wrapped spaced, while SNR FA consists of 169 pins in a triangular lattice, grid-spaced, and enclosed in a hexagonal wrap. The SNR is particularly interesting for our purposes, because the reference configurations for a Lead Fast Reactor Demonstrator are grid-spaced.
With the typical approach of the ‘70s, Kirsch [4] developed a simplified theory to describe the thermo-fluid dynamic phenomena downstream the blockage. The basic assumption is that turbulent diffusion
dominates both for momentum and for energy, and thus the molecular heat transfer is negligible. With this hypothesis, the author shows that for sufficiently high Reynolds and Peclet numbers, the dimensionless temperature distribution in the wake is independent of the Reynolds and the Prandtl number, i.e. by the flow and the nature of the fluid. Comparison between experimental results in sodium and water seems to partially confirm these conclusions with a difference between the two fluids of 25%. This difference is probably due to the residual influence of the coolant. Therefore, according to the author, it could be possible to have a ‘universal’ dimensionless temperature profile function of the fraction β of the flow area blocked. From this point of view, the main difference between sodium and lead as coolant is the possible onset of boiling in sodium due to the lower boiling temperature (890 °C) with positive reactivity feedback and power excursion. In lead, with a boiling temperature of 1740 °C, this scenario is unlikely in the case of flow blockage.
It could be interesting to confirm or disconfirm these conclusions by CFD numerical simulations, i.e. by the direct solution of the Navier-Stokes equations. The only way to numerically investigate the flow blockage in realistic configurations is by the use of turbulence models, being DNS or LES not feasible at Reynolds numbers ∼105 typical of the fuel assemblies. The controversial point is the ability of the turbulence models to describe the turbulent heat transfer for liquid metal, but probably this issue has been too much emphasized in the last years, and the same turbulence models developed for unity Prandtl number fluids like ‘water’ can be largely used to compute turbulent heat transfer in low Prandtl number fluids with the same level of accuracy as in water. Moreover, the velocity fluctuations have the same nature in all the fluids, and thus the turbulence level in the wake region can be predicted for liquid metals with the same accuracy as in water. This latter prejudice justifies further theoretical studies [5, 6] in support of experimental results in the ‘80s, when computational tools were already available. Not so many CFD studies appeared in the 90’s and 00’ on the flow blockage in Liquid Metal cooled fast reactors, probably because of the decreasing importance of these kinds of reactors. In the last years, due to the growing interest in the developing of GEN-IV prototypes and Demonstrators, the interest in sodium-cooled and lead-cooled bundles is high again. Nevertheless, only a small number of CFD studies appeared in the literature and sometimes these studies adopted simplified models for the bundle (porous media) and the focus was on the whole reactor [7]. Generally, system codes like RELAP are commonly adopted by the safety analysts to compute flow blockage in reactor Fuel Assemblies [8], although the local nature of the phenomena involved does not fully justify this common practice.
2. Numerical Models and methods
2.1 General Considerations
From the arguments in section 1, it is evident that the flow blockage is basically a local phenomenon, and the main issue to investigate is the thermal-hydraulic behavior of the wake region downstream the obstacle which determines the clad temperature peak. For this reason, a local fully detailed CFD analysis has been carried out here to assess the problem. The active region of a single Fuel Assembly has been simulated with a short entry region to have fully developed flow at the beginning of the active region. In figure 1, the entry region, the blockage and the active region are shown in the case of the ELSY fuel assembly [9]. The viscous sub-layer has been resolved with several points in all the simulations presented here. A value of y+∼1 is guaranteed in the whole domain.
From a physical point of view, the reactivity feedback due to the temperature variation in the domain has not been considered at this stage. A constant power distribution has been considered as well, neglecting the axial power profile typical of the nuclear reactors. In addition, spacer grids have not been modeled being not very relevant for the phenomena to investigate. The computational domain includes the active region and a short non-active region downstream, to have fully developed flow at the beginning of the active region. Constant thermo-physical properties have been assumed for Lead at 450°C, according to table 1.
TABLE 1 PHYSICAL PROPERTIES OF LEAD AT 450 °C.
ρ [kg/m3] Density 10503
ν [m2/s] Kinematic viscosity 1.9·10-7
k [W/mK] Thermal Conductivity 17.15
cp [J/kgK] Specific heat at constant pressure 145.9
Pr Prandtl number 0.01697
α [1/K] Thermal expansion coefficient 1.137·10-4
The buoyancy term has been explicitly included in the momentum equation, due to the potential role of the local buoyancy in promoting heat transfer in the wake region. The exact production term in the kinetic energy equation has been included as well. Fully convergence has been reached in all the simulations presented in this paper.
2.2 Numerical Methods
The general purpose code ANSYS CFX 13 [10] was used for all the numerical simulations presented in this paper. The code employs a coupled technique, which simultaneously solves all the transport equations in the whole domain through a false time-step algorithm. The linearized system of equations is preconditioned in order to reduce all the eigenvalues to the same order of magnitude. The multi-grid approach reduces the low frequency error, converting it to a high frequency error at the finest grid level; this results in a great acceleration of convergence. Although, with this method, a single iteration is slower than a single iteration in the classical decoupled (segregated) SIMPLE approach, the number of iterations necessary for a full convergence to a steady state is generally of the order of 102, against typical values of 103 for decoupled algorithms.
2.3 Turbulence Models
The SST (Shear Stress Transport) k-ω model by Menter [11] is extensively used in this paper. It is formulated to solve the viscous sub-layer explicitly, and requires several computational grid points inside this latter. The model applies the k-ω model close to the wall, and the k-ε model (in a k-ω formulation) in the core region, with a blending function in between. It was originally designed to provide accurate predictions of flow separation under adverse pressure gradients, but has since been applied to a large variety of turbulent flows and is now the default and most commonly used model in CFX-13 and other CFD codes. This structural feature of the model to predict in a good way flow separation and recirculation gives a good confidence in applying the model to compute flow blockage in fuel subassemblies. The turbulent Prandtl number in the case of lead and sodium has been fixed to 1.1, according to the suggestion of the literature [12] and to the author’s experience [13].
3. Flow Blockage in the open square ELSY FA
3.1 ELSY FA CFD Model
The Fuel Assembly of the ELSY Lead cooled reactor [9] has been considered here as the first configuration to investigate. The fuel assembly is an open square lattice bundle with 21 rows, 428 rods, grid-spaced, with rod diameter d=10.5 mm, pitch to diameter ratio p/d=1.32 and an active length
L=0.9 m. The total thermal power of the reactor is Q~1500 MW.
A sketch of the fuel assembly seen from the top is shown in Figure 2, while in Table 2 the main geometrical and physical parameters for the ELSY FA are reported.
A flow blockage at the beginning of the active region has been considered here as the most critical case, for the reasons discussed in section 1. In Figure 1, the location of the blockage and the active region are shown.
For the correct description of the physical phenomena involved, the choice of the correct computational domain and boundary conditions is crucial. A wrong or superficial choice would lead to inaccurate or non-physical results. From a thermal-hydraulic point of view, the relevant feature of the open FA with respect to the wrapped FA is the possibility of transversal flows between neighbor sub-assemblies, and this fact could play a role especially in a flow blockage accident where the transversal flow could mitigate the clad temperature excursion. The inter fuel-assembly thermal-hydraulics of the ELSY FA has been investigated in some details in [14]. Moreover, in an open fuel assembly, any flow blockage does not alter significantly the FA mass flow rate and this circumstance respresents a relevant safety feature.
FIGURE 2 SKETCH OF THE ELSY FUEL ASSEMBLY SEEN FROM THE TOP.
TABLE 2 BASIC GEOMETRICAL AND THERMAL-HYDRAULIC PARAMETERS OF THE ELSY CORE.
Rod diameter d 10.5 mm
Pitch to diameter ratio p/d 1.3238 Subchannel Equivalent Diameter Deq 11.8 mm
Number of fuel rods 428
Clearance between assemblies 2.1 mm
Assembly pitch 294 mm
Mean Assembly Power 8.82 MW
Mean Rod Power 20.62 kW
Mean Wall Heat Flux qwall 0.7 MW/m2
Active Height L 0.9 m
Lead Inlet Temperature Tinlet 400 °C Lead Outlet Temperature Toutlet 480 °C
Lead Bulk Velocity 1.5 m/s
Clad Maximum Temperature (expected under nominal conditions)
550 °C Total number of FA in the CORE 170 Total Reactor Thermal Power 1500 MW
A sketch of the computational domain seen from the top is shown in Figure 3. The computational domain is chosen across 4 fuel sub-assembly, so that the boundary between one FA and the neighbor one is inside the domain and the cross-flow cannot be cut by artificial boundary conditions. The FA interested by the flow blockage is represented in green in Figure 3; the computational domain, seen from the top, is a triangle limited by the diagonal and two sizes, where symmetry boundary conditions have been imposed. The exact location of the blockage is not relevant because the fuel assemblies are open.
FIGURE 3 SKETCH OF THE COMPUTATIONAL DOMAIN USED FOR THE ELSY FUEL ASSEMBLY ANALYSIS.
A 3D view of the domain is shown in Figure 1. The blockage is located at the beginning of the active region (z=0.1 m), and an entry length 0.1 m, i.e. about 10 subchannel hydraulic diameters Deq, allows to have hydrodynamic fully developed flow at the beginning of the active region. The active region has a total length of 0.9 m.
Constant velocity (winlet=1.5 m/s), constant temperature (Tinlet=400 °C), boundary conditions have been imposed at the inlet coherently to the nominal data of Table 2, while pressure boundary conditions have been imposed at the outlet. At the walls in the active region, a constant heat flux qwall=0.7 MW/m2
has been imposed. These conditions have been imposed for all the cases simulated, for the reasons explained above.
The general simplified assumptions described in section 2.1 have been considered in all the computations, and the clearance between sub-assemblies has been neglected.
The computational mesh is multi-blocks fully structured with a resolution close to the wall of the order of y+∼1 for the nominal velocity of 1.5 m/s. A zoom of the computational grid seen from the top is shown in Figure 4. The plane mesh has been extruded along the vertical direction z, using 64 nodes in the active region and 16 nodes in the entry region. A suitable stretching close to the blockage has been introduced to correctly describe the thermal-hydraulic behavior of the wake region. The total number of nodes is around 11.8·106.
FIGURE 4 ZOOM OF THE COMPUTATIONAL MESH FOR THE ELSY FA.
3.2 ELSY FA Results
3.2.1 Nominal unperturbed solution
The nominal unperturbed solution without any blockage is analyzed as a reference to check if the model looks reasonable and to have the ‘zero point’ to evaluate the effect of the blockage. The case has been conventionally named U1.
Figure 5 shows the w vertical velocity contours in the transversal symmetry plane of the computational domain. It is remarkable that the flow becomes hydro-dynamically fully developed before the beginning of the active region, and it confirms that the mechanical entry length is less than 10 hydraulic diameters.
FIGURE 5: w VERTICAL VELOCITY CONTOURS IN THE TRANSVERSAL SYMMETRY PLANE FOR THE UNPERTURBED SOLUTION (U1) OF THE ELSY FA IN NOMINAL CONDITIONS.
The temperature contours in the transversal symmetry plane are shown in Figure 6. The overall vertical temperature gradient is clearly visible and the outlet bulk temperature is around 480 °C as it was expected from a simple thermal balance.
FIGURE 6 TEMPERATURE CONTOURS IN THE TRANSVERSAL SYMMETRY PLANE FOR THE UNPERTURBED SOLUTION OF THE ELSY FA IN NOMINAL CONDITIONS.
Figure 7 shows the pin wall temperature contours, in which the same large scale temperature gradient can be observed.
FIGURE 7 PIN WALL TEMPERATURE CONTOURS FOR THE UNPERTURBED SOLUTION OF THE ELSY FA IN NOMINAL CONDITIONS.
Figure 8 shows the vertical velocity contours in the XY mid-plane, where the small hydrodynamic boundary layer can be observed.
FIGURE 8 w VERTICAL VELOCITY CONTOURS IN A XY PLANE IN THE MIDDLE OF THE ACVTIVE ZONE (z=0.55m) FOR THE UNPERTURBED SOLUTION OF THE ELSY FA IN NOMINAL CONDITIONS.
Figure 9 shows the temperature contours in the XY mid-plane. It can be clearly observed a residual thermal coupling between subchannels with a non-uniform azimuthal wall temperature distribution. From post-processing, it can be computed that in the generic thermal fully developed section, the average difference between wall temperature and bulk temperature is around 24.1 K, while the average
heat transfer coefficient is h ~29040 W/m2K, for a corresponding Nusselt number Nu∼20.0 at the present Reynolds number Re ∼93000.
FIGURE 9 TEMPERATURE CONTOURS IN A XY PLANE IN THE MIDDLE OF THE ACVTIVE ZONE (Z=0.55M) FOR THE UNPERTURBED SOLUTION OF THE ELSY FA IN NOMINAL CONDITIONS.
3.2.2 A deep analysis of the case
β
β
β
β
=0.2, leadA detailed analysis is presented on flow and heat transfer in a flow blockage accident of the lead-cooled Fuel Assembly of ELSY. The area interested by the blockage is 20% of the total flow passage area. Defining the parameter β as the fraction of the total flow passage area interested by the blockage, in this case the parameter β=0.2. The case has been named conventionally as B2.
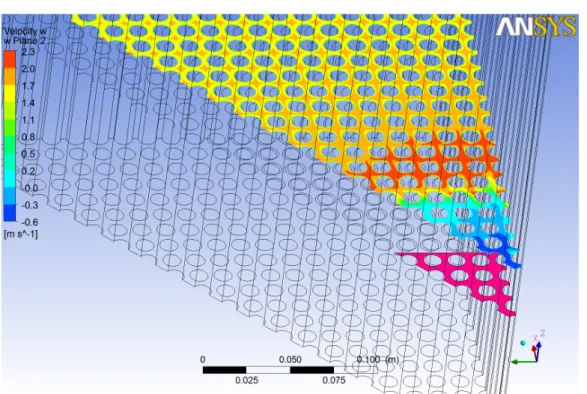
Figure 10 shows the vertical w velocity contours in the diagonal symmetry plane of the computational domain. Figure 11 represents a zoom view of the same field. From both figures, the recirculation region is well evident, and can be identified by the negative values of the vertical velocity w. It can be evidenced that the value of the recirculation velocity is w∼0.9 m/s, i.e. of the same order of the main stream velocity, and the recirculation region is not ‘stagnant’ but it is interested by a relevant turbulent flow, at least in the peripherals regions of the recirculating vortex. The w velocity contours in a plane located 35 mm downstream the blockage is shown in Figure 12; the azimuthal variation of the velocity field in the XY plane are not so strong and the diagonal symmetry plane of Figures 10 and 11 is fully representative of the whole domain.
A relevant feature is the flow acceleration in the unblocked subchannels close to the blocked ones, see Figure 11 and 12. This phenomenon is due to coolant mass flow rate of the blocked subchannels in the entry region which deviates towards the neighboring subchannels because of the obstacle.
The hydrodynamic features of the flow are well shown by Figure 13. The Figure shows the contours of the Eddy viscosity ratio in the diagonal symmetry plane, with the projected velocity vectors superimposed. The wake/recirculation region is clearly visible downstream the blockage. The
impressive evidence is that the eddy viscosity ratio (µt/µ), i.e. the ratio between the eddy viscosity µt and the dynamic molecular viscosity µ, is very high in the whole wake region, i.e. above 20, and it falls down below 10 only in limited regions close to some rods. The conclusion is that turbulence dominates momentum transfer in flow blockage conditions.
FIGURE 10 W VELOCITY CONTOURS IN THE TRANSVERSAL SYMMETRY PLANE FOR A FLOW BLOCKAGE OF THE ELSY FA, ββββ=0.2.
FIGURE 11 W VELOCITY CONTOURS IN THE TRANSVERSAL SYMMETRY PLANE FOR A FLOW BLOCKAGE OF THE ELSY FA, ββββ=0.2: ZOOM VIEW.
FIGURE 12 W VELOCITY CONTOURS IN A XY PLANE LOCATED 35 MM DOWNSTREAM THE BLOCKAGE.
Regarding heat transfer, the k-ω family turbulence model adopted in this context, uses, coherently with the classical turbulence theory, the well-known analogy between turbulent transport of momentum and energy, i.e. a Reynolds analogy re-proposed at a turbulence level; for the turbulent thermal diffusivity Γt: Pr t t t µ Γ = (1)
where Prt is the turbulent Prandtl number, which is of the order of 1 and it has been fixed to 1.1 for lead in this case, according to the literature [12]. From Eq. 1, and from the definition of the Prandtl number, it can be derived the following expression for the ratio of the thermal turbulent diffusivity Γt and the thermal molecular diffusivity Γ:
Pr Pr t t t µ µ Γ = ⋅ Γ (2)
From Eq. 2, it can be deduced that the relative importance of turbulent transport with respect to molecular transport for energy is that of the momentum (µt/µ) multiplied by the ratio of the Prandtl number to the turbulent Prandtl number (Pr/Prt). Therefore the nature of the fluid is very important for the ratio expressed by Eq. 2, and very conductive fluids with low Prandtl numbers like liquid metals are basically less dominated by turbulent transport of heat at a given Reynolds number.
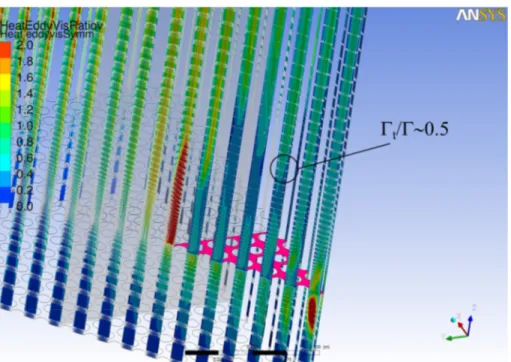
Figure 14 shows the contours of the eddy diffusivity ratio Γt/Γ of heat, expressed by Eq. 2, in the transversal symmetry plane of the computational domain. The scale of the contour is from 0 to 2, and, as it was expected, the dominance of turbulence for the energy transport is less important than for the momentum transport at the present Prandtl number for lead Pr∼0.017. In particular, there is a quite large region in the center of the wake, just downstream the obstacle, where the ratio is around 0.5, and
thus the molecular transport dominates (2/3 of the diffusion coefficient) and the turbulent transport contributes marginally (1/3 of the diffusion coefficient). Nevertheless, values of the ratio around 1 can be observed in Figure 14 at the center of the vortex where the maximum temperature is expected. This implies that actually turbulent heat transfer plays a relevant role for lead in the present conditions of case B2. In fact the ‘effective’ conductivity keff of the fluid is the sum of the molecular and the turbulent contributes, and it can be expressed as:
1 t
eff
k =k +Γ Γ
(3)
And it is about 2 times the molecular one at the recirculation center.
FIGURE 13 EDDY VISCOSITY RATIO CONTOURS IN THE TRANSVERSAL SYMMETRY PLANE FOR A FLOW BLOCKAGE OF THE ELSY FA; THE PROJECTED VELOCITY VECTORS ARE ALSO REPRESENTED.
FIGURE 14 THERMAL EDDY DIFFUSIVITY RATIO CONTOURS IN THE TRANSVERSAL SYMMETRY PLANE FOR A FLOW BLOCKAGE OF THE ELSY FA: ββββ=0.2.
From an engineering point of view, the most important feature of this complex thermal-hydraulic situation is the clad peak temperature due to the blockage. Figure 15 shows an overview of the wall temperature distribution, while Figure 16 shows a zoom view in the wake region, with the superimposed velocity vector.
As it was expected, the peak is in the wake region, with a maximum clad temperature of 854 °C for the present value of β=0.2. Figure 16 shows that the maximum occurs at the center of the recirculation vortex, i.e. at the stagnation point. For the present level of blockage, the situation is not critical for the clad, and the temperature remains below 900 °C in the hottest wall point.
FIGURE 15 PIN WALL TEMPERATURE CONTOURS FOR A FLOW BLOCKAGE OF THE ELSY FA: OVERVIEW.
3.2.3 The effect of the flow blockage area fraction
β
β
β
β
In this section, the strong effect of the β parameter, i.e. of the portion of flow passage area blocked, will be analyzed in some details.
In the case in which only 1 subchannel is blocked, i.e. for β∼1/400∼2.5·10-3, the flow is perturbed locally as shown in Figure 17, where the pin wall temperature contours are plotted with the velocity vector superimposed in the transversal symmetry plane.
The perturbation leads to a local temperature rise just downstream the blockage of 30-40 K. In this case the dominant effect becomes the global effect denoted as (b) in section 1, and a temperature peak is detectable at the end of the active zone, in the blocked subchannel, very far from the blockage itself, see the temperature contours in the whole bundle in Figure 18. This effect is clearly due to lower mass flow rate in the blocked subchannel, and it leads in this case to a maximum clad temperature around 530 °C.
FIGURE 17 PIN WALL TEMPERATURE CONTOURS FOR A SINGLE SUBCHANNEL FLOW BLOCKAGE OF THE ELSY FA: ZOOM VIEW.
If the portion of area blocked reaches the 40% of the total flow passage area, i.e. for β=0.4, the phenomenology remains qualitatively similar to that described for β=0.2, although the local effect becomes stronger in terms of maximum clad temperature.
Figure 19 shows the pin wall temperature contours in the whole bundle for β=0.4. The maximum clad temperature is above 1000 °C in this case.
A direct comparison between the cases β=0.2 and β=0.4 is shown in Figure 20, where the wall temperature distributions in the wake regions for the two cases are shown. In the case of β=0.4, the recirculation vortex is larger and a larger temperature peak occurs. Approximately, the temperature peak occurs at a distance ∆z from the blockage equal to the average radius of the blockage Rbl, for both cases examined. The recirculating vortex is elongated in the mainstream direction with an aspect ratio
Ar ∼2, as it was found experimentally by flow visualization studies [15]. Figure 21 shows the recirculating vortex with the temperature contours for the case β=0.4.
Figure 22 shows the eddy diffusivity ratio of heat in the transversal symmetry plane for β=0.4. From accurate post-processing analysis, the ratio falls below 0.25 in a wide region behind the blockage but it is around 0.5 at the center of the recirculating vortex. From Eq. 3 it can be deduced that the effective conductivity at the vortex center is increased 50% by turbulence with respect to stagnant conditions. The turbulence contribute cannot be neglected in this case.
Just to capture the scale laws, the intuition suggests that the maximum temperature drop is proportional to the thermal resistance of the vortex. Including the effect of turbulence in the effective conductivity of Eq. 3, this leads to the following scale law:
max max,
bl
clad inlet wall wall
eff eff R T T T c q c q k k β ′ ′′ ∆ = − (4)
where c′ and c″ are empirical constants depending on geometrical factors. For a sufficiently large flow blockage area, i.e. for β >β*
, the temperature drop between the maximum clad temperature and the upstream temperature due to the local effect of the blockage is expected to scale as the square root of the blocked area fraction β.
Introducing the non-dimensionl temperature Θ as:
inlet IO outlet inlet T T T T T T − ∆ Θ = = ∆ − (5)
And keeping into account Eqs.2 and 3, the criterion expressed by Eq. 4 can be reformulated in a dimensionless fashion as:
max max max 1 1 Re Re Re Pr Pr Pr 1 1 Pr Pr p p p IO eff t t t t wAc c c T T c c c T Q k k ρ µ µ β β β µ µ µ µ ∆ Θ = ∆ ⋅ ⋅ ⋅ ∆ + + (6)
If turbulence dominates heat transfer, i.e. for high Peclet numbers, then (µt/µ)·(Pr/Prt)»1, and Eq. 6 reduces to: max 1 Re Pr Re Pr Pr t t t c β c β µ µ µ µ ′′′ Θ ⋅ ⋅ (7)
It should be noticed that this latter expression is independent of the Prandtl number.
From basic consideration on turbulence scales [16], it is expected that at high Reynolds numbers the eddy viscosity ratio scales as the Reynolds number, i.e.:
Re t µ
µ (8)
Introducing Eq. 8 in Eq. 7, under the hypothesis of high Peclet number and dominance of turbulent heat transfer, the maximum dimensionless temperature drop Θmax is found to be a function of the blockage parameter β alone, as already documented in [3]:
max c β
Θ (9)
On the other hand, for low Peclet numbers, i.e. when heat transfer in the wake is dominated by conduction, Eq. (6) reduces to a function of β and of the Peclet number:
max c βRe Pr c β Pe
Θ (10)
FIGURE 18 PIN WALL TEMPERATURE CONTOURS FOR A SINGLE SUBCHANNEL FLOW BLOCKAGE OF THE ELSY FA: OVERVIEW.
FIGURE 20 PIN WALL TEMPERATURE CONTOURS FOR A FLOW BLOCKAGE OF THE ELSY FA: a, ββββ=0.2; b, ββββ=0.4.
FIGURE 21 PIN WALL TEMPERATURE CONTOURS FOR A FLOW BLOCKAGE OF THE ELSY FA WITH THE VELOCITY VETCORS SUPERIMPOSED: β
β β
β=0.4. THE RADIUS OF THE BLOCKAGE AND THE DISTANCE OF THE CENTRE OF THE VORTEX FROM THE BLOCKAGE ARE INDICATED.
Table 3 shows synthetically the CFD results in terms of maximum clad temperatures at different value of the blockage parameter β. It is worthwhile that data for β=0.2, 0.4 scales coherently with the scale analysis resumed in Eq. 4, being:
max 0.4 max 0.2 0.4 1.4 0.2 T T β β = = ∆ ∆ (5)
TABLE 3 MAXIMUM CLAD TEMPERATURE FOR THE DIFFERENT CASES EXAMINED.
CASE Re β Tinlet [°C] Tmax,clad [°C] ∆Tmax[°C]
BS 9.3·104 Single subchannel 400 528 128
B2 9.3·104 0.20 400 854 454
FIGURE 22 THERMAL EDDY DIFFUSIVITY RATIO CONTOURS IN THE TRANSVERSAL SYMMETRY PLANE FOR A FLOW BLOCKAGE OF THE ELSY FA: ββββ=0.4.
3.2.4 The effect of Buoyancy
As given in the introduction, the buoyancy effect has been considered in all the cases described in this paper. The buoyancy force has been added both in the momentum equation and in the kinetic energy equation as an exact production term.
For the reference case B2 with Lead, Re∼93000, β=0.2, a sensitivity analysis on the influence of buoyancy has been conducted. Figure 23 shows the net effect in the results for including or not including buoyancy in the numerical model. The temperature field is very similar and only slight changes in the shape of the maximum and in the value of the maximum temperature can be observed. The conclusion is that the influence of buoyancy on heat transfer is a second-order effect and it is negligible at the first order.
3.2.5 The Effect of the Reynolds number (flow)
A set of numerical simulations have been carried out to assess the influence of the Reynolds number on the flow blockage phenomena. For this parametric study the fluid is lead, and all the other relevant parameters have been fixed: β=0.2, qwall=0.7 MW/m2.
The Reynolds number has been made to vary by changing the velocity inlet conditions. The cases performed and the results in terms of dimensioned and dimensionless maximum temperature drop are given in Table 4.
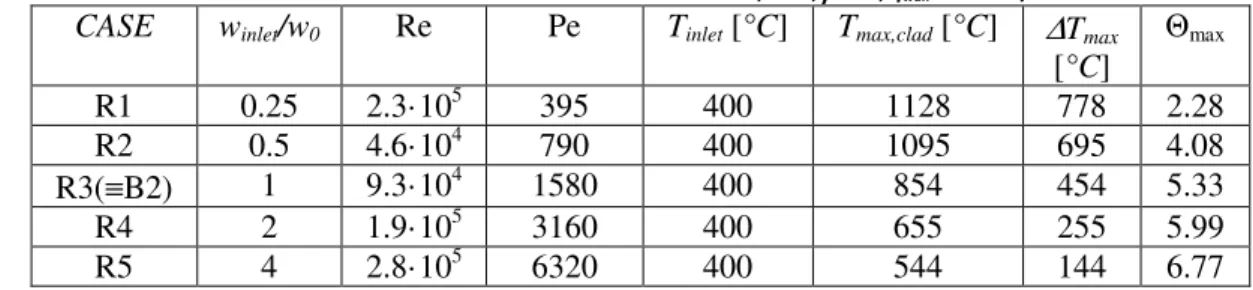
TABLE 4 MAXIMUM CLAD TEMPERATURE FOR THE DIFFERENT CASES EXAMINED, lead, βββ=0.2, qβ wall=0.7 MW/m 2
.
CASE winlet/w0 Re Pe Tinlet [°C] Tmax,clad [°C] ∆Tmax [°C] Θmax R1 0.25 2.3·105 395 400 1128 778 2.28 R2 0.5 4.6·104 790 400 1095 695 4.08 R3(≡B2) 1 9.3·104 1580 400 854 454 5.33 R4 2 1.9·105 3160 400 655 255 5.99 R5 4 2.8·105 6320 400 544 144 6.77
The temperature drop ∆Tmax due to the blockage obviously decreases while Reynolds number increases.
From the analysis of the reference case R3(≡B2) given in section 3.2.2, the main conclusion was that heat transfer in the wake region behind the blockage was partially influenced by turbulence with a significant contribution of molecular diffusion. For lower values of the Reynolds number, cases R1 and R2, turbulent heat transfer is not relevant in the wake and the dimensionless temperature Θmax scales almost linearly with Reynolds as stated in Eq. 10. For higher values of the Reynolds number, cases R4 and R5, turbulence tends to dominate heat transfer in the wake, the variations of dimensionless temperature are not so strong and Θmax probably tends to an asymptotic value for infinite Reynolds number. A graphical representation of Θmax vs. Re is shown in Figure 24.
Figure 25 shows contours of temperature drop ∆T=T-Tinlet and dimensionless temperature Θ for cases R1 to R4. The dimensionless temperature distributions for the different cases are on the right column, with the lower Reynolds number case on the top. It is interesting to notice the self-similarity of the dimensionless fields at the higher Reynolds numbers.
FIGURE 25 TEMPERATURE DROP (LEFT) AND DIMENSIONLESS TEMPERATURE Θ AT VARIOUS REYNOLDS NUMBERS FOR LEAD, ββββ=0.2.
The above analysis is confirmed by Figure 26, where the contours of the thermal eddy diffusivity ratio Γ/Γt are shown for cases R1 to R5. Turbulent heat transfer starts dominating in case R4 and it is fully dominating in R5; R1 and R2 are practically in pure conduction in the wake region. The ‘nominal’ case R3≡B2, relevant for the safety analysis of the ELSY FA, is in an intermediate condition at the lead Prandtl number Pr=0.017, with contributes both from molecular side and from turbulent eddies.
FIGURE 26 THERMAL EDDY DIFFUSIVITY RATIO CONTOURS AT VARIOUS REYNOLDS NUMBERS FOR LEAD, ββββ=0.2.
3.2.6 The Effect of the Prandtl number (fluid)
In this section, the effect of the thermo-physical properties of the coolant on the heat transfer in FA flow blockage will be investigated. Focusing on heat transfer, the most important non-dimensional number tied to the thermo-physical properties is the Prandtl number.
For the ELSY Fuel Assembly (fixed geometry), and a given value β=0.2 of the blocked fraction of the total flow area, three different fluids will be considered: sodium, lead and (pressurized, 15 MPa)
water. Pressurized water is the reference for the nuclear technology, while sodium and lead will be probably the coolant for the GEN-IV nuclear reactors. In the comparison, the subchannel Reynolds number will be fixed to the nominal value of the lead-cooled ELSY FA, i.e. Re∼93000.
The physical properties of the coolants and the Boundary conditions of the computational cases presented are summarized in Table 5. The wall heat flux qwall is kept constant to the nominal value of ELSY FA, and the choice to keep the Reynolds number constant in the comparison leads to different bundle output temperature for the different coolants. This fact is not very relevant in this context because the focus is on the local effect due to the blockage. To overcome this circumstance, results are presented also in terms of the non-dimensional temperature Θ=(T-Tinlet)/(Toutlet-Tinlet).
TABLE 5 PHYSICAL PROPERTIES OF THE COOLANTS AND THE BOUNDARY CONDITIONS OF THE COMPUTATIONAL CASES. CASE P1 P2(≡≡≡≡B2) P3
Fluid Sodium Lead Water
Pr 0.005 0.017 0.86 ρ[kg/m3] 842 10503 729 k [W/mK] 66.1 17.15 0.56 ν[m2/s] 3.08·10-7 1.90·10-7 1.21·10-7 α [1/K] 2.45·10-4 1.14·10-4 3.0·10-3 cp[J/kg K] 1272 145.9 5390 ρ cp [J/m3 K] 1.07·106 1.53·106 3.93·106 Re 93000 93000 93000 winlet [m/s] 2.43 1.5 0.95 Tinlet[°C] 400 400 280 β 0.2 0.2 0.2 qwall [MW/m2] 0.7 0.7 0.7 ρ cp uinlet [W/m 2 K] 2.6·106 2.29·106 3.73·106 Toutlet- Tinlet[°C] 75.2 85.1 52.4
Figure 27 shows a direct comparison between cases P1, P2≡B2 and P3 in terms of temperature drop ∆T=T-Tinlet. As it was expected, the temperature peak is lower for sodium with respect to lead because of the larger conductivity. Nevertheless, sodium has a lower boiling temperature (around 900 °C) with respect to Lead (1700 °C); therefore, in case of flow blockage, the boiling of Lead is very unlikely while for sodium there is the real possibility of boiling with reactivity insertion due to the positive void coefficient.
For water, case P3, the nature of the phenomena and the distribution changes radically with respect to liquid metals, because the relative influence of turbulent convective heat transfer is much more important at unity Prandtl number with respect to liquid metals, as it was shown by Eq. 2. This is evident in Figure 27 by observing the streaked shape of the wall temperature contours.
In Figure 28 the contours of the non-dimensional temperature Θ are reported. From a dimensionless point of view, results collapse relatively well for sodium and lead, although the dimensionless temperature maximum is still higher for lead. The shape of the distribution for water differs substantially by liquid metals for the reasons explained above.
Table 6 summarizes the results in terms of maximum temperature drop and maximum non-dimensional temperature. First of all, it should be noticed that case P3 is characterized by a very high Peclet number; the values of Θmax for this latter case are close to that obtained with lead at high Peclet numbers (case R5, Table 4) and gives an asymptotic value for Θmax around 7.
A residual dependence of Θ by the Prandtl number is still present in the results for cases P1(sodium) and P2(lead) with a monotonic increasing of Θmax with Pr; this is due to the role played by the conductivity in the low Pe number cases, as shown in section 3.2.3, Eq. 10.
TABLE 6 MAXIMUM CLAD TEMPERATURE FOR THE DIFFERENT CASES EXAMINED, Re=93000, βββ=0.2. β
CASE Pr Pe Tinlet [°C] Tmax,clad [°C] ∆Tmax[°C] Θmax Γt/Γ(wake)
P1 (Sodium) 0.005 465 400 718 318 4.23 <<1
P2 (Lead) 0.017 1580 400 854 454 5.33 ∼1
P3(Water) 0.86 8·104 280 643 363 6.92 >>1
The role of the turbulent diffusion of heat is clarified by Figure 29, where the thermal eddy diffusivity ratio Γt/Γ is shown. As it was expected, water exhibits very high value of the ratio above 20, and thus the heat transport is dominated by turbulence. The streaked shape of the temperature contours in Figure 25 depends on the turbulence tongues of Γt/Γ shown in Figure 29 in a unity Prandtl number fluid.
In the case of sodium, the values of the eddy diffusivity ratio are very low in the whole recirculation region; therefore the molecular thermal diffusion drives heat transfer behind the obstacle.
In the case of lead, the situation is more complex, as already stated and discussed in sections 3.2.2 and 3.2.3. The solution is apparently diffusion-dominated with low values of the ratio in the recirculation area, but the turbulence tongues in the eddy diffusivity ratio field influence heat transfer and increase the effective thermal conductivity. This border-line situation of lead is the reason because in Table 6 the maximum temperature drops do not scale linearly with the Prandtl number as it was expected for conductive-dominated solutions.
In conclusion, case P1 (sodium) exhibits a purely conductive solution, case P2 (lead) a border-line situation with a moderate influence of the turbulent heat transfer, and case P3 (water) is totally dominated by turbulent heat transfer.
FIGURE 27 RELATIVE TEMPERATURE T-Tinlet CONTOURS FOR A BLOCKAGE ββββ=0.2 WITH THREE DIFFERENT COOLANTS: SODIUM, LEAD,
FIGURE 28 DIMENSIONLESS TEMPERATURE Θ=(T-Tinlet)/( Toutlet- Tinlet) CONTOURS FOR A BLOCKAGE βββ=0.2 WITH THREE DIFFERENT β
FIGURE 29 THERMAL EDDY DIFFUSIVITY RATIO CONTOURS IN THE TRANSVERSAL SYMMETRY PLANE FOR THE THREE CASES P1(SODIUM), P2(LEAD), P3 (WATER): ββββ=0.2, RE=93000.
3.2.7 Transient behavior
The time-dependent behavior of case B2, β=0.2, has been simulated numerically by the use of U-RANS technique with the SST k-ω model. The time step has been chosen with the CFL∼1 criterion as ∆t = 2 ms, by far sufficient to correctly describe the physical phenomena involved.
The time-dependent behavior of the maximum clad temperature is shown in Figure 30. The temperature reaches its asymptotic value in a characteristic time around 5 s, with a time constant of ∼2 s. There is not an overshoot in the temperature behavior, probably because of the significant role played by the molecular diffusion for liquid metals.
FIGURE 30 TIME BEHAVIOUR OF THE MAXIMUM CLAD TEMPERATURE AND OF THE TEMPERATURE IN A MONITORING POINT FOR THE ELSY FA, ββββ=0.2.
4. Flow Blockage in the hexagonal wrapped ALFRED FA
4.1 ALFRED FA CFD Model
The Fuel Assembly of the ALFRED Lead cooled reactor has been considered here as the second configuration to investigate. The fuel assembly is a wrapped hexagonal lattice bundle with 127 rods, grid-spaced, with rod diameter d=10.5 mm, pitch to diameter ratio p/d=1.32 and an active length L=0.6
m. The total thermal power of the reactor is Q~300 MW.
A sketch of the fuel assembly seen from the top is shown in Figure 31, while in Table 7 the main geometrical and physical parameters for the ALFRED FA are reported.
A flow blockage at the beginning of the active region has been considered here as the most critical case, for the reasons discussed in section 1. The location of the blockage is similar to that of the ELSY FA, but it is influenced by the presence of the wrap.
For the correct description of the physical phenomena involved, the choice of the correct computational domain and boundary conditions is crucial. A wrong or superficial choice would lead to inaccurate or non-physical results. This considerations leads to a special choice for the ELSY open FA; for the closed ALFRED FA, the entire FA or a portion of it is the only possible choice.
FIGURE 31 SKETCH OF THE ALFRED FUEL ASSEMBLY SEEN FROM THE TOP. TABLE 7 BASIC GEOMETRICAL AND THERMAL-HYDRAULIC PARAMETERS OF THE ELSY CORE.
Rod diameter d 10.5 mm
Pitch to diameter ratio p/d 1.3238 Subchannel Equivalent Diameter Deq 9.68 mm
Number of fuel rods 127
Clearance between assemblies 5 mm
Assembly pitch 171 mm
Mean Assembly Power 1.75 MW
Mean Rod Power 13.814 kW
Mean Wall Heat Flux qwall 0.7 MW/m2
Active Height L 0.6 m
Lead Inlet Temperature Tinlet 400 °C Lead Outlet Temperature Toutlet 470 °C
Lead Bulk Velocity 1.4 m/s
Clad Maximum Temperature (expected under nominal conditions)
550 °C Total number of FA in the CORE 171 Total Reactor Thermal Power 300 MW
A sketch of the computational domain seen from the top is shown in Figure 32. The computational domain is a 60 degrees slice of the entire fuel sub-assembly, where rotational periodic conditions have been applied on the lateral sizes and no slip conditions at the wall. The exact location of the blockage is relevant in the case of wrapped FA, and three different positions have been selected with respect to the wall position as central, intermediate and wall-neighbor, as shown in Figure 33.
FIGURE 32 SKETCH OF THE COMPUTATIONAL DOMAIN USED FOR THE ALFRED FUEL ASSEMBLY ANALYSIS.
A 3D view of the domain is shown in Figure 34. The blockage is located at the beginning of the active region (z=0.1 m), and an entry length 0.1 m, i.e. about 10 subchannel hydraulic diameters Deq, allows to have hydrodynamic fully developed flow at the beginning of the active region. The active region has a total length of 0.6 m.
For the unperturbed case without blockage, constant velocity (winlet=1.4 m/s), constant temperature (Tinlet=400 °C), boundary conditions have been imposed at the inlet coherently to the nominal data of Table 6, while pressure boundary conditions have been imposed at the outlet. At the pin wall in the active region, a constant heat flux qwall=0.7 MW/m2 has been imposed.
For the cases with flow blockage, different hydrodynamic boundary conditions have been imposed with respect to the ELSY FA. For the open element, a blockage does not induce any flow variation in the FA, i.e. the average velocity far upstream of the blockage remains unperturbed. On the opposite, for wrapped elements, a blockage increases the hydraulic resistance of the element itself, and the mass flow rate through the element is reduced. To correctly address this situation, an unperturbed case has been run first with the above described boundary conditions. Thereafter, the pressure drop of the unperturbed case has been imposed to all the cases with blockage. In this way, it is correctly reproduced the reactor hydraulics of several closed FA in parallel. The test matrix adopted to study the blockage in ALFRED FA is shown in Table 8.
The general simplified assumptions described in section 2.1 for ELSY FA have been considered in all the computations for ALFRED FA.
The computational mesh is multi-blocks fully structured with a resolution close to the wall of the order of y+∼1 for the nominal velocity of 1.4 m/s. The strategy for the mesh generation is similar to that adopted for ELSY, but a proper resolution is required at the FA wrap. The total number of nodes is around 10.6·106.
FIGURE 33 POSITION OF THE BLOCKAGE IN THE ALFRED FA. TABLE 8 TEST MATRIX OF THE FLOW BLOCKAGE IN THE ALFRED FA.
CASE ββββ BLOCKAGE POSITION AL1 Subchannel Central
AL2 Subchannel Intermediate
AL3 Subchannel Wall-neighbor
AL4 0.1 Central AL5 0.1 Intermediate AL6 0.1 Wall-neighbor AL7 0.2 Central AL8 0.2 Intermediate AL9 0.2 Wall-neighbor AL10 0.5 Central ALU 0 -
FIGURE 34 3D SKETCH OF THE COMPUTATIONAL DOMAIN USED FOR THE ALFRED FUEL ASSEMBLY ANALYSIS.
4.2 ALFRED FA RESULTS
4.2.1 Nominal unperturbed solution
The nominal unperturbed solution without any blockage is analyzed as a reference to check if the model looks reasonable and to have the ‘zero point’ to evaluate the effect of the blockage. Moreover, in the case of closed FA, the correct unperturbed pressure boundary conditions are needed for the cases with flow blockage. The case has been conventionally named ALU.
Figure 35 shows the w vertical velocity contours in the transversal plane of the computational domain where periodical boundary conditions have been imposed. It is remarkable that the flow becomes hydro-dynamically fully developed well before the beginning of the active region, and it confirms that the mechanical entry length is less than 10 hydraulic diameters.
FIGURE 35: w VERTICAL VELOCITY CONTOURS IN THE TRANSVERSAL PLANE FOR THE UNPERTURBED SOLUTION (ALU) OF THE ALFRED FA IN NOMINAL CONDITIONS.
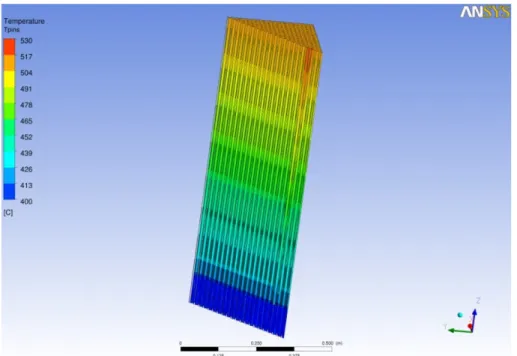
The temperature contours in the transversal symmetry plane and in the pin walls are shown in Figure 36. The overall vertical temperature gradient is clearly visible and the outlet bulk temperature is about 470 °C as it was expected from a simple thermal balance.
FIGURE 36 TEMPERATURE CONTOURS IN THE TRANSVERSAL PLANE FOR THE UNPERTURBED SOLUTION OF THE ALFRED FA IN NOMINAL CONDITIONS.
Figure 37 shows the vertical velocity contours in the XY mid-plane, where the small hydrodynamic boundary layers close to the pins can be observed. In the proximity of the wrap, the contour shape is deformed due to the no-slip effect of the wall.
FIGURE 37 w VERTICAL VELOCITY CONTOURS IN A XY PLANE IN THE MIDDLE OF THE ACVTIVE ZONE (z=0.4m) FOR THE UNPERTURBED SOLUTION OF THE ALFRED FA IN NOMINAL CONDITIONS.
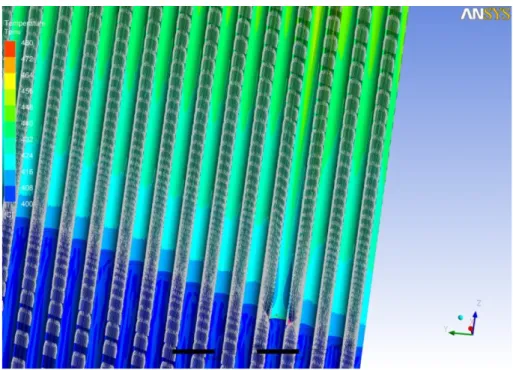
Figure 38 shows the temperature contours in the XY mid-plane. It can be clearly observed a residual thermal coupling between subchannels with a non-uniform azimuthal wall temperature distribution. The most relevant effect is the presence of the typical cold fluid regions in the subchannels close to the FA wall. This is an effect of the adiabatic conditions of the wall which implies a smaller power per unity mass flow rate in these subchannels with respect to the standard central subchannels. It must be underlined that this situation implies larger temperature differences in the section at higher z, and for the entire FA, the thermally developed boundary conditions are never reached. The active length 0.6 m is not sufficient to have thermal fully develop flow. Just to fix the ideas, the bulk temperature difference in the mid-plane section shown in Figure 38 is ∼21 K, while at the outlet is ∼35 K.
From post-processing, it can be computed that at the outlet section, the average difference between wall temperature and bulk temperature is around 35 K, while the average heat transfer coefficient is h ~32200 W/m2K, for a corresponding Nusselt number Nu∼18.4 at the present Reynolds number Re ∼71300.
FIGURE 38 TEMPERATURE CONTOURS IN A XY PLANE IN THE MIDDLE OF THE ACVTIVE ZONE (z=0.4 m) FOR THE UNPERTURBED SOLUTION OF THE ALFRED FA IN NOMINAL CONDITIONS.
4.2.2 A deep analysis of the case
β
β
β
β
=0.2, leadA detailed analysis is presented on flow and heat transfer in a flow blockage accident of the lead-cooled Fuel Assembly of ALFRED. The area interested by the blockage is 20% of the total flow passage area, i.e. β=0.2. The blockage position is central, and the case has been named conventionally as AL7 in Table 8. A pressure drop ∆pIO∼18210 Pa has been applied at the FA heads, as explained in the previous section.
Figure 39 shows the vertical w velocity contours in the usual transversal plane of the computational domain. Figure 40 represents a zoom view of the same field. From both figures, the recirculation region is well evident, and can be identified by the negative values of the vertical velocity w. It can be evidenced that the value of the recirculation velocity is w∼0.7 m/s, i.e. of the same order of the main stream velocity, and the recirculation region is not ‘stagnant’ but it is interested by a relevant turbulent flow, at least in the peripherals regions of the recirculating vortex.
The w velocity contours in a plane located 45 mm downstream the blockage is shown in Figure 40; the azimuthal variation of the velocity field in the XY plane is not so strong and the diagonal symmetry plane of Figures 39 and 40 is fully representative of the whole domain.
A relevant feature is the flow acceleration in the unblocked subchannels of external ranks, see Figure 40 and 41. This phenomenon is due to coolant mass flow rate of the blocked subchannels in the entry region which deviates towards the neighboring subchannels because of the obstacle.
The hydrodynamic features of the flow are well shown in Figure 42. The Figure shows the contours of the Eddy viscosity ratio in the diagonal plane, with the projected velocity vectors superimposed. The wake/recirculation region is clearly visible downstream the blockage. The impressive evidence is that the eddy viscosity ratio (µt/µ), i.e. the ratio between the eddy viscosity µt and the dynamic molecular
viscosity µ, is very high in the whole wake region, i.e. above 20, and it falls down below 10 only in limited regions close to some rods. The conclusion is that, as for the ELSY FA, turbulence dominates
momentum transfer in flow blockage conditions.
FIGURE 39 W VELOCITY CONTOURS IN THE TRANSVERSAL PLANE FOR A CENTRAL FLOW BLOCKAGE OF THE ALFRED FA, ββββ=0.2.
FIGURE 40 W VELOCITY CONTOURS IN THE TRANSVERSAL PLANE FOR A CENTRAL FLOW BLOCKAGE OF THE ALFRED FA, βββ=0.2: ZOOM β VIEW.
FIGURE 41 W VELOCITY CONTOURS IN A XY PLANE LOCATED 35 MM DOWNSTREAM THE BLOCKAGE.
Regarding heat transfer, Eq. 2 gives the ratio between the turbulent thermal eddy diffusivity and the thermal molecular diffusivity in the k-ω family turbulence model adopted in this context.
Figure 43 shows the contours of the thermal eddy diffusivity ratio Γt/Γ in the transversal plane of the computational domain for ALFRED FA. The scale of the contour is from 0 to 2, and, as it was expected, the dominance of turbulence for the energy transport is less important than for the momentum transport at the present Prandtl number for lead Pr∼0.017. In particular, there is a quite large region in the center of the wake, just downstream the obstacle, where the ratio is around 0.5, and thus the molecular transport dominates (2/3 of the diffusion coefficient) and the turbulent transport contributes marginally (1/3 of the diffusion coefficient). Nevertheless, values of the ratio around 1 can be observed in Figure 43 at the center of the vortex where the maximum temperature is expected. This implies that actually turbulent heat transfer plays a significant role for lead in the present conditions of case B2. In fact the ‘effective’ conductivity keff of the fluid is the sum of the molecular and the turbulent contributes, and it can be expressed by Eq. 3.
FIGURE 42 EDDY VISCOSITY RATIO CONTOURS IN THE TRANSVERSAL PLANE FOR A FLOW BLOCKAGE OF THE ALFRED FA; THE PROJECTED VELOCITY VECTORS ARE ALSO REPRESENTED: βββ=0.2.β
FIGURE 43 THERMAL EDDY DIFFUSIVITY RATIO CONTOURS IN THE TRANSVERSAL SYMMETRY PLANE FOR A FLOW BLOCKAGE OF THE ALFRED FA: ββββ=0.2.
From an engineering point of view, the most important feature of this complex thermal-hydraulic situation is the clad peak temperature due to the blockage. Figure 44 shows an overview of the wall temperature distribution, while Figure 45 shows a zoom view in the wake region, with the superimposed velocity vectors.
As it was expected, the peak is in the wake region, with a maximum clad temperature of 741 °C for the present value of β=0.2. Figure 44 shows that the maximum occurs at the center of the recirculation vortex, i.e. at the stagnation point. For the present level of blockage, the situation is not critical for the clad, and the temperature remains below 800 °C in the hottest wall point.
FIGURE 43 PIN WALL TEMPERATURE CONTOURS FOR A FLOW BLOCKAGE OF THE ALFRED FA: OVERVIEW.
4.2.3 The effect of the flow blockage area fraction
β
β
β
β
In this section, the strong effect of the β parameter, i.e. of the portion of flow passage area blocked, will be analyzed in some details. The effect of the β variation will be considered by analyzing and post-processing data on cases AL1, AL4, AL7 and AL10 in Table 8.
In the case in which only 1 subchannel is blocked, i.e. for β∼1/127∼8·10-3, the flow is perturbed locally as shown in Figure 45, where the pin wall temperature contours are plotted with the velocity vector superimposed in the transversal symmetry plane. The local effect is much more important than in the ELSY open square configuration, see Figure 17 for a comparison.
The perturbation leads to a significant local temperature peak downstream the blockage of 100 K against 30-40 K in the ELSY FA. The dominant effect becomes the global effect denoted as (b) in section 1, and a temperature peak is detectable at the end of the active zone, in the blocked subchannel, very far from the blockage itself, see the temperature contours in the whole bundle in Figure 46. This effect is clearly due to lower mass flow rate in the blocked subchannel, and it leads to a maximum clad temperature around 530 °C, like in the ELSY FA.
FIGURE 45 PIN WALL TEMPERATURE CONTOURS FOR A SINGLE SUBCHANNEL FLOW BLOCKAGE OF THE ALFRED FA: ZOOM VIEW.
Figure 46 shows the wall pin temperature contours and the thermal eddy diffusivity ratio for cases AL1, AL4, AL7 and AL10, i.e. for central blockages. While increasing β, the temperature peak behind the blockage becomes dominant with respect to the temperature peak at the end of the blocked subchannels. The most relevant feature is that for the highest blockage level β=0.5 (case AL10) the maximum clad temperature is above 1500 °C and cannot be allowed for safety reasons. This situation is much more critical with respect to what happened in the ELSY FA for a similar value of β (see Figure 19 for ELSY FA β=0.4), and it is determined by the fact that in a closed FA the mass flow rate
decreases while the flow blockage area increases, and it is about half of the nominal value for case AL10.
The analysis of the thermal eddy viscosity ratio in Figure 47 shows that for the intermediate blockage cases AL4, AL7 the situation is similar to that of the ELSY FA with a ratio Γt/Γ∼1 at the vortex center; this leads to comparable temperature peaks for closed and open FA. In the case AL10, basically because of the lower mass flow rate, Γt/Γ<<1 and the heat transfer is fully dominated by the pure conduction in the whole wake area. This fact determines the relevant temperature peak mentioned above.
Figure 48 shows the behavior of the dimensionless temperature drop Θmax as a function of the flow blockage area fraction β for the different cases examined. Θmax is made non-dimensional by the temperature drop across the bundle in each case. The values obtained are in line with those of the ELSY FA, but the value of Θmax∼9 for β=0.5 are referred to a reduced mass flow rate condition, i.e. to a higher inlet-outlet temperature drop of 130 °C.
FIGURE 47 TEMPERATURE CONTOURS (LEFT COLUMN) AND THERMAL EDDY VISCOSITY RATIO (RIGHT COLUMN) FOR CASES AL1, AL4, AL7, AL10.
FIGURE 48 MAXIMUM DIMENSIONLESS TEMPERATURE CONTOURS Θ VS. ββββ FOR FLOW BLOCKAGE OF THE ALFRED FA.
Table 9 shows synthetically the present results in terms of maximum clad temperatures at different value of the blockage parameter β.
TABLE 9 MAXIMUM CLAD TEMPERATURE FOR THE DIFFERENT CASES EXAMINED.
CASE Re β Blockage position
Tinlet [°C] Tmax,clad [°C] ∆Tmax[°C] Θmax AL1 7.13·104 Single subchannel Central 400 526 126 1.85 AL4 7.13·104 0.10 Central 400 611 211 3.10 AL7 7.13·104 0.20 Central 400 741 341 5.00 AL10 7.13·104 0.50 Central 400 1539 1139 9.20
4.2.3 The effect of the blockage position: central, intermediate, wall-neighbor For a closed subchannel the influence of the position of the blockage with respect to the wall has been examined. The full matrix of the case examined is reported in Table 7, while Figure 32 reports the three relative positions named Central, Intermediate and Wall-neighbor.
For a fixed value of the flow blockage area fraction β=0.2, cases AL7, AL8 and AL9 provides a comparison for the effect of the flow blockage position. Figure 49 shows the dimensionless temperature drop for the three cases. The first observation is that the flow blockage is most critical for the peak temperature if it happens at the center of the FA flow passage area, i.e. case AL7 gives higher clad temperatures with respect to cases AL8 and AL9. The second thing is that moving the blockage from the center to the wall, the thermal effect becomes less local and the global effect due to the lower mass flow rate in the blocked subchannels starts dominating.
FIGURE 49 DIMENSIONLESS TEMPERATURE CONTOURS FOR CASES AL7, AL8 AND AL9.
TABLE 10 MAXIMUM CLAD TEMPERATURE FOR THE DIFFERENT CASES EXAMINED.
CASE Re β Blockage position
Tinlet [°C] Tmax,clad [°C] ∆Tmax[°C] Θmax AL1 7.13·104 Single subchannel Central 400 526 126 1.85 AL2 7.13·104 Single subchannel Intermediate 400 518 118 1.73 AL3 7.13·104 Single subchannel Wall-neighbor 400 501 101 1.48 AL4 7.13·104 0.10 Central 400 611 211 3.10 AL5 7.13·104 0.10 Intermediate 400 531 131 1.92 AL6 7.13·104 0.10 Wall-neighbor 400 521 121 1.78 AL7 7.13·104 0.20 Central 400 741 341 5.00 AL8 7.13·104 0.20 Intermediate 400 648 248 3.64 AL9 7.13·104 0.20 Wall-neighbor 400 681 281 4.13 AL10 7.13·104 0.50 Central 400 1539 1139 9.20
5. Conclusions
A CFD analysis by fully resolved RANS simulations has been carried on fluid flow and heat transfer in the case of flow blockage in heavy liquid metal cooled fuel assemblies. The open square ELSY FA and the wrapped hexagonal closed ALFRED FA have been considered for the study.
Two main effects can be distinguished in a flow blockage: a local effect in the wake/recirculation region downstream the blockage and a global effect due to the lower mass flow rate in the blocked subchannels; the former effect gives rise to a temperature peak behind the blockage, while the latter effect determines a temperature peak at the end of the active region.
Results indicate that the main advantage of the open FA with respect to the closed FA is the fact that in case of blockage the velocity far upstream the occlusion remains unchanged, and therefore the mass flow rate across the FA is not altered. On the opposite, in a closed FA a flow blockage increases the hydraulic resistance and leads to a lower overall mass flow rate.
A relevant conclusion of the study is that, at the nominal Reynolds numbers, while obviously momentum transfer in the wake is fully dominated by turbulence, energy transfer is governed both by molecular and by turbulent diffusion.
Results show that for the ELSY FA, a blockage of 40% leads to a maximum clad temperature around 1000 °C, and this condition is reached in a characteristic time of 5 s without overshoot.
For the ALFRED FA, a blockage of 50% at the center of the FA section reduces dramatically the mass flow rate to the 50% of the nominal value. This causes a maximum clad temperature behind the blockage above 1500 °C.
Blockage up to 20% of the flow section leads to similar conditions in ELSY and ALFRED FA.
The influence of the Reynolds number and of the Prandtl number has been analyzed in some details for the ELSY FA to evidence the scale laws and the fundamental mechanisms.
6. Nomenclature
A Section area [m2]
c Empirical constant
cp Specific heat at constant pressure [J/kgK]
d Rod diameter [mm]
Deq Equivalent diameter [mm]
h Heat transfer coefficient [MW/m2K]
k Thermal conductivity [W/mK]
L Active length [m] Nu Nusselt number
p Pitch [mm]
∆p Pressure drop [Pa] Pe Peclet number Pr Prandtl number
q Heat flux [MW/m2]
Q Total thermal power [MW] Re Reynolds number
Rbl Blockage radius [mm]
T Temperature [K]
w Axial velocity [m/s]
w0 Reference axial velocity [m/s]
z Axial distance [mm] Subscripts ()clad Clad ()eff Effective ()inlet Inlet ()IO Inlet-outlet ()outlet Outlet ()t Turbulent ()wall Wall Greek Symbols
α Thermal expansion coefficient [1/K] β Flow blockage area fraction
µ Dynamic viscosity [Pa·s] µt Eddy viscosity [Pa·s] ν Kinematic viscosity [m2/s] ρ Density [kg/m3]
Θ Non-dimensional temperature Γ Thermal diffusivity [m2/s]