School of Architecture Urban Planning Construction Engineering Laurea Magistrale in Management of Built Environment
A.A. 2018/2019
ACTIVE FLOOD CONTROL SYSTEM THROUGH MATRIX DRAIN
SYSTEM AND PHYTODEPURATIVE FLOW REVERSAL
Supervisor:
Prof. Angela Silvia Pavesi Co- Supervisor:
Diyan Duchev Genny Cia Authors:
Sam Jonathan Sagaya Seelan- 882814 Gowtham Vikas Pratheep Pratap – 872963
2
ABSTRACT
The main idea of the project is to improve and develop flood control systems with sustainable techniques in the city of Mumbai and in the process, develop a module that can not only be suitable in the urban cities of south east Asian countries but also work with the same effectiveness in the rural sides of the same. This project explores the possibility of using the concept of Phytodepuration as an active flood control system in flood prone areas of India. This project is an advanced version of the module developed for the RICS Cities for the Future competition in 2018, adding many research areas and scope for improvements and betterment.
The aim of this thesis is to analyse the different causes for flooding in 4 major cities in India, which are of high flood crisis importance that require immediate action; to give out possible solutions and analyze their feasibility; explore the various branching of the most optimal solution and find the cost benefits of this solution with highlights on the added sub-benefits that arise from it; and finally to perform Multi Criteria Analysis for the solution and give out the results.
The project also aims to involve the society in the project through the Triple Bottom Line method, wherein the social, economic and environmental sustainabilities are to be achieved. The project proposes the analysis of the relationship between the technical solution with the social involvement in it to find out how they are mutually dependent and how the social involvement will aid the technical solution to make the project successful. This project, was a basic idea was initially developed for the “Cities for Our Future” competition hosted by RICS (Royal Institution of Chartered Surveyors).
This graduation thesis will also explore the technical aspects and design of the solution in-depth, giving out possible alternatives and their suitability. The thesis aims to incorporate latest technologies that will not only make the project feasible but will also make it sustainable and future-proofed. The technical parts of this project will be outlined in the report, with attachments of detailed 3D models and CAD drawings to support the descriptions. A physical model of the technical solution will be made and be used to explain the working process of the project.
The final step of the thesis is to check the scalability and adaptability of the project. Cities of similar flooding issues in India will be studied and checked whether this project is suitable as a modular solution. The cities will be chosen by identifying the crisis level in the city, its urgency in need for a solution. The project will be modified or altered in its smaller details, keeping its main process intact, to match the regional properties and requirements.
The results thus obtained will be tabulated and compared to highlight the advantages and limitations of this project, its scalability and the expected outcome. Supporting data and drawings will be documented and be submitted along with the main report to support it.
3
INDEX OF FIGURES
FIGURE 1TYPES OF FLOODING ... 8
FIGURE 2TYPES OF FLOODING ... 9
FIGURE 3CAUSES OF FLOODING DUE TO URBANIZATION ... 10
FIGURE 4FLOOD MEASURES ... 11
FIGURE 5GRADUATED PLANNING CONTROLS ... 11
FIGURE 6THE UNDERGROUND OF THE G-CANS ... 16
FIGURE 7OVERALL CONFIGURATION ... 16
FIGURE 8OVERALL LAYOUT OF THE PROJECT ... 17
FIGURE 9.A WATER PLAZA IN THE SPANGEN NEIGHBORHOOD OF ROTTERDAM TO CAPTURE FLOODWATER. ... 18
FIGURE 10.THE MAESLANTKERING, AN IMMENSE SEA GATE TO PROTECT ROTTERDAM. ... 18
FIGURE 11TOTAL DISSOLVED SALT CONTENT IN DAYS ... 22
FIGURE 12CR VI CONTENT IN WATER PER DAYS ... 22
FIGURE 13PH VALUE OF WATER PER DAYS ... 23
FIGURE 14FLOW OF PHYTOREMEDIATION ... 25
FIGURE 15NTU OVER 4 WEEKS. ... 26
FIGURE 16 PH BALANCE OVER 4 WEEKS. ... 26
FIGURE 17N IN PPM OVER 4 WEEKS. ... 27
FIGURE 18PHOSPHATE CONTENT OVER 4 WEEKS. ... 27
FIGURE 19SWOTANALYSIS OF THE PROJECT ... 30
FIGURE 20LOCATION OF THE MODULE ... 33
FIGURE 21BOUNDARIES OF THE MODULE ... 34
FIGURE 22THE PHYTODEPURATION TANK OF THE MODULE ... 36
FIGURE 23THE AERATION TANK AND VIEWING DECK ... 37
FIGURE 24INFORMATION DISPLAY SYSTEM ... 37
FIGURE 25QR CODE BOLLARDS ... 38
FIGURE 26.FLOW OF PROCESS ... 39
FIGURE 27INLETS FORM THE ROAD ... 43
FIGURE 28INLETS CONNECTING TO THE MAIN COLLECTION PIPE ... 43
FIGURE 29NETWORK OF MAIN COLLECTION PIPES ... 46
FIGURE 30RAINFALL-PIPE CAPACITY RELATIONSHIP ... 51
FIGURE 31COLLECTION TANK OF THE MODULE ... 52
FIGURE 32FLOW OF FLOOD WATER INSIDE MAIN COLLECTION PIPE ... 55
FIGURE 33PROCESS OF PHYTODEPURATION ... 56
FIGURE 34FLOW OF THE PROCESS ... 57
FIGURE 35TYPICAL PHYTODEPURATION TANK ... 57
FIGURE 36TYPICAL SUPERFICIAL STREAM TANK ... 58
FIGURE 37A TYPICAL SUB SUPERFICIAL HORIZONTAL FLOW TANK ... 59
FIGURE 38A TYPICAL SUB SUPERFICIAL FLOW TANK ... 60
FIGURE 39CLASSIFICATION OF TANKS DEPENDING UPON THE FLOW ... 60
FIGURE 40LEMNA ... 62
FIGURE 41AZOLA ... 62
FIGURE 42VICTORIA REGIA ... 63
FIGURE 43NYMPHAENA ... 63
FIGURE 44WOLFIA SPIRODELLA ... 63
FIGURE 45POTAMOGETON ... 64
FIGURE 46PHRAGMITES ... 64
4 FIGURE 48SCIRPUS ... 65 FIGURE 49THYPA ... 65 FIGURE 50ZIZANIA ... 66 FIGURE 51HYDRILLA ... 66 FIGURE 52CERATOPHYLLUM ... 66 FIGURE 53UTRICULARIA ... 67 FIGURE 54CHARA ... 67
FIGURE 55TYPICAL FLOATING FILTER ... 68
FIGURE 56DIFFERENCE IN WATER LEVEL/HEAD OVER CONTOURED GROUNDS. ... 76
FIGURE 57UNIT FLOOD LOSS IN THE CHOSEN AREA. ... 79
FIGURE 58AXIAL/MIXED FLOW PUMP. ... 83
FIGURE 59CSR STRUCTURE ... 88
FIGURE 60STARBUCKS’CSR PLAN ... 89
FIGURE 61ORGANISATION STRUCTURE OF L&T ... 90
FIGURE 62CSRBENEFICIARIES ... 90
FIGURE 63CSR ACTIVITIES OF L&T ... 91
FIGURE 64CSRINFUSION PROCESS CHART ... 97
FIGURE 65FLOOD CONTROL PROJECTS CONSIDERED FOR AHP ... 104
FIGURE 66.ANALYTICAL HEIRARCHIC PROCESS ... 105
INDEX OF TABLES
TABLE 1BEFORE/AFTER PHYTODEPURATION CHARACTERISTICS. ... 21TABLE 2GENERAL CHEMICAL PROPERTIES REDUCTION FACTOR –EXP 1 ... 24
TABLE 3CR REDUCTION OVER 15 DAYS... 24
TABLE 4GENERAL CHEMICAL PROPERTIES REDUCTIN FACTOR –EXP 2 ... 25
TABLE 5CALCULATIONS FOR AVERAGE MAXIMUM RAINFALL(500MM) ... 48
TABLE 6CALCULATIONS FOR EXTREME RAINFALL CONDITION(943M) ... 49
TABLE 7CALCULATION FOR REALISTIC RAINFALL CONDITION(30MM) ... 50
TABLE 8BIOLOGICAL CHARACTERISTICS –PHYTODEPURATION/HYDROPONICS SUITED PLANTS ... 72
TABLE 9SENSOR KPIS. ... 74
TABLE 10TOTAL COST BREAKDOWN ... 84
TABLE 11 TEMPLATE (MAIN DATA) ... 112
TABLE 12SAME WEIGHTAGE FOR THE MAIN AND SUB CRITERION ... 112
TABLE 13EQUAL WEIGHTAGE ONLY FOR THE MAIN CRITERION ... 113
TABLE 14DIFFERENTIAL WEIGHTAGE FOR THE MAIN CRITERION ... 113
TABLE 15DIFFERENTIAL WEIGHTAGE ARE ADDED TO THE SOCIAL AND ENVIRONMENTAL CRITERIA ... 114
TABLE 16AHPCALCULATION PROCESS ... 115
5
CONTENTS
ABSTRACT ... 2 INDEX OF FIGURES ... 3 1. URBAN FLOODING ... 7 1.1 Introduction ... 7 1.2 Causes ... 91.3 Existing Flood Measures ... 10
1.4 Guidelines on Sustainable Flood Prevention ... 11
1.5 Flood Control Around the World ... 14
1.6 Case Studies ... 15
1.6.1 METROPOLITAN AREA OUTER UNDERGROUND DISCHARGE CHANNEL, TOKYO, JAPAN .... 15
1.6.2 ROOM FOR RIVER SCHEME, NETHERLANDS ... 17
1.7 Literature Study ... 19
2. ACTIVE FLOOD CONTROL THROUGH MATRIX DRAIN SYSTEM AND PHYTODEPURATIVE FLOW REVERSAL ... 29
2.1 SWOT Analysis ... 30
2.2 Mumbai City – Module... 33
3 TECHNICAL DETAILS AND RAINFALL CALCULATION ... 39
3.1 Flood Module Working Network and Process ... 39
3.1.1. Process ... 40
3.2 Schematics ... 47
3.3 Flow conditions in the pipe ... 48
3.3.1 Average Max Rainfall Condition 500mm: ... 48
3.3.2 Extreme condition with rainfall at 943mm: ... 49
3.3.3 Realistic average rainfall condition 30mm: ... 49
3.4 The Collection Tank ... 52
3.5 Rainfall Calculation ... 53
3.5.1 Pipeline Network Calculation ... 53
4. PHYTODEPURATION ... 56
4.1 System Classifications: ... 57
4.1.1. Depending on Water flow:... 57
4.1.2. Depending on aquatic plant species: ... 61
4.2. Macrophytes Floating Filter: ... 67
4.3 FMF System Description ... 68
6
5. HYDROPONICS ... 70
5.1 Introduction of Hydroponics ... 71
5.2 Technical Implementation of Hydroponics in our project ... 75
5.3 Phytodepuration influenced hydroponics – technical Process: ... 76
6. PROJECT COST ANALYSIS ... 79
6.1 Damage & Economic Loss evaluation of Flooding. ... 79
6.2 Cost Breakdown for the Module ... 81
6.3 Total Costs ... 84
7. SOCIAL AWARENESS ... 86
7.1 Social Awareness for the proposed Flood Control System in Rural Areas ... 86
7.2 Work Structure of the Implementation of small-scale schemes on Rural Development platforms and CSR ... 87
7.3 CSR In Action | Case Studies ... 88
7.4 Proposed Flood Control System infused into a CSR framework... 91
7.5 Creating Social Awareness for this project ... 93
7.6 NGOs on Social Development ... 93
7.7 Implementation Procedure of CSR infused Hydroponics: ... 96
8. SOLUTION ANALYSIS ... 98
8.1 Public Opinion and Social Understanding of the Project ... 98
8.1.1 Sample Selection ... 98
8.1.2 Preparation of the questionnaire ... 99
8.1.3 Public Response and General Results ... 100
8.2 AHP – Analytical Hierarchic Process ... 103
8.3 SAW- Calculations and scenario. ... 111
8.4 AHP ... 114
8.5 Result ... 115
9. CONCLUSION ... 117
10. References. ... 119
7
1. URBAN FLOODING
1.1 Introduction
Urban flooding is the inundation of land or property in a built environment,
particularly in more densely populated areas, caused by rainfall overwhelming the capacity
of drainage systems, such as storm sewers. Although sometimes triggered by events such as flash flooding or snowmelt, urban flooding is a condition, characterized by its repetitive and systemic impacts on communities, that can happen regardless of whether affected communities are located within designated floodplains or near any body of water.
• Aside from potential overflow of rivers and lakes, snowmelt, stormwater or water released from damaged water mains may accumulate on property and in public rights-of-way, seep through building walls and floors, or backup into buildings through sewer pipes, toilets and sinks.
• In urban areas, flood effects can be exacerbated by existing paved streets and roads, which increase the speed of flowing water. Urban flooding occurs when water flows into an urban region faster than it can be absorbed into the soil or moved to and stored in a lake or reservoir. It can be caused by flash flooding, coastal flooding, river floods or rapid snow melt.
• With climate change setting in, the rainfall patterns and quantities have been wavering from the norms in the recent times. This, when combined with urbanisation gives rise to problems like urban flooding.
• In general, urban flooding is as disruptive to daily life as it can be dangerous. Urban floods are a great disturbance of daily life in the city. Roads can be blocked, people can’t go to work or to schools. The economic damages are high, but the number of
Objectives –
• To determine the causes of floods, existing flood control measures, guidelines on effective flood control & prevention
• To analyze the different flood control measures all around the world with deeper analysis on key case studies.
• To analyse few phytoremediation projects in depth (literature review) to obtain general ideas and concepts for this thesis.
8
casualties is usually very limited, because of the nature of the flood. The water slowly rises on the city streets. When the city is on flat terrain the flow speed is low and you can still see people driving through it. The water rises relatively slow and the water level usually does not reach life endangering heights.
• The economic cost of urban flooding can also be high, as water damage to homes and buildings can be very expensive to repair.
Urban flooding occurs when water flows into a city or town faster than it can be drained, absorbed into the soil or moved to and stored in a man-made lake or reservoir.
The four different typologies of urban flooding could be stated as follows:
• Pluvial flooding - The accumulation of local rainfall runoff due to insufficient drainage and buffer capacity.
• River flooding - Overflowing rivers due to insufficient capacity of the rivers to discharge the rainfall or rapid snow melt in a catchment/river basin, which can spread as wide as a whole region or even across borders.
• Coastal flooding - Storm surges induced by heavy storms, gale-force winds and hurricanes causing sea levels to rise and flood a city.
• Groundwater flooding - Water that collects or flows beneath the surface of the
ground, filling the porous spaces in soil, sediment, and rocks – originating from
rain, melting snow and ice.
9
1.2 Causes
It can be caused by flash flooding, coastal flooding, river floods or rapid snow melt, but mostly urban floods are related to man-made causes which generally cause flash floods. In the cities and towns, it is a recent phenomenon caused by increasing incidence of heavy rainfall in a short period of time, indiscriminate encroachment of waterways, inadequate capacity of drains and lack of maintenance of the drainage infrastructure. Common consequences of urban development & infrastructure include the removal of vegetation and an increase in impervious surfaces and drainage networks, all of which increase precipitation runoff into streams and rivers. This may result in more flooding.
10
Figure 3 Causes of flooding due to urbanization
Some man made causes are:
• ENCROACHMENT - More migration lead to less availability of land which lead to higher economic value of land. So, there would be more encroachment of water bodies which reduced economical services from water bodies.
• POLLUTION - Explosive increase in the urban population without corresponding expansion of civic facilities such as lack of adequate infrastructure for the disposal of waste results in waste clogging the natural channels and storm water drains. Thus flooding.
• ILLEGAL MINING ACTIVITIES - Illegal mining for building material such as sand and quartzite both on the catchment and on the bed of the lake have extremely damaging impact on the water body.
• INTERFERENCE IN DRAINAGE SYSTEM - Drainage congestion caused by badly planned construction of bridges , roads , railway tracts, hampers the flow of water and the result is flood.
• UNPLANNED RELEASE OF WATER FROM DAMS & POLICY ISSUES - Unplanned release of water from dams lead to floods along with lack of integrated flood control measures and incompetent implementing agencies.
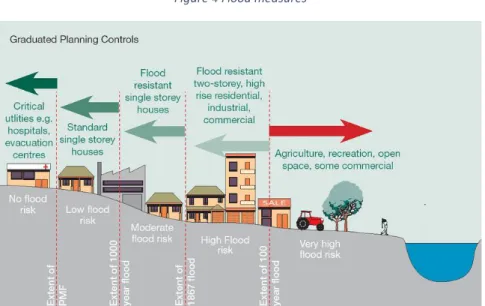
1.3 Existing Flood Measures
Flood events in recent years resulting in life losses, huge damages, demand urgent reaction. The emergency is also stressed by the fact that we face the threat of climate change. Urbanization, thus leading to flood control only proves to make matters worse. Due to this,
11
flood control measures are very essential in order to forecast, prevent, reduce and reverse the damages that may or have already occurred.
Flood Mitigation/Control mean planning, programming, setting new policies and co-ordinating, facilitating, raising awareness, assisting and strengthening the existing policies. It also involves education, training, forecasting and warning measures. Flood loss prevention and mitigation includes structural flood control measures such as construction of dams or river dikes and non-structural measures such as flood forecasting and warning, flood hazard and risk management, public participation and institutional arrangement, etc.
Figure 4 Flood measures
Figure 5 Graduated Planning controls
1.4 Guidelines on Sustainable Flood Prevention
The United Nations and Economic Commission for Europe (UN/ECE) have drawn up a set of Guidelines on Sustainable flood prevention (2000). This is a document which offers more strategic points than technical ones and is written in three parts, wherein part I consists of the basic principles and approaches. Part II concerns how to translate and implement the principles and approaches. While the conclusions are drawn in part III.
12
There are a few general considerations to be kept in mind, however, before following and implementing flood control measures.
• Flood events are part of nature. Natural hazards and flood events are part of nature. They have always existed and will continue to exist. What we need to prevent, and control are man-made occurrences which might pose an opportunity to worsen these floods and natural calamities.
• Society has become more vulnerable to natural hazards. Although floods are natural phenomena, human activities and human interventions into the processes of nature, such as alterations in the drainage patterns from urbanisation, agricultural practices and deforestation, have considerably changed the situation in whole river basins. • The flood risk increases where risk is defined as the probability of occurrence
multiplied by its impact. The impact of flooding increases: the impact of floods in terms of human health and economic losses has risen, and the planning of protection against floods can no longer be limited to protecting some isolated assets from certain types of danger.
• Flood protection is never absolute. We will have to keep the unpredictability of nature in mind. Flood protection is never absolute, and things can go wrong. The question regularly arises as to what safety is available at what price, and how much of the remaining risk has to be accepted by society. Risk management will be the appropriate method to deal with this challenge. Emergency and disaster planning in case of extraordinary situations are important, also in respect of environmental effects which can occur in case of flooding of industrial sites.
The same document further deepens into giving certain measures that are necessary for sustainable flood control management. A plan that is based on an integrated approach covering all relevant aspects of water management, physical planning, land use, agriculture, transport and urban development, nature conservation, at all levels (national, regional and local) must be considered. In the development of a flood management plan, decision makers at all levels (local, regional, national and international) as well as stakeholders and civil society should be involved.
The main practices that should be taken into account while drafting flood control measures are as follows:
• INTEGRATED RIVER BASIN APPROACH - Experience has shown that effective measures for flood prevention and protection have to be taken in the level of river basins and that it is necessary to take into account interdependence and interaction of effects of individual measures implemented along water courses. (In case of urban flooding, this still proves to be a good measure as it prevents an added problem of river floods). For an integrated flood prevention, protection and mitigation, a good combination of structural measures, preventive measures and operative measures during flood events are necessary: building codes and legislation to keep structures away from flood-prone areas, appropriate land use, adequately designed floodplains
13
and flood control structures planning, mitigation, early-warning systems, correct risk communication and preparedness of the populations how to act during floods. • PUBLIC AWARENESS AND PUBLIC PARTICIPATION - Problems associated with floods
are often not sufficiently recognised and acknowledged. Communication plan to offer individuals an understanding of the nature and scope of these risks should be developed. Regional and municipal authorities will see to its continued and permanent implementation at the regional and local level in order to involve owners and administrators of properties, including organisations at levels of regions, districts, municipalities or individuals, and enable them to take preventive and protective actions by themselves and offer their opinions about the implementation of preventive measures for reduction of flood damages. All measures linked to public information and awareness raising are most effective when they involve participation at all levels. Public participation in decision making is a cornerstone of successful implementation of integrated and comprehensive action plans, both to improve the quality and the implementation of the decisions, and to give the public the opportunity to express its concerns and to enable authorities to take due account of such concerns.
• RETENTION OF WATER AND NON-STRUCTURAL MEASURES - The storage effect of vegetation, soil, ground and wetlands has an important mitigating effect particularly in minor or medium-scale floods. Each of these storage media is capable of retaining certain quantities of water for a certain length of time. A large natural storage capacity provides slow rises in water levels and comparatively minor floods. Retaining water on the natural media should have priority over swift water run-off. In some cases, in the event of heavy and lasting rainfall, natural storage impact is less relevant as regards the reduction in flow but is still extremely beneficial when it comes to reducing sediment yield. Conserve, protect effectively and, where possible, restore degraded wetlands and floodplains, including river meanders, oxbows, and especially reconnect rivers with their floodplains. Conserve, protect effectively and, where possible, restore vegetation and forests in mountainous areas, riparian woodland and meadows. Lastly, improve land reclamation including reducing the drainage of the landscape, reversing the straightening of watercourses and bank reinforcement: “let rivers spread”. All work relating to draining swamp lands and drying damp and unsanitary land shall be considered as contrary to the objective of flood prevention.
• LAND USE, ZONING AND RISK ASSESSMENT - Improve knowledge concerning extent and evolution of floods and water related problems10, simulate different high water incidences, study and compare zoning scenarios, and integrate this risk assessment, via identification and mapping of hazards11 and high-risk areas into land use, emergency and rescue planning policies. Immediate flood plains should be identified and designated by law as priority sites for flood retention or to restore, as far as reasonable, mobility to waterways. Stopping building development in the immediate areas at risk of floods, landslides or dam failures if an unacceptable risk to human lives
14
or material damage exist, should be regulated. Exceptions should be restricted to those uses which are of stringent necessity.
• STRUCTURAL MEASURES AND THEIR IMPACT - Complement the flood protection in residential areas with limited space and where necessary, by flood protection walls, mobile closures, superstructures or simple sandbags, bearing in mind that their implementation must refer to a systematic planning co-ordination. The use of non-permanent forms of barrier for flood protection can provide much needed flexibility and increased opportunities for effective management of a wide range of flood events. The level of deployment depends on the length of the warning and the capacity available for storage, transport and erection capacities without any deterioration of the evolution of floods in the downstream direction.
• FLOOD EMERGENCY - Comprehensive national and local contingency plans to respond to flood events should be properly prepared in due time and maintained in operational status everywhere flooding might occur. These plans should cover the crisis management before, during and after the flood event: organisational schemes with a clear allocation of responsibilities and authorisations on each level, preparation and provision of information for the crisis management of large-scale and local disasters; sources of and access to real-time information. Evacuation plans should be based on the information given in the confinement plan to support effective measures in saving lives, movables, livestock, to remove hazardous materials in order to save the environment from accidental pollution.
• PREVENTION OF POLLUTION - The disruption of water distribution and sewage systems during floods contribute greatly to severe financial and health risks. Preventive measures should be taken to reduce possible adverse effects of floods on these infrastructures. Alternative solutions should be planned and implemented to guarantee the operation of water distribution and sewage systems. Emergency management planning and operation against the harmful impacts of water pollution on ecosystems during minor and major floods should be properly prepared in due time and maintained in operational status, particularly to support effective measures and evacuation plans to secure or remove hazardous materials where appropriate.
1.5 Flood Control Around the World
NORTH AMERICA
- An elaborate system of flood way defences can be found in the Canadian province of Manitoba. The Red River flows northward from the United States, passing through the city of Winnipeg (where it meets the Assiniboine River) and into Lake Winnipeg.
15
To protect the city from future floods, the Manitoba government undertook the construction of a massive system of diversions, dikes, and flood ways (including the Red River Floodway and the Portage Diversion).
ASIA
- Beneath Tokyo, Japan's densest city, a mammoth network of tunnel works as the city's ambitious flood management system. Comprising of two massive tunnels, known as the Metropolitan Area Outer Underground Discharge Tunnel or G- Cans project, and the Furukawa Reservoir, Tokyo’s flooding system symbolises one of the most remarkable city flood control systems in the world. The G-Cans Project was completed by 6 different construction firms in 2006 and cost around $3 billion US dollars. The completed structure is enormous and is estimated to have halved flood damage since construction finished.
EUROPE
• London is protected from flooding by a huge mechanical barrier across the River Thames, which is raised when the water level reaches a certain point.
• Venice has a similar arrangement, although it is already unable to cope with very high tides. The defences of both London and Venice will be rendered inadequate if sea levels continue to rise.
• The largest and most elaborate flood defences can be found in the Netherlands.
1.6 Case Studies
1.6.1 METROPOLITAN AREA OUTER UNDERGROUND DISCHARGE CHANNEL, TOKYO, JAPAN Tokyo, one of the densest cities on the planet, is home to one of the most ambitious and enormous flood-control systems ever created. And it is almost entirely invisible to Tokyo residents. It is the main water tank of the Metropolitan Area Outer Underground Discharge
Channel facility in Kasukabe City, 19 miles north of Tokyo, Japan, which is one of the most
famous water infrastructure complex in the world, and also the world’s largest underground flood diversion facility.
Building flood protections
Starting in the 1920s, Japan began building water channels and an extensive set of levies. But storm after storm and flood after flood proved that the system was not enough. After a particularly deadly stream of six floods in the 1980s left tens of thousands of homes in the capital city damaged, national leaders decided Tokyo needed special attention.
16
The G-Cans Project
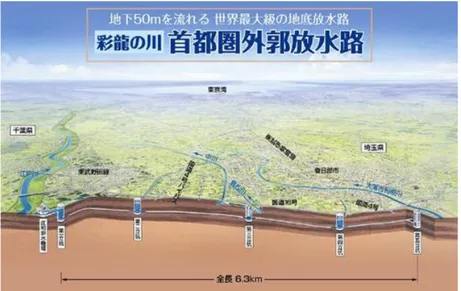
Commissioned in 1992, construction began on the “world’s largest drain” in 1993. The concept was relatively simple. The plan connected existing rivers and waterways to overflow pipes and drains. This allowed the above ground drainage system in central Tokyo to continue in operation, while its overall capacity was massively expanded underground.
Figure 6 The underground of the G-cans
The underground system was composed of 5 giant cisterns that collected excess water from rivers and waterways. Each cylindrical shaft measures about 70 meters in height and 30 meters in diameter, spacious enough to park a space shuttle. These cisterns are connected by 6.5 kilometres of tunnels 10 meters wide buried 50 meters deep. The tunnels allowed the cisterns to provide capacity support to each other. The pipes take the water from the cisterns to an enormous pressure-controlled tank. This tank measures 177 meters long, 78 meters wide, and 18 meters tall. 59 pillars of 500 tons each support the ceiling and break up the power of incoming water.
17
Figure 8 Overall layout of the project
In terms of flood safety, the pressure tank is a staging area before a set of four turbines pump the water into an area of the Edo river that can take the overflow safely out to sea. The pressurized nature of the tank allows the system to regulate in case one of the turbines breaks down.
It can be hard to measure the impact of a preventative measure, because, by its nature, it prevents a damaging event from happening. By some estimates, the G-Can flood control system has cut flood damage in half. Tokyo and the surrounding area are much safer.
Obstacle
This project cannot be implemented in cities like Mumbai since they are not of any urban structure. The city of Mumbai grew rapidly without any planned expansion, meaning that the tunnels similar to Japan could not be implemented under the city. There is also not much regulations when it comes to building a tall structure in Mumbai, due to rampant corruption. Due to this, a planned construction of tunnels cannot be made, since there will not be any necessary data related to the existing buildings in the region.
Also, the soil nature in Mumbai is very much different and varying when compared to Japan, with types such as clay and porous rocky soil nearby one another, making the soil calculation tedious for the entire project, with no one predefined presets.
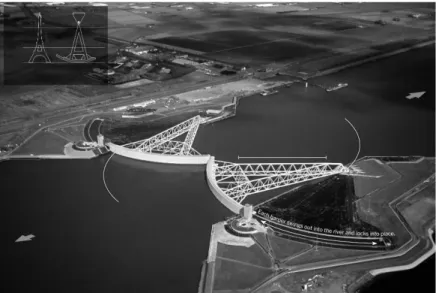
1.6.2 ROOM FOR RIVER SCHEME, NETHERLANDS
One of the most infamous examples, and often thought to be the best example of flood management in a country, belongs to the Netherlands. After severe flooding in the North Sea in 1953, which claimed 1,800 lives, a Delta Works Commission was installed to make sure that a similar tragedy did not befall them again.
18
Since then, the Netherlands has seen a notable improvement in its flood management systems, which are now world renowned. Some of the most notable examples of measures in place in the country include the ‘Room for River’ scheme. This has cost the Dutch government around $2.8 billion dollars and features a number of steps in order to embrace the flow of water in the country and reimagine the existing landscape to provide better protection from flooding.
Much of the Netherlands is below sea level and major floods have occurred every generation or so for hundreds of years. In a warming world with increased rainfall and sea level rise, the threat from floods is increasing worldwide, and the Dutch are leading the way in water management engineering. Only 50 percent of the Netherlands is more than a few feet above sea level, so over the centuries the Dutch have become expert at water management.
The old paradigm (the old flood control measure) was about confining rivers and building and strengthening the dikes along the rivers, but then they decided to explore a new approach, in which they give more space to the water. They now allow the river to expand when large volumes of water are entering the country. It's not fighting against water; it is living with water.
Figure 9. A water plaza in the Spangen neighborhood of Rotterdam to capture floodwater.
19
Cities now use parks and public spaces as emergency reservoirs for floodwaters created by severe rainfall. For storm surges from the ocean, they are changing their approach from a purely defensive system to one that prepares for the failure of these systems — what is called a “multilevel protection.” The first level is the flood protection systems, the primary dike systems and the second level is the urban and spatial planning.
These steps have included relocating dykes, lowering levels of floodplains in depth and, in some cases, relocating inhabitants to non-floodplain areas. Large numbers of inhabitants living alongside rivers are moved inland to allow water to have a freer passage through the Dutch waterways.
Though it may sound like the move would face severe kickback from government and locals, the flood management initiatives in the country actually receive enormous support from the government, and general understanding and appreciation from the affected population.
1.7 Literature Study
The concept of phytodepuration or phytoremediation has been extensively researched in the field of waste water purification and industrial waste water treatment. Though the concept has not been used for the purification of rain and flood waters, it is safe to proceed forward with the assumption that the same concept and research results of the performances of the plants and the entire treatment system as a whole is suitable for the flood water purification. The research papers and journals published in Italy and India are mainly focused, with highlights and inputs from journals from other countries, where the concept has been used for indoor water treatment prototypes.
Summary
The journal published in ncbi.com by Priyanka Saha, Omkar Shinde and Supriya Sarkar on the topic of “Phytoremediation of industrial mines wastewater using water hyacinth” show the extensive usage and purification of hyacinth plant for the purification of industrial waste water in the Sukinda Chromite Mines in Orissa, India. The water in the mines are filled with
highly toxic Hexavalent Chromium (Cr VI).Wastewater from chromium-contaminated mines
exhibit potential threats for biotic community in the vicinity. A water hyacinth species Eichhornia crassipes was chosen to remediate the problem of Cr (VI) pollution from wastewater. It has been observed that this plant was able to remove 99.5% Cr (VI) of the processed water of SCM in 15 days. This aquatic plant not only removed hexavalent Cr, but is also capable of reducing total dissolved solids (TDS), biological oxygen demand (BOD), chemical oxygen demand (COD), and other elements of water also. Large-scale experiment was also performed using 100 L of water from SCM and the same removal efficiency was achieved.
The paper published in the International Conference on Water Resources, Coastal and Ocean Engineering – 2015 by Samson Ojoawo, Gaddale Udayakumar and Pushparaj Naik on the topic of “ Phytoremediation of Phosphorus and nitrogen with Canna x generalis Reeds in Domestic
20
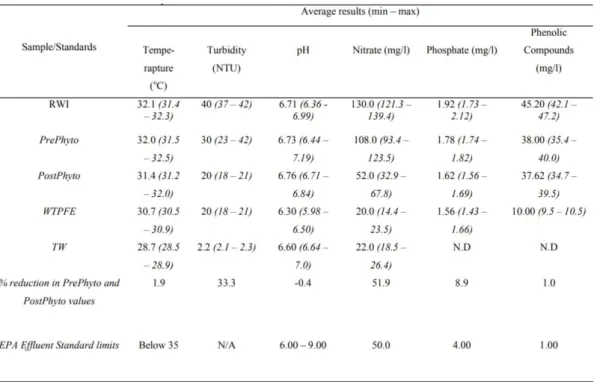
Wastewater through NMAMIT Constructed Wetland” explains the method and advantages involved in phytoremediation or phytodepuration using canna x genralis for the removal of phosphorous and nitrogen in the wastewater from the NMAM institute of Technology. The results thus obtained form this research shows the decrease in the turbidity, Nitrates and Phosphates in the water along with the balancing of the pH after a period of 4 weeks.
The above 2 papers were done with localized research in India, with plants available and suitable for the Indian ecosystem. These situations not only act as pilot programs for our project, but also provide valuable research data, without which, obtaining them would have been time consuming process. The third research paper is the doctoral research of Jessica Tamiazzo from the university of University Degli Studi di Padova on the topic of “Evaluation of phytodepuration intensified systems for the treatment of agricultural and livestock wastewaters” under the department of Agronomy Food Natural resources Animals Environment. This paper deals with the research of purification of waste water from the pig breeding industry through natural filtration and phytodepuration process. This process being a long term project spanning over 2 years, covers the topic in detail, with short and long term purification results over different types of plants.
Research Process and Results
Phytoremediation of industrial mines wastewater using water hyacinth
The experiments were conducted in a series of rectangular plastic container containing 5 and 100 L of water from SCM, respectively, at an ambient temperature range (25–30°C). 250 g (for 5 L water) of fresh biomass of Eichhornia crassipes was cultured in a tub for the period of 7 days, whereas one of them was used as control and again the fresh biomass was noted for the following experiments. Plastic jar with only SCM effluent (not using plant) was used as control. The test durations were 0 (initial day), 5, 10, and 15 days, respectively. Deionized water was added daily to compensate the water loss through plant transpiration, sampling, and evaporation. The changes in pH, TDS, and Cr(VI) concentrations were determined at regular intervals. After the completion of each test duration, E. crassipes were separated into leaves, shoots, and roots for the analysis of Cr(VI) accumulation, bio-concentration factor. The TDS and DO of the treated water were also measured to know the effect of accumulation on the plant. After each experiment, plants were recycled for the next experiment. This is repeated 5–6 times. After a certain time, aquatic plants were harvested. If the plants are not harvested then after their death and decomposition, nutrients will be released back into the water system. Therefore, regular harvesting was done to avoid this process of release back of nutrients. After getting successful results, large-scale experiment carried out in 100 L chromium-contaminated processed water from SCM. For this experiment, 5 kg (for 100 L water) of fresh biomass of E. Crassipes was used.
The table given below shows the values obtained before and after the phytodepuration process, over a time period of 15 days. These values are then compared to obtain the net reduction in each of the chemicals or factors associated with the untreated water over the treated water. This type of results can be expected for the flooding model due to the similarity
21
in nature and surroundings, but the input values will be lower since the flood water expected is from an urban area, with lower possibility for high presence of Cr VI.
Parameters Initial (0 Day) value Conc (ppm) Mean ± SE
Final (15 Day) Conc (ppm) Mean ± SE Ca 16 ± 0.45 10 ± 0.45 * Mg 46.23 ± 0.07 32 ± 0.45 Fe <0.001 <0.001 SiO2 30 ± 0.45 24 ± 0.45 *** SO42− 1.7 ± 0.45 1.4 ± 0.45 Co <0.001 <0.001 Total Cr 2.0 ± 0.071 0.01 ± 0.005 *** Cr(VI) 2.0 ± 0.071 0.01 ± 0.005 *** Ni <0.001 <0.001 Ti <0.001 <0.001 TDS 290 ± 0.0089 235 ± 1.11 ***
22
Figure 11 Total Dissolved Salt content in days
The above given graph explains the decrease in the total dissolved salts in the water by the plants over 15 days. This factor is very crucial since the flow reversal process should not be sending saline water below the ground, increasing the TDS in the aquifer. This graph indicating the decrease in the salts show a positive response for the principle used in both the projects, though having different intended environment.
23
The above graph shows the absorption of toxic Cr VI by the Hyacinth plants over 15 day period. The input or introduction of 2ppm of Cr VI is done to mimic the chromium laced water. From standard experiment data, it was observed that, at lower concentration (0.5), water hyacinth is very efficient in reducing 99% of Cr (VI) from water. Also, in case of 0.5 ppm standard chromium solution, minimum time was (only 8 days) required to remove 99% hexachrome from water. In addition to that, in case of other standard solutions (0.75–2 mg/L) maximum 10–15 days were required to remove chromium as compared to 20 days required at higher concentration (5 mg/L).
Figure 13 Ph value of water per days
The table above indicates the balancing of the pH by the hyacinth plant over 15 days time period. The input water was at a pH value of 8.2, over the basic nature. The phytodepuration process over 15 days has reduced the pH to a neutral value of 7.2 – 7.4. This factor is not only important for the acidic nature of the water, but also indicates the survival nature of the plants in such aquatic environment.
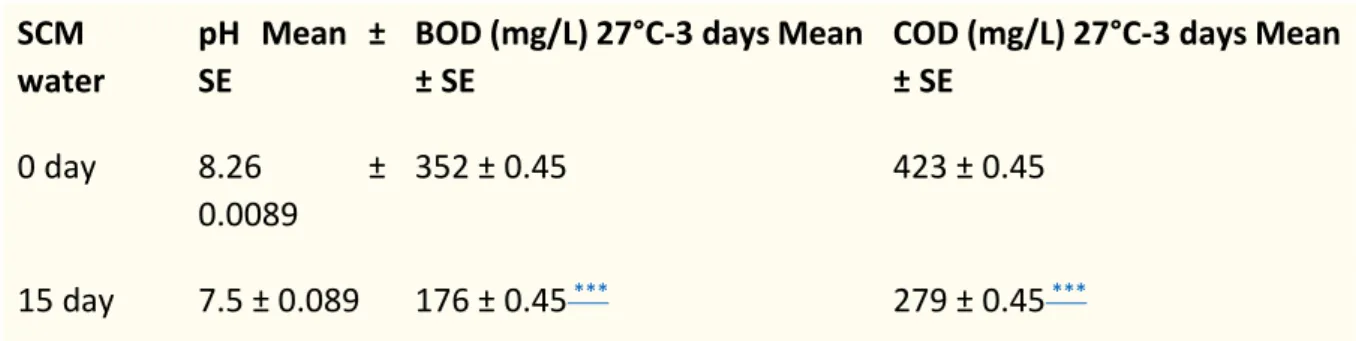
In general, all the waste samples collected were devoid of dissolved oxygen (DO). After phytoremediation experiment, there was increase in the DO after treatment as indicated by reduction of BOD and COD in the wastewater. In present study, the introduction of water hyacinth in SCM wastewater has shown 50% and 34% reduction in BOD and COD, respectively. The input, output values along with the reduction factor for BOD, COD and pH are given in the table in the following page.
24 SCM water
pH Mean ± SE
BOD (mg/L) 27°C-3 days Mean ± SE
COD (mg/L) 27°C-3 days Mean ± SE
0 day 8.26 ±
0.0089
352 ± 0.45 423 ± 0.45
15 day 7.5 ± 0.089 176 ± 0.45 *** 279 ± 0.45 ***
Table 2 General Chemical Properties Reduction Factor – Exp 1
To mimic an average situation, a more realistic situation and worst case scenario, different ppm quantities of the chemical chromium VI are added to the water and tested for the same. The results are as given below.
Standard chromium solution (ppm) 5 day 10 day 15 day
0.5 0.2 ± 0.045 0.5 ± 0.045 0.98 ± 0.006**
0.75 0.53 ± 0.004 0.7 ± 0.045 0.97 ± 0.006***
1.0 0.45 ± 0.004 0.7 ± 0.045 0.98 ± 0.004***
2.0 0.39 ± 0.006 0.67 ± 0.004 0.92 ± 0.006***
5.0 0.2 ± 0.045 0.45 ± 0.004 0.67 ± 0.004*
Table 3 Cr Reduction over 15 days
From the above table, it is visible that the water’s chromium content is at general reduced to around 0.7-0.9 ppm, which is within the usable limit for general purpose, not for potable purpose. Further natural purification occurring under the ground in the aquifers purify the water even more, reducing the total dissolved content to a very feeble value, thus making it usable for most domestic purposes when pumped out.
The produce thus obtained from this process i.e. the water hyacinth can be used as food since it is rich in proteins and vitamin A. But care must be taken to ensure that the water in which the plants grew didn’t have much chemical contents or that the plant itself didn’t absorb any chemicals since it will be toxic and can cause problems when ingested. The sludge obtained from this process also act as natural fertilizer, with no side effects. It can be used for anaerobic digestion of methane and fermentation process in alcohol. These side produces will help in balancing the process cost of the project, or can even act as community strengthening factors, which we will discuss further down the project.
Phytoremediation of Phosphorus and nitrogen with Canna x generalis Reeds
Wetland construction is usually done in shallow pits that are installed with a drain pipe in a bed of pebbles or gravels and sand layers, upon which the native vegetation is planted. The vegetation may be emergent macrophyte, floating plant or submerged plant species. To prevent pollution of the underground water beneath the wetland, an impermeable
25
membrane is provided at the bottom. According to (Baskar et al., 2014), the basic types of treatment wetlands are free water surface (FWS) wetland and subsurface flow (SSF) wetland. The SSF constructed wetland is further classified into horizontal subsurface flow (HSSF) and vertical subsurface flow (VSSF). When the wastewater is channeled to flow through the constructed wetland, it is treated by the various processes of sedimentation, filtration, oxidation, reduction, adsorption, precipitation, bacterial metabolism, nitrification, de-nitrification, and plant uptake. Constructed wetlands have the potential to treat a variety of wastewaters by removing organics, suspended solids, pathogens, nutrients and heavy metals. Evapotranspiration may significantly reduce the amount of discharged flow and may influence the removal rate of nutrients from constructed wetlands.
Figure 14 Flow of phytoremediation
26
The above given table shows the input and output values for different chemicals and factors such as pH, nitrates, phosphates, NTU etc. It is notable that the reduction in the nitrates is much higher than other chemicals due to the aerobic nature of the plants selected for the phytodepuration process. The reduction of these factors over a period of 4 weeks is noted and plotted over graphs with the chemical indicators along Y axis and time in weeks plotted on X axis. These graphs are as given below.
Figure 15 NTU over 4 weeks.
The above graph shows the reduction and maintenance of the turbidity NTU of the water over 4 weeks time period. It is notable that the water pre-phytodepuration fluctuates inn the NTU value over the weeks but the processed water has maintained the NTU at 20, with slow reduction over the time period. With availability of loner time period, the NTU is expected to be reduced even further down by the plants. It is also notable that this reduction factor changes with different plants and an extensive research is needed to determine the most optimal plant.
Figure 16 pH balance over 4 weeks.
The above graph shows the balancing of the pH from the acidic nature of the input water to the pH neutral value of 7 – 7. This occurs due to various chemical changes in the water by the plants reacting with the contaminants. Mainly due to the formation of DO and balancing reactions from the roots of the plants, the pH neutralization occurs in the water.
27
Figure 17 N in ppm over 4 weeks.
This table shows the drastic reduction in the nitrate content in the water, which reduces the value of N to more acceptable ppm value, thus making it less toxic. This drastic reduction has ccured over a period of 4 weeks. The journal suggests further reduction is possible when there is more retention period is available as the reduction curve sees a change in the slope over the period. The reduction over larger ppm at 75 – 50 takes longer period when compared to the reduction from 50 to 25, making it a steeper slope in the soluble end.
Figure 18 Phosphate content over 4 weeks.
Finally, the above table gives the changes in the phosphate content in the solution. A fluctuation is seen between the weeks1 – 2 – 3 with a decrease and increase. This phenomenon is explained as the increase in the inherent phosphates in the input water and also the by products of other reactions in the water. This phenomenon when tested under other water inputs, has shown a gradual reduction. This graph is also conclusive in showing how the reduction of phosphates is not as fast as the nitrates, because of the ammonic or NH reactions that any plant undergoes over photosynthesis and its growth period.
These researches reviewed above give a general guideline and research data with which our project can proceed in a progressive direction, with purification of water within scope of the undertaken procedure. With researches diversified in the plant usage, nature of the water system, the type of chemicals present, the nature of the reactions taking place etc, it is possible to predict a path for the phytodepurative flood water purification project. It is also noted that the project can have its progress in the research and experimentation sections in a rapid way, since these experimentations are already performed and the results are available for analysis and usage from the above reviewed papers.
28
An indepth review of the pig breeding facility research is not done since it is a long term proect and the same cannot be implemented or incorporated in our project, which aims to see results within a period of 2-4 weeks, as the monsoon period is very rapid and harsh. The purification has to be done in a very fast way and sent to the ground aquifers in the case of normal rains over 2 weeks, or stored, purified and sent to ground over 4-8 weeks in case of flooding waters, where the flow reversal will occur only after the rain period and just before the summer onset, to remove as much contaminants from the water as possible and to effectively purify all the water collected.
29
2.
ACTIVE FLOOD CONTROL THROUGH MATRIX DRAIN SYSTEM AND
PHYTODEPURATIVE FLOW REVERSAL
This project of "Active Flood Control through Matrix drain system and Phytodepurative Flow Reversal" aims to achieve the target of active flood control along with ground water regeneration. This project, in collaboration with Politecnico di Milano and few other institutions and authorities of Public Works Department of Trichy, India, has been proceeded with the main aim of achieving Total Sustainability, with zero environmental pollutions and negative impacts, with the target of improving the existing social conditions in the city of Mumbai, India, while effectively controlling seasonal floods. This project aims to produce a module, a primary design that can be modified in accordance with the environmental requirements of the city for which active flood control is required.
The concept of interlaced matrix style layout is used for the drainage system, a whole new concept in India, with the use of materials that are quick and easy to install. The target of achieving ground water regeneration is achieved by flow reversal, wherein the water is pumped down through artificial force or by gravitational infiltration through shafts into the aquifers or ground water table. This water is preliminarily purified by Phytodepuration, where the water is purified by the plants, a self-sustaining process.
In addition to the design of the project module, the flood & Rainfall calculator is designed and submitted. Also, many contractors were contacted, and a model tender call is formulated, obtaining prices and supply plans for the many parts of the project. Total cost plan will be provided for the project with the best tenders and the cost details are submitted in this report.
In addition to this, a pilot project of active flood control with hydroponics is produced, to simulate and assess the performance of the flood control method in hilly regions, to credit its adaptability and scalability. The concept of Phytodepuration - Phytoremediation is modified as hydroponics, where the plants not only purify the water, but also produce high yields in cash crops, with little to no soil. This concept is introduced to enable an active economic growth in rural areas, achieving economical sustainability.
The project is aimed not only in India but also in other south Asian countries, which experience high rainfall and flood occurrence, with the aim of achieving total or global sustainability through Social, Environmental and Economical Sustainability of the considered region. Through this project, we submit a proposal for the betterment of the city of Mumbai through the flood control and ground water regeneration with our module.
Objectives –
• To perform SWOT analysis on the phytodepuration module in the Mumbai City – Context.
• To report the geographical location and associated properties of the module. • To describe and highlight the working of the entire phytodepurative module in an
30
2.1 SWOT Analysis
Figure 19 SWOT Analysis of the project
Strengths :
1. Effective flood control and minimizing of economical loss: The flooding
condition in Mumbai and other cities are expected to reduce with this implementation of the project, since it directly targets the hydrological phenomenon of flooding, by calculating its flow rate, stagnation rate, flow reversal properties etc. This purpose of the project will also increase the popularity of it in many rural and growing cities, targeting the drain construction phase of the city, where instead of the traditional drains, the HDPE pipes with matrix layout can be implemented as a long term solution
2. Improved Environmental Conditions : The implementation of this project will not only effectively control the flooding but will also improve the environmental conditions of the area, since the project has many green solutions and functions, acting complimentarily to the main solution, thereby making the entire project environmentally attractive and green. 3. Future Proof : The project aims not only to control the floodings happening in the city but to also act as a long term solution for the drainage problem of the city as well as one of the possible solutions for the draught problems faced by many cities in India due to high consumption rates of the ground water. The materials used in this project will be environmentally sustainable and have long life span, which means they are suitable for possible increase in the intake and usage due to the expansion of the city and its population thus making it future proof. Since the project utilizes high quality plastics and components with high serviceability, they are easy to maintain and repair, meaning less cost in the overall run of the project.
4. Cheap and environmental friendly materials : The materials used in the project are selected or designed to be environmental friendly since the whole purpose of the project is to achieve effective flood control through total sustainability. Materials such as hydrophilic concrete and High Density Poly Ethylene Plastics are used for the construction of tanks and
31
the pipeline system for the whole project. This ensures that there is no green house effect or soil pollution taking place due to the project. The materials used are also very cheap to manufacture and assemble on the site since they are of basic forms and high availability in the region. The labour force is also highly competitive in the case of cost due to local availability and surplus supply. Also considering the trade routes and policies of India with S.E.A. countries and China, the materials can be manufactured in bulk with minimum cost and easy transportation to the sites.
Weakness:
1. Long Implementation Process : The administration and tendering process for new projects, especially for large scale projects are very slow and tedious, taking months if not a year for approval from the government. Combining this with the changing political climate in the region during the time of implementation, the delays could be very long. The ever changing political stances in major cities determine the continuity of the administrative procedures for the project and if there is a shift in the political structure, the delays could be huge and in some cases, the project could be halted for an indefinite period.
2. Red Tape Issues : The term red tape refers to the smaller steps in administration and approval process. This also refers to the huge corruption problem in India, where for any approval process, a part or percentage of the budget has to be paid as a bribe in many government offices.In India, the slow government process affects this stage, where the approval phase is shifted around many days due to the delays and payment issues under the table. Since many phases and steps could begin only after this stage of approval, this block will lead to a standstill for the entire project affecting its initial phase.
3. Heavy Investment : The investment required for this project is high and the payback can be expected only in terms of economic damages avoided and not through cash inflows. Not many local body governments would undertake such projects unless sanctioned and funded by the central or state government. The payback system for these projects in itself will deter the profit oriented private sectors to perform a Public Private Partnership (PPP), with schemes such as design, build and operate being impractical. They can be tendered and contracted with the funding for the entire process, with or without micro-managing the project from the government side.
4. Periodicity / frequency of floods : The periodicity and the frequency of the floods in Mumbai also act as a threat since the project will be operational only during this period. It is also mentionable that the project’s full operational capacity will be met only once in 7-10 years where the flood is very high due to climate change and other factors. These factors will also be very crucial in determining the economical loss and human loss avoided by the system in its operation after implementation. Though calls for a smaller version of the project with lower capacity will be put forward, it is important to note that the entire project is designed for the most probable worst case scenario, thereby keeping the cost lower.
Opportunities :
1. Improved social and environmental sustainability : Although the project is aimed towards effective control of flood, the by-products of the project / system are also worth mentioning. Through the system of implementation mentioned further down this book, social
32
sustainability can be achieved with little to no extra efforts of the project. The innovative kiosk stands near the tank will not only inform the public about the scope and operations of the project but will also inform the general public on how their money is being effectively used, thereby creating awareness for them in the areas of public welfare, sustainability and environment.
2. Improved social involvement : The process of involving the youth and the school children during the construction phase of the system will increase the social involvement of the region and will act as an initiative for the people. The usage of modern technologies suchas mobile phones for information systems by the public for their area / locality will also improve the involvement during the operation and maintenance phase. This not only increases the awareness of the people but will increase the accountability and the responsibilities of the local authority and the operating body, keeping them in check. This increases the transparency and efficiency of the system.
3. Flagship Initiative : The project being a new and innovative idea, based on phytodepuration and ground water regeneration will attract many cities to follow suit and implement this idea, with little modifications. The environmental friendliness and the cost effectiveness of this project will also act as attractive points to many cities which are on their way to become smart cities. This project and its system will not only be an innovative initiative but will also act as a flagship project to many such endeavors where basic concepts are used to tackle highly complicated global issues in a large scale.
4. Increased Employment : As mentioned further down the project in this book, the concept of community utilization is used. This means that the local community is actively involved in the development and the operation of the project / system, thereby increasing the employment rate of the locality. This coupled with the fact that Mumbai experiences high unemployment, especially for engineering graduates, will create an opportunity to involve and train them, which can not only be helpful for this project but also for their future employments.
Threats :
1. Bureaucratical Issues : The issue with the government structure changes from region to region within the same country, hence a fixed structure cannot be followed during the tender and contract process. This could potentially change the rate at which the project is implemented in various regions in the country, meaning an unstable and unpredictable initial stages in the entire project on various locations.
2. Changing Climate : The constant change in the climate, although forecastable, is always unpredictable, creating new changes and challenges to the entire concept of the project. For example, the increase in the greenhouse gases have caused an increase in the overall temperature around the planet, causing sudden changes in the climate . This might increase the rainfall or make the land arid and turn it into a desert in the future, making the project either inefficient or unnecessary.
3. Social Unawareness and disinterest : The social sustainability could not be easily achieved due to the vast difference in the educational background of the people of Mumbai. Considering the fact that Mumbai has a large slum population, the education and the awareness of the people might not be necessarily high and might require large efforts to crease an effective means of awareness.
33
4. Long Installation Process : The installation of the HDPE pipes in the matrix form will be a long and tedious process, and will be taking place in steps and stages along different parts of the city. This will cause disinterest among the local residents and there is always chances for delays when there is huge period of constructions. These factors all pose a threat to the entire project, which could be tackled and avoided to enable ease of construction and operation.
2.2 Mumbai City – Module
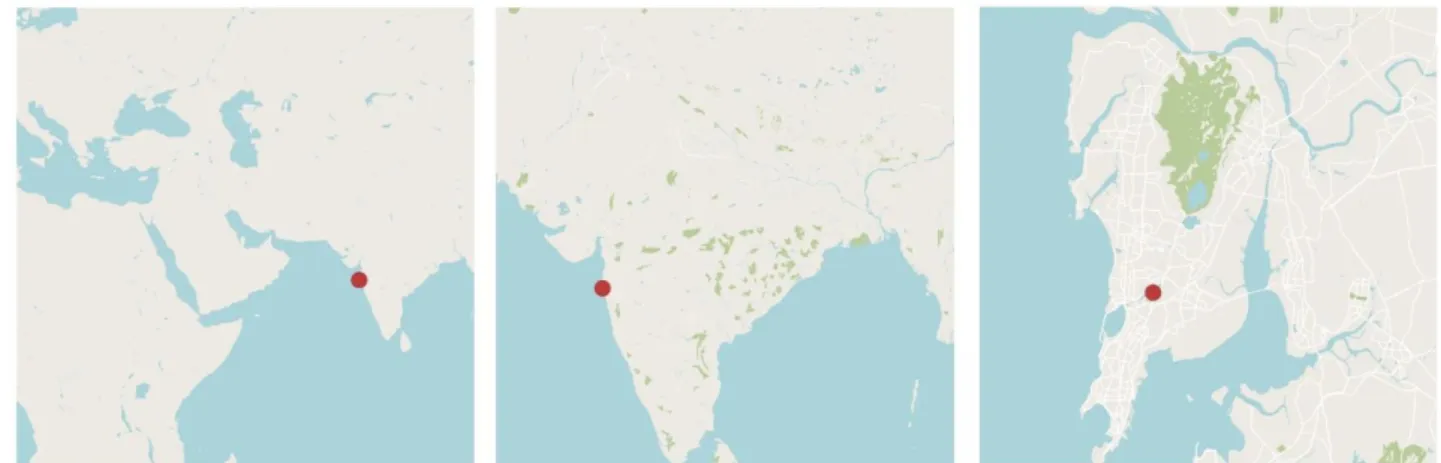
Figure 20 Location of the module
The city of Mumbai has been chosen as the site for developing our module. The city has been known to be prone to urban flooding year after year, which shows that the existing flood control measures are failing to a certain extent. This densely populated and most important metropolitan city of India shows ample potential for developing new techniques for flood control.
34
Since it is not possible to test this module in the entire city of Mumbai, an area of 4 sq.km which is centrally located has been identified. This area, located near the main airport in Mumbai, primarily consists of residential and commercial sectors. Thus, it would become easy and more valuable to implement water regeneration and re-use in such an area.
Another important aspect that led us to choose this site is that it is located near the Mithi river, which is one of the rivers that overflows and causes urban flooding during the monsoon.
Within this 4sq.km, a centrally located open ground have been identified as our core module site which would locate the main purification tank and water collection systems, with other recreational activities for the public. The piping systems laid across the 4sq.km region will converge at this module site.
36
The module will not only consist of technical elements like water collection and phytodepuration tanks. Efforts have been made to bring in public involvement for this project, not only at the construction phase but also in the usage phase.
The module will be proposed as a park in which all the pipes will converge. The decision to make this site completely public comes along with the fact that there only few places in Mumbai with extremely large public spaces for recreational use. This initiative will aim to combine the technical and social aspects. The social features of this park will attract more people and by actively displaying the technical facets of the flood control system, it will help in spreading knowledge and information about this project.
The phytodepuration tank will be camouflaged as a lake which will add to the aesthetics of this park. There will be various recreational facilities like jogging tracks, play grounds, play areas etc and a visitor centre which will provide all the information regarding this project and guide people around the park in general.
Figure 22 The phytodepuration tank of the module
The regeneration tank will act as an open museum which will display the purification process. The walls of this tank will be filled with interactive display boards, which will display information about this module and the amount of water purified and reused, the main aim of which will be to inspire the readers to get involved in this process.
37
Figure 23 The aeration tank and viewing deck
The visitor centre and the tank as an open museum will also be open for group tours like school going children. The interactive boards will make sure to keep giving them interesting and up to date information. Through these interactive display boards, the users will also be encouraged to leave suggestions and queries regarding this process.
Figure 24 Information display system
38
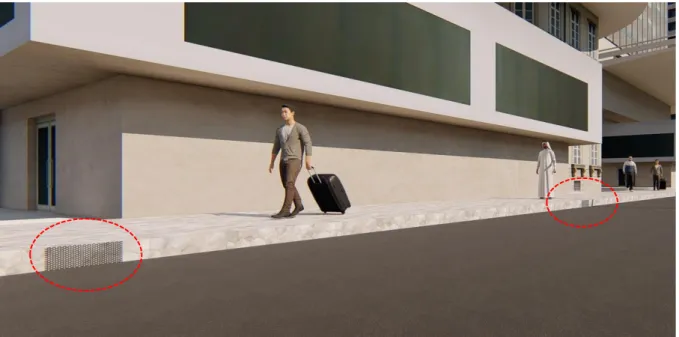
Another imminent problem that exists in Mumbai is of drainage leaks. If a drainage issue is found in a public space, it is extremely hard to get this fixed due to lack of maintenance. This project also offers a solution to the public in a very easy-to-use and efficient way. This is done with the help of QR codes. If anybody finds and drainage or leakage issue, all they need is a mobile app. There are QR code bollards installed at certain maintenance points. A person just needs to scan this code in order to send notification to the technicians about an issue at this point. These bollards can also be used as landmarks.
39
3 TECHNICAL DETAILS AND RAINFALL CALCULATION
3.1 Flood Module Working Network and Process
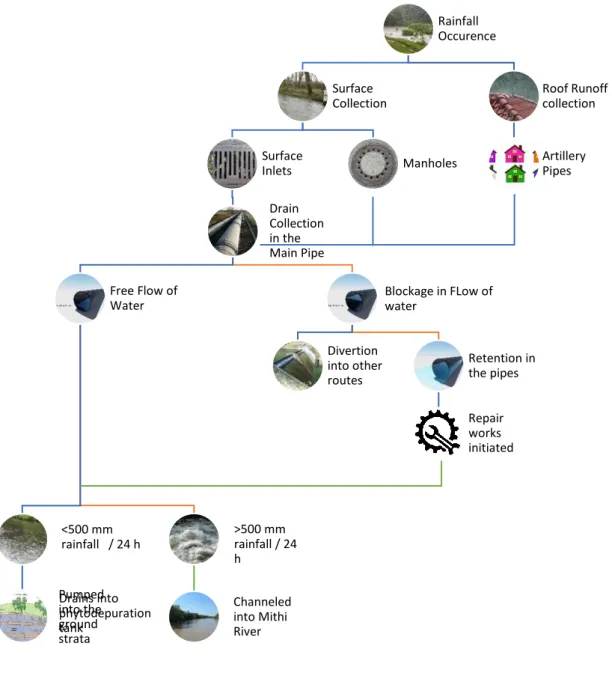
Figure 26. Flow of Process
Rainfall Occurence Surface Collection Surface Inlets Drain Collection in the Main Pipe Free Flow of Water <500 mm rainfall / 24 h Drains into phytodepuration tank Pumped into the ground strata >500 mm rainfall / 24 h Channeled into Mithi River Blockage in FLow of water Divertion into other routes Retention in the pipes Repair works initiated Manholes Roof Runoff collection Artillery Pipes Objectives –
• To explain the layout and the functions of the module, in both network schematics and in descriptive cum figurative process.
• To perform all necessary calculations for rainfall quantity, tank and pipeline design with development of a basic calculation tool.