UNIVERSITY OF PISA
Department of Chemistry and Industrial Chemistry
PhD Thesis in Chemical Science
XXIV cycle, 2009-2011
SSD: CHIM/01 – Analytical Chemistry
Chemical information from human fluids
for therapy monitoring and clinical
diagnosis
Silvia Ghimenti
Supervisors: Prof. Roger Fuoco
Dott. Fabio Di Francesco
I
Table of Contents
ABSTRACT ... 1
INTRODUCTION ... 3
CHAPTER 1 Non conventional human fluids
1.1 Oral fluid and sweat ... 51.1.1 Composition and physiology of oral fluid secretion ... 6
1.1.2 Composition and physiology of sweat secretion ... 10
1.1.3 Mechanism of drug transport into oral fluid and sweat ... 11
1.1.4 Oral fluid and sweat sampling techniques ... 16
1.1.5 Oral fluid and sweat analysis ... 17
1.2 Physiology of respiration ... 18
1.2.1 Breath sampling techniques ... 24
1.2.2 Analytical techniques used for chemical breath characterization ... 28
1.3 Renal physiology ... 33
1.3.1 Fundamentals of hemodialysis ... 35
1.3.2 Dialysis fluid characteristics ... 38
1.3.3 Uremic toxins ... 39
CHAPTER 2 Clinical applications
2.1 Warfarin and Oral Anticoagulant Theraphy ... 422.1.1 History of Warfarin ... 43
2.1.2 PhysicochemicalProperties of Warfarin ... 2.1.3 Clinical Use of Warfarin ... 48
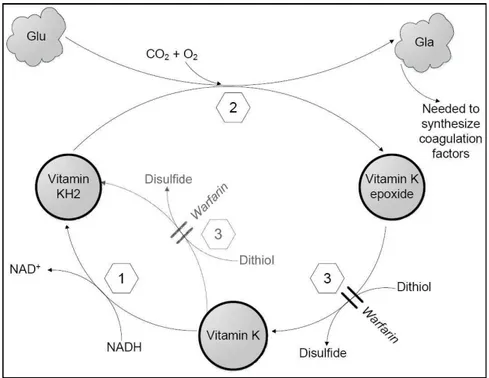
2.1.4 Pharmacodynamics of Warfarin ... 49
2.1.5 Pharmacokinetics of Warfarin ... 52
II
2.1.7 Factors influencing oral anticoagulant therapy ... 56
2.1.8 Approaches to counter challenges in OAT ... 60
2.2 Monitoring of volatile compounds in human breath ... 63
2.2.1 Diabetes mellitus ... 63
2.2.2 Volatile anaesthetic agents: sevoflurane ... 65
2.2.2.1 Physicochemical Properties of Sevoflurane . 65 2.2.2.2 Pharmacokinetic Properties of Sevoflurane . 67 2.3 Monitoring of uremic toxins in spent dialysate ... 69
2.3.1 Adequacy of hemodialysis ... 69
2.3.2 Monitoring of hemodialysis ... 71
CHAPTER 3 Materials and Methods
3.1 Chemical reagents ... 733.2 Preparation of standards ... 74
3.3 Instrumentation ... 77
3.4 Optimization of HPLC assay for warfarin determination ... 78
3.4.1 Absorption and fluorescence spectra of Warfarin ... 78
3.4.2 Selection of the mobile phase ... 80
3.4.3 Selection of the injection volume ... 81
3.4.4 Experimental conditions in method validation ... 82
3.5 Thermal desorption gas chromatography mass spectrometry (TD-GC-MS) assay for breath analysis ... 82
3.6 Optimization of HPLC assay for uremic toxins determination ... 85
CHAPTER 4 Experimental section
4.1 Samples collection and preparation ... 874.1.1 Oral fluid ... 87
4.1.1.1 Sample collection device ... 87
4.1.1.2 Sample storage ... 89
III
4.1.1.3.1 Extraction of warfarin from oral
fluid samples ... 91
4.1.1.3.2 Ultrafiltration of oral fluid samples ... 92
4.1.1.3.3 pH measurement of oral fluid samples ... 92
4.1.2 Sweat ... 93
4.1.3 Breath ... 94
4.1.4 Spent dialysate ... 97
4.2 Method validation for oral fluid samples analysis ... 97
4.2.1 Interferences ... 97
4.2.2 Matrix effect ... 100
4.2.3 Calibration curve ... 102
4.2.4 Limit of detection and quantitation ... 104
4.2.5 Precision and accuracy ... 104
4.2.6 Quality control of analytical data ... 105
4.2.7 Effect of pH on warfarin recovery ... 106
4.3 Method validation for breath samples analysis ... 108
4.3.1 Determination of the response factors for the quantification of compounds ... 108
4.3.2 Linearity of sevoflurane ... 110
4.3.3 Time stability of sevoflurane concentration in the Nalophan bag ... 112
4.4 Method validation for the analysis of spent dialysate samples ... 113
4.4.1 Calibration curves ... 113
CHAPTER 5 Clinical applications: results and
discussion
5.1 Monitoring of warfarin therapy ... 120IV
5.2 Monitoring of volatile compounds in human breath during oral
glucose tolerance test ... 131
5.3 Kinetic post-operative elimination of sevoflurane anaesthetic and hexafluoroisopropanol metabolite as measured in exhaled breath ... 137
5.4 Monitoring of uremic toxins in spent dialysate ... 151
Conclusions ... 164
References ... 166
Publications ... 192
Papers Presented at Scientific Meeting ... 193
1
ABSTRACT
In this study several analytical procedures have been developed and optimized to obtain chemical information of diagnostic or therapeutic relevance on non-traditional biological fluids, such as oral fluid, exhaled breath, and spent dialysate.
An analytical method to identify warfarin in oral fluid samples by HPLC with fluorimetric detection was developed in order to investigate the possibility of the minimal invasive monitoring of oral anticoagulant therapy. The method was used to highlight the presence of the drug in oral fluid with a concentration of 1 - 10 ng/mL. The results demonstrated the key role played by the salivary pH in regulating the drug transfer from the blood. In addition, a high correlation (r = 0.84, p = 0.004) between warfarin concentration in oral fluid and INR values was found for patients with an oral fluid pH ≥ 7.2.
An analytical methodology based on two-stage thermal desorption capillary gas chromatography and mass spectrometry was optimized for the analysis of exhaled breath samples. This procedure was applied to the non-invasive monitoring in breath samples of both volatile compounds during an oral glucose tolerance test and sevoflurane anaesthetic and its metabolite hexafluoroisopropanol (HFIP) after surgery. A three-compartment pharmacokinetic model was developed and fitted to the post-operative sevoflurane and HFIP breath data. Sevoflurane elimination kinetics after surgery were consistent in all subjects with a rapid wash-out of sevoflurane within 24 hours, whereas the production and elimination of HFIP were more varied.
2
Photometric and fluorimetric measurements of spent dialysate samples were proposed as possible tools to assess the removal of uremic toxins with the potential for non-invasive real time monitoring of the efficiency of hemodialysis treatment. Excellent correlations were obtained between UV absorption at λabs = 292 nm
and uric acid concentration in spent dialysate (r = 0.90), and between uric acid concentration in spent dialysate and in plasma (r = 0.92). Furthermore, it was demonstrated that uric acid provides the most important contribution to UV absorption at λabs = 292 nm
in spent dialysate (CUA % = 75 %). A linear model capable of
predicting concentration values of uric acid in blood from the UV absorption data at λabs = 292 nm was developed.
3
INTRODUCTION
Over the last few decades, alternative or non conventional matrices such as breath, oral fluid, sweat and other biological fluids have become more and more important in diagnostic medicine and therapeutic drug monitoring, as well as in toxicology, and occupational and environmental exposure. Analysis of these alternative fluids provides useful information due to the rapid diffusion equilibrium between the dissolved substances in the blood capillaries and these fluids through thin membranes. These membranes may be biological, such as the alveolar membrane (in the case of breath) and the glandular epithelial cell membrane (in the case of oral fluid and sweat), or artificial, such as those used in hemodialysis treatment.
In general these types of samples have the advantage that collection is almost non-invasive and easy to perform, thus minimally affecting the patient. Furthermore, they represent much simpler matrices from a chemical point of view, and the analysis can be carried out in a shorter time frame and be possibly used in outpatient scenarios. These fluids can also provide physiological information in real time, which is a useful and can be used alongside traditional methods. The main disadvantage of these kinds of samples is that compounds of interest are present at very low concentrations, and therefore high-sensitivity techniques are required to accomplish the analysis. Recent advances in analytical techniques have led to the detection of analytes at very low concentrations that were unthinkable a few years ago. Currently, mass spectrometry, combined with gas or liquid chromatography is the most widely used analytical tool because of its high sensitivity and specificity, and the ability to handle complex matrices.
4
The primary goal of this work is to present novel strategies for exploiting non-traditional biomarker media such as oral fluid and sweat, exhaled breath and hemodialysis fluid for clinical diagnostic applications.
Four specific projects are described to demonstrate the value of these biomarker fluids. They are: the monitoring of oral anticoagulant therapy in oral fluid, the measurement of diabetes biomarkers to assess glucose metabolism, the measurement of sevoflurane anesthetic and its primary metabolite hexafluoroisopropanol in exhaled breath in order to assess post-operative liver function, and monitoring the progression and effectiveness of hemodialysis.
5
CHAPTER 1
Non conventional human fluids
1.1 Oral fluid and sweat
Oral fluid in humans is a colourless mouth fluid possessing several functions involved in oral health and homeostasis, with an active protective role in maintaining oral healthiness [1, 2]. Oral fluid helps bolus formation by moistening food, protects the oral mucosa against mechanical damage and plays a role in the preliminary digestion of food through the presence of α-amylase and other enzymes. It also facilitates taste perception, allowing soluble food-derived molecules to reach the gustative papillae and buffer the acid components of food with the bicarbonates (originating from salivary gland carbonic anhydrase). Oral fluid also has a role in maintaining teeth enamel mineralization: several proteins (statherin, proline rich proteins – (PRPs) and mucins) allow Ca++
sovrasaturation in oral fluid to be maintained [3]. Oral fluid has defence functions against pathogen microorganisms, in the presence of defence proteins that react in specific (immunoglobulins) or non-specific (lysozyme, peroxydase, cystatins, lactoferrin, hystatins and others) ways, inhibiting microorganisms growth [4, 5].
Sweat is a clear, salty liquid produced by sweat glands in the skin. In humans, the main function of sweat is to help regulate body temperature by cooling the skin surface. This decrease in temperature is caused by the evaporation of water, main constituent of sweat at a rate of 0.6 calories per mL of sweat
6
evaporated [6]. The amount of sweat secreted from a person in a day depends on the needs of thermoregulation itself. Moisture may be lost from the skin by either insensible sweat (sweat not visible), likely caused by diffusion through the skin, and sensible sweat, which is actively excreted during stress and exercise.
1.1.1 Composition and physiology of oral fluid
secretion
Oral fluid is a complex mix of fluids excreted into the oral cavity mainly from three pairs of major salivary glands (parotid, sublingual and submandibular) and from a large number of minor salivary glands (Figure 1.1).
Figure 1.1 The anatomical positioning of the three pairs of large salivary glands; the glandula parotis (1), the glandula submandibularis (2) and the glandula sublingualis (3).
The parotid gland, located opposite the maxillary first molars at the top of the mouth, secretes oral fluid derived mainly from blood (serous fluid), whereas the sublingual glands, located at the sides of the mouth and the submandibular glands, located at the base of the tongue excrete both serous fluid and mucin. Minor salivary
7
glands are mainly Von Ebner glands (entirely serous organs situated in the connective tissue below the circumvallatae papillae) and Blandin-Nühm mucous glands [7].
Salivary composition varies in relation to the serous or mucous component of the glands [8]; the relative contribution of each type of gland to total unstimulated oral fluid secretion varies from 65 %, 23 %, 8 % to 4 % for submandibular, parotid, Von Ebner and sublingual glands respectively [9, 10].
Water is the greatest component of oral fluid, representing 99% of its composition, and other components such as inorganic electrolytes and organic molecules are also present [11].
The inorganic part is composed of weak and strong ions including Na+, K+, Ca2+, Mg2+, Cl−, HCO3−, HPO32− which can generate buffer
capacity.The organic part contains components such as body secretion products (urea, uric acid and creatinine), putrefaction products (putrescine, cadaverine; lipids such as cholesterol and fatty acids), and more than 400 types of protein. The most relevant proteins have a glandular origin (α-amylase, histatins, cystatins, lactoferrins, lysozymes, mucins, and proline-rich proteins (PRPs)) or are plasma derived (albumin, secretory immunoglobulin A (sIgA), transferrin). The mucin gives oral fluid its sticky character. The low protein concentration in oral fluid makes drug binding minimal compared to that observed in plasma.
Oral fluid components have also a non-glandular origin, so oral fluid cannot be considered as the only production of salivary glands, because it also contains fluids originating from oropharingeal mucosae (oral mucosal transudate cells, bacteria, fungi, virus, upper airways secretions, gastrointestinal reflux) [12, 13]. Oral fluid contains also crevicular fluid, an extracellular fluid derived from the epithelia of the gingival crevice. Crevicular fluid is produced at approximately 2–3 μL/h per tooth and it can be considered as a plasma transudate [14]. Oral fluid may also
8
contain food debris and blood-derived compounds (actively or passively transferred), such as plasmatic proteins, erythrocytes and leucocytes in case of oral inflammation or mucosal lesions [12].
According to Thaysen and his colleagues theory [15], oral fluid secretion occurs in two stages: in the first phase a primary oral fluid isotonic to blood is released by the acinus cells; in the second phase, as this initial fluid moves down the ductal system of the salivary gland, an energy-dependent transport process reabsorbs sodium and chloride resulting in a hypotonic fluid secretion, with a lower ion concentration compared to plasma. In salivary gland ducts mineralocorticoid receptors are present, so salivary glands are mineralocorticoid-responsive [16]: for this reason salivary K+
concentration is higher than the plasma concentration (22 vs 4 mmol/L) and Na+ concentration is lower in oral fluid compared
with that in plasma (5 vs 145 mmol/L) [12].
Several factors may modify the salivary ionic concentration, furthermore, the composition of unstimulated oral fluid is different from stimulated oral fluid, which is more similar in composition to plasma (Table 1.1).
Table 1.1 Comparison of inorganic compounds between oral fluid and plasma. Inorganic compounds Unstimulated oral fluid (mmol/L) Stimulated oral fluid (mmol/L) Plasma (mmol/L) Na+ 5 20 - 80 145 K+ 22 20 4 Cl- 15 30 - 100 120 Ca2+ 1 - 4 1 - 4 2.2 HCO3- 5 15 - 80 25 Mg2+ 0.2 0.2 1.2 NH3 6 3 0.05
9
For example, an increase in the salivary flow rate, obtained by stimulation with acidic food, increases the concentrations of sodium, chloride and bicarbonate and decreases the concentrations of salivary potassium and phosphate, compared with unstimulated oral fluid [17] (Figure 1.2).
Figure 1.2 Relation between the concentration of sodium, potassium, chloride and bicarbonate in the oral fluid and the rate of salivary flow.
Healthy adult subjects normally produce 500 – 1500 mL of oral fluid per day [11], with typical flows of 0.05 mL/min while sleeping, 0.5 mL/min while spitting, and 1 mL/min to 3 mL/min or more while chewing but several physiological and pathological conditions can modify oral fluid production quantitatively and qualitatively, e.g., smell and taste stimulation, chewing, psychological and hormonal status, drugs, age, hereditary influences, oral hygiene [12] and physical exercise [10, 18].
Unstimulated oral fluid pH is in the range of 5.6 – 7 and increases with stimulation (to more approximate the pH of blood, i.e. 7.4) to a maximum of 8.0 [11].
10
1.1.2 Composition and physiology of sweat secretion
Sweat is a clear, hypotonic solution produced by two types of glands: eccrine and apocrine located in epidermis [19]. The apocrine glands are larger than the eccrine glands and secrete a more viscous substance. The apocrine glands are primarily located in the axillae, pubic and mammary areas. Besides opening directly onto the skin, sweat glands also develop in close association with hair and sometimes open inside hair follicles; as such, sweat is thought to be a major contributor to drugs appearing in hair.
The sweat produced by eccrine glands is a liquid basically colorless and odourless, slightly salty, whose composition may vary according to different physiological conditions. It consists of a dilute (water (99%) is its main constituent) electrolyte solution containing high concentrations of sodium, chloride as well as low levels of potassium, bicarbonate, glucose, lactic and pyruvic acids and urea and ammonium. A substantial individual variability in the composition of sweat was found depending on the mode of stimulation and age.
The apocrine sweat, however, is secreted intermittently and appears as a viscous liquid, milky, acrid smell, rich in organic cellular material, proteins, glycogen and fatty acids. Its pH is alkaline due to the presence of ammonia. It is produced in much less than the eccrine sweat but, being more easily attacked by bacteria, the greater responsibility of the production of body odours is attributed to it.
Sweat acts physiologically by regulating body temperature, since its evaporation from the skin surface reduces the excess heat. Sweating is increased by nervousness, exercise, stress and nausea and decreased by cold. Sweat excretion is also affected by other factors, such as ambient temperature, relative humidity, body
11
location (in general, sweat glands are distributed over the entire body, except for the lips, nipples and external genital organs), hormonal imbalances, overactive thyroid gland and the sympathetic nervous system, and certain foods and medications. Between 300 and 700 mL/day of insensible sweat is produced over the whole body, whereas 2–4 L/h of sensible sweat may be produced by extensive exercise [11].
1.1.3 Mechanism of drug transport into oral fluid
and sweat
Nearly identical considerations are thought to apply to the excretion of drugs in sweat as apply to excretion of drugs in oral fluid.
A thin layer of epithelial cells separates the oral fluid ducts from the systemic circulation. The lipid membrane of these cells determines which molecules may be transferred from the plasma into the oral fluid [20]. The clearance of compounds from plasma into oral fluid may involve several processes [21]:
1) ultrafiltration through gap junctions between cells of secretory units (intercellular nexus). Only molecules with MW<1900 Da are involved (water, ions, hormones such as catecholamines and steroids) and their salivary concentration is 300–3000 times lower in oral fluid than in plasma.
2) transudation of plasma compounds into oral cavity, from crevicular fluid or directly from oral mucosa. The presence in the oral fluid of some typical plasmatic molecules, like albumin, depends on this mechanism.
12
3) selective transport through cellular membranes: by passive diffusion of lipophilic molecules (steroid hormones) or by active transport through protein channels.
Salivary substances that so far play the dominant role in clinical chemistry diffuse from the blood compartment into oral fluid. At least five factors are known which influence the diffusion of the drugs into oral fluid [22, 23]:
1. Molecular mass
The molecular weight appears to play a minor role, although the diffusion coefficient is inversely proportional to the molecular radius. As a general rule of thumb that smaller molecules diffuse more easily than larger ones.
2. Lipid solubility
The major determinant for free diffusibility is the solubility in water and/or lipids, especially in the phospholipid layer of cell membranes. Lipophilic substances more easily diffuse than lipophobic molecules. Abundant evidence has been published that the lipophilic character of organic compounds as operationally defined by oil/water or octanol/water partition coefficients play an important role on drug action at all levels of organization (enzyme, membrane and cell) [24, 25, 26].
3. Degree of ionization
The degree of ionization plays an important role because of the partition theory, which states that only the unionized fraction is able to pass the lipoid barrier between the three compartments: plasma, intracellular space and salivary fluid.
13
Because the pH value differs between the extra- and intracellular space, the total concentration as the sum of the ionized and unionized fraction varies on both sides. For neutral or weakly acidic drugs with a pKa greater than 8.5
and weakly basic drugs with a pKa less than 5.5, the
variability of oral fluid pH has little effect on the oral fluid/plasma ratio. For acidic, largely ionized drugs the oral fluid/plasma ratio increases with rising pH-value, while for basic drugs the reverse situation occurs. In man, oral fluid is usually more acidic than plasma. Therefore, the oral fluid/plasma ratio is equal to or less than unity for all acidic drugs and equal to or greater than unity for all basic drugs. If the drug is protein-bound, this statement is only true for the free fraction.
The theoretical oral fluid/plasma ratio can be estimated from the equation of Rasmussen (Eq. (1.5 – 1.6)) derived from the Henderson–Hasselbalch equation (Eq. (1.1)) and the equation for mass balance (Eq. (1.2)), as demonstrated by many examples [27, 28, 29].
log
(1.1)(1.2) where [HA] is the concentration of the non-ionized form of the acidic drug, [A-] is the concentration of the anionic form,
and [A] is the total concentration of drug in both forms.
Solving both equations for the total amount of drug in either form gives:
14
Because Eq. (1.3) applies to both oral fluid and plasma, the oral fluid/plasma ratio may be calculated by:
(1.4)
A modification must be made to Eq. (1.4) to take into account the binding of drugs to plasma and oral fluid proteins because only the free neutral drug can cross the cellular membranes. Because of protein binding, the concentration of drugs in plasma (which drives the diffusion process) is reduced. Assuming that the [HA] must be the same in both oral fluid and plasma, because of equilibrium (HA is the species thought to be responsible for transport across the cellular membranes), Eq. (1.4) may be reduced to the standard equation, Eq. (1.5). A similar equation (Eq. (1.6)) can be derived for basic drugs if it is remembered that the un-ionized form of the drug is responsible for the transport across the oral fluid–plasma membrane:
·
(1.5)·
(1.6)where fp is the free (unbound) fraction of drug in plasma and
fof is the free (unbound) fraction of drug in oral fluid.
The fraction of free drug (not bound to proteins) in oral fluid is assumed to be one, because of the much lower concentrations of protein in oral fluid compared to plasma.
15
Eqs. (1.5) and (1.6) predict that the concentrations of drugs in oral fluid will vary with the free fraction of drug in plasma rather than with the total level of drug [30].
Since it is only the free form of the drug in plasma that is available to produce a pharmacological effect, oral fluid concentrations may be of greater therapeutic value than plasma levels.
4. Salivary pH
On the basis of the above-mentioned partition theory, the salivary pH value influences the secretion of ionized drugs. The pH-value depends on the flow rate. Stimulation leads to an increase of bicarbonate secretion with a concomitant rise of the pH-value from 5.8 to 7.8 [11]. Therefore, basic drugs are concentrated in oral fluid under resting conditions when the salivary pH is below that in blood. On the other hand, under maximal stimulation, basic drugs become concentrated on the intracellular side of the membrane.
The salivary pH-value depends on psychological factors; it decreases, e. g., under anxiety situations [31].
5. Protein binding
The fraction of a drug bound to protein cannot pass the cell membrane. Therefore, the salivary drug concentration directly reflects the free plasma fraction of a unionized drug. Other factors that can influence the oral fluid/plasma ratio are the salivary flow rate, the phenomenon of fluctuating arterial-venous differences, the elimination kinetics, and the concentration-dependent protein binding.
16
1.1.4 Oral fluid and sweat sampling techniques
Oral fluid can be collected under unstimulated (resting) or stimulated conditions [32]. Salivary flow can be stimulated by a variety of agents: gustatory and masticatory stimuli have been used most frequently to increase salivary flow rate. The most commonly used stimulants are paraffin wax, Parafilm, rubber bands, gum base, and citric acid.
Common methods of oral fluid collection are spitting, draining, suction and collection on various types of absorbent swabs [33]. A variety of commercial collection devices that promote easy, quick and reproducible collection as well as a cleaner specimen which is more suitable for analysis are available [33, 34, 35, 36]. In general, these devices consist of an absorbent material that becomes saturated in the mouth of the donor, and after removal the oral fluid is recovered by centrifugation or by applying pressure to the material.
Examples of commercially available devices include Omni-SAL® (Cozart Biosciences Ltd, UK), Salivette® (Sarstedt, Germany), Drugwipe® (Securetec, Germany), Quantisal™ (Immunalysis Corp., USA), Intercept® (OraSure Technologies, USA), Saliva-Collection-System® (Greiner-BioOne, USA), ORALscreen™ and Finger Collector® (Avitar Technologies, Inc., USA).
Many sweat collection techniques such as wiping, blotting, occlusive patches, iontophoresis with pilocarpine stimulated secretions, and the use of capillary tubes have been developed.
Initially, sweat collection devices consisted of an occlusive bandage formed by one to three layers of filter paper or pieces of cotton, gauze or towel [37]. Heat or chemicals (e.g. pilocarpine) were used to increase sweat production.
17
However, this kind of patch was time-consuming to apply, uncomfortably large, prone to detachment and yielded a small volume of sweat for analysis.
To overcome these difficulties, non-occlusive sweat collection devices have been developed to wear for extended periods of time, consisting of an adhesive layer on a thin transparent film of surgical dressing to which a rectangular absorbent pad is attached. The non-occlusive, semipermeable membrane allows oxygen, carbon dioxide, and water vapor to escape. The adsorbent pad retains the nonvolatile components of sweat, such as salts, proteins, and drugs and metabolites. This device is being marketed as the PharmChek sweat patch [38]. A potential problem with the PharmChek patch is the absence of a layer between the skin and the absorptive pad, to prevent bacterial transfer into the pad and, therefore, the possibility of bacterial growth and drug degradation. Careful preparation of the skin prior to application of the patch should kill or remove bacteria and prevent these problems.
1.1.5 Oral fluid and sweat analysis
Oral fluid and sweat are used mainly in the field of toxicology for the detection of drug of abuse using immunochemical and chromatographic methods [39, 40, 41].
Immunochemical tests, mainly EIA (Enzyme Immuno Assay), are used for qualitative analysis of screening to verify the presence or absence of substances in the body but not the amount taken or still in circulation at the time of the investigation. Such tests require small amounts of sample without pre-treatment and have a good specificity.
The screening tests should be subject to confirmation using a method that provides structural information on the substances
18
under consideration. In this regard, analytical techniques such as mass spectrometry coupled with gas or liquid chromatographic separation (GC-MS or LC-MS) are used.
The quantitative determination by these instrumental techniques requires, unlike immunochemical tests, a stage of sample pre-treatment. Oral fluid and sweat specimens can be treated in a similar manner to other biological fluids, by deproteinization, ultracentrifugation, using liquid-liquid extraction (LLE) [42, 43, 44], phase extraction (SPE) [45, 46, 47, 48, 49, 50] and solid-phase microextraction (SPME) [51, 52] techniques.
However, because of the simplicity of the matrix, in some cases the samples can be analyzed directly by liquid chromatography without preparation or following a simple filtration.
In the recent literature there are many works in which some drugs and drugs of abuse (chlorpropamide, propanolol, phenytoin, cocaine, amphetamines, cannabinoids and methdone), are determined by the analysis of oral fluid or sweat.
1.2 Physiology
of
respiration
The physiologic purpose of respiration is to carry oxygen from ambient air to mitochondria within the cells of peripheral tissues, where it is consumed for the oxidation of carbon-containing compounds (internal respiration), and to transport carbon dioxide away from the cells and the body. The most important mechanism for this to happen is diffusion, which is driven by a concentration gradient. However, a purely diffusive system can only establish a relatively small pressure gradient across the gas exchange barrier of the organism. This is acceptable for small organisms (diameter < 1 mm), however, convection is also needed for larger creatures in order to guarantee the high oxygen flow rate needed for their
19
metabolism. In mammals, an air pump consisting of the lungs, the airways and the respiratory muscles guarantees that respiratory gases are continuously renewed on one side of the alveolar membranes, while the heart and the circulatory system accomplish the same task on the other side. In this way, a very efficient gas exchange system is obtained: diffusion is optimized by having the maximum possible gradient across the alveolar capillary membranes and across the surface of mitochondria, while a minimum oxygen pressure difference exists between blood just come out of the lungs and blood reaching the peripheral tissues. The availability of a large surface across which gas exchange takes place further contributes to the high efficiency of the system. In humans, lung surface is so large and so thin that oxygen and carbon dioxide transport across the alveolar walls is three-fold faster than needed when cardiac output is normal [53]. In most cases, the gas-liquid equilibrium between alveolar air and blood can be considered almost instantaneous, and the ratio of concentrations in pulmonary blood and alveolar air is close to the in vitro blood/air partition coefficient. Even so, the O2-carrying
capacity of the blood would be largely insufficient to meet the demand of the systemic tissues if the body had to rely just on dissolved oxygen, without a remarkable increase of cardiac output. To increase the carrying capacity of the blood, the large majority of the oxygen and carbon dioxide is transported bound to proteins or in other chemical forms.
The respiratory system can be divided into two sections (Figure 1.3): a section, named dead space, which mainly acts as a conducting airway (nose, pharynx, larynx, trachea and other airways without alveoli), and a section whose main function is gas exchange (alveoli and alveolar sacs).
Upon in that are walls ar single la capillarie close pro and, hen The bloo right ven Thus it dioxide ( halation, the basic e extreme ayers of ep es that c oximity of nce, a gas od supply ntricle of is poor in (produced F Figure gas exch c function ely thin ( pithelial c consist of f these tw s exchang ying the f the hear n oxygen d from cel igure 1.4 1.3 Respir hange occu nal compo (approx. 0 cells in cl f single l wo cell typ e. alveoli is rt and th (used fro ls) (Figure Gas excha ratory syst urs in th onent of t 0.2 μm). ose proxi layers of pes allows pumped hen flows m the cel e 1.4). ange in the tem. e alveoli, the lungs These wa mity to th endothel s permeab to the lu into the lls) and r alveoli. the tiny . The alve alls consis he pulmo ial cells. bility to g ung from e entire b rich in car 20 sacs eolar st of nary The gases m the body. rbon
21
The chemical process of gas exchange is diffusion: a substance always diffuses from A to B if the concentration or pressure is higher in A rather in B. Thus in the alveoli the oxygen pressure (100-110 mmHg) is lower than in the inspired air and higher than in blood capillaries (40 mmHg). Carbon dioxide pressure in the alveoli, on the other hand, is lower (40 mmHg) than in capillary blood (46 mmHg) and the CO2 moves in the opposite direction of
the O2. For the CO2 the difference in pressure is small, but it is
enough to eliminate the carbon dioxide produced by the organism as a result a good diffusivity of this gas. It is also important to consider that gas exchanges are also regulated by gas solubility in the liquid solution [54].
A typical respiratory cycle involves, in a time span of about 5 seconds, the exchange of half a liter of air in the lungs (tidal volume), so that the total ventilation, i.e. the volume of air moved in and out of the lungs per unit of time, is about 6 L/min. Not all the air we breathe is useful for the renewal of respiratory gases. The typical ventilation volume per respiratory cycle of the sections is 150 mL and 350 mL, respectively. Before inspiration, dead space is filled with end-tidal air remaining from the previous respiratory cycle. End-tidal air is the last fraction of expired air, whose composition resembles alveolar air. During inspiration, half a litre of fresh ambient air is then inhaled into the body, but only the first 350 mL reach the alveoli together with 150 mL of end-tidal air contained in the dead space, where they are diluted and mixed with alveolar air. During expiration, 150 mL of fresh ambient air, which filled the dead space, and 350 mL of air coming from the alveolar region are exhaled through the nose and/or mouth in sequence. By analyzing a respiration cycle, it can be noted that dead space is alternately filled with ambient and end-tidal air, and that only 350 mL of ambient air actually ventilates the lungs. Since
22
the volume of air contained in the lungs during normal breathing is approximately 3 L, it follows that the composition of alveolar air is pretty stable during respiration (the cyclic variations of oxygen and carbon dioxide are about 2% and 5%, respectively).
During expiration the breath composition changes in order to empty the airways and the lungs. Such a process can be monitored by tracking the CO2 content in breath, Figure 1.5 [55].
Figure 1.5 CO2 breath profile during a single respiratory cycle.
Three phases can be identified: during Phase I the air in dead space is eliminated and the composition of this fraction is low in CO2, being similar to inspired air; during Phase II, when mixed
dead volume and alveolar air are emitted, the partial pressure of CO2 quickly increases until a maximum value (35 mmHg) is
reached and then during Phase III a plateau level that asymptotically approaches the alveolar concentration is reached; only in Phase III is the alveolar air eliminated, containing the volatile compounds released from blood.
Ambient air is the main source of xenobiotic contaminants and oxygen. Its content of oxygen and carbon dioxide is fairly constant, while the concentrations of xenobiotics may be highly variable.
23
Dead space air has a composition close to ambient air (but a higher water content). Differences may arise due to the chemicals originating and/or released in the conducting airways or to gas exchanges with the mucus layer (mainly for water soluble compounds).
The composition of alveolar air is due to the interaction of ambient air with blood through the alveolar membrane. There are considerable non-homogeneities in the composition of alveolar air in different lung regions even in healthy subjects, since posture and gravity alter both local ventilation (exchange of the air in the lungs) and perfusion (blood circulation). Pulmonary ventilation and perfusion are mainly regulated by respiratory and cardiac frequency [55, 56].
When the composition of ambient air changes, the time needed for each breath fraction to reach a new equilibrium ranges from a few seconds for dead space air to minutes or hours for alveolar air. In fact, after exogenous compounds have reached pulmonary alveoli dissolved in blood on the basis of their blood/air partition coefficients, the compounds are then transferred through the body and released in the different tissues depend on the chemical affinity. The concentration of each compound in alveolar air is the result of a dynamic equilibrium that involves several compartments, each with its specific time constant.
In most cases, blood is the main source of markers and for this reason alveolar air should be considered the most representative of an individual’s condition. If markers are released from conducting airways, dead space air should be sampled.
24
1.2.1 Breath sampling techniques
The inter- and intra-individual variability of physiology, the presence of circadian rhythms in the production and emission of some compounds, and the existence of confounding factors due to food consumption or ambient air make the collection of representative samples particularly difficult in many cases. There are no general rules to follow and this lack of standardization in the sampling procedures has been proposed as a possible explanation for the contradictory results obtained by different authors along with the intrinsic difficulties of accurate and precise quantitative analysis of gas sample [57].
Exhaled air can be sampled in two ways, i.e., by mixed expiratory sampling and end-tidal sampling, respectively. Mixed expiratory sampling entails collecting total breath, including the air contained in the upper airways (dead space) which experiences no gas exchange with blood. End-tidal sampling involves the collection of only end-tidal air, which contains most of the chemical information on blood composition. Separate sampling during expiration of dead volume air and end-tidal air may be advantageous in breath research in terms of providing an insight into the origin of chemicals identified in breath samples. The presence of exogenous compounds in breath is one of the main sources of noise affecting breath analysis; how to discriminate between compounds with endogenous (i.e., produced inside the body by the physiological or pathological metabolism) or exogenous origin is an age-old question. The debate on the best solution to this problem still divides the scientific community. Some authors propose that each compound should be weighed on the basis of its concentration gradient between breath and ambient air [58], while others suggest that compounds whose concentration in ambient air is comparable
25
with or higher than that in breath should not be taken into account in the characterization of subjects [59] and finally there are those who provide the subjects with purified air in order to circumvent the problem [60, 61].
Several types of breath sampling devices have been reported in the literature or are commercially available. Most are simple combinations of valves and tubing which the study subject uses to fill a sampling bag or a syringe [62, 63, 64], or a pre-evacuated stainless steel canister [65, 66 67]. In all these cases, the subject is breathing ambient air, thus the mixed expiratory sampling is accomplished.
In the latter case, the subjects themselves control the sampling by opening a manual valve through which their breath is sucked into the canister. The canisters afford optimum stability of the sample and absorption on the canister walls for specific class of compounds can be minimized by a suitable treatment of the surfaces. Nevertheless, they are relatively heavy and bulky if a large number of samples have to be collected. Due to cost, they are not disposable and so an effective cleaning procedure is needed [68, 69, 70]. The use of plastic bags has been investigated by many authors as a possible alternative [71, 72, 73]. The stability of samples can be affected by the absorption on, or permeation through the bag walls, the possible contamination due to the release of bag materials, and the cleaning procedures in the case of multiple use. Tedlar and Nalophan bags are largely used thanks to low cost and handiness.
Other authors have suggested more complex devices to deliver purified air to their subjects [74, 75]. Two passive devices are commercially available that allow the sampling of end-tidal air. The first sampler, QuinTron, is produced by Campro Scientific GmbH (Germany) and consists of a tee-shaped connector housing two one-way valves in its two outlets. The core of each valve is a thin
26
silicon disc that seals the outlet until threshold pressure is exerted. The two valves are regulated to open at different pressures; a 250 mL bag is connected to the valve opening at the lower pressure, while a 750 mL bag is connected to the other valve. A mouthpiece is fitted to the inlet of the tee-shaped connector. When the subject blows air into the device, the pressure rises in the connector until the first valve opens and the corresponding bag is filled with dead space air. The pressure then starts increasing again until the second valve opens, allowing the remaining breath to be released into the other bag. Another sampler, BioVOC™, is produced by Markes International (UK). The subject is asked to blow through a mouthpiece into a cylinder with an open end. Only the last portion of end-tidal air (150 mL) remains in the cylinder after expiration. The mouthpiece is then replaced with a piston used to push the sample through an absorbing tube which has been connected to the previously open end of the cylinder. Although these systems do not provide the optimum solution, they are attractive for their simplicity and low cost. Their main limitations are the poor control of the sampling conditions and the limited volume that can be sampled in a single breath. A more sophisticated Breath Collecting Apparatus (BCA) was developed by Phillips and produced by Menssana Research [58]. In this system, the subject breathes through a mouthpiece assembly consisting of an inlet valve for the inspiration of ambient air and an outlet valve connected to an open-ended stainless steel cylindrical reservoir, which is thermostated at 40 °C to avoid the condensation of water. The sampling port, located at the end of the reservoir near the mouthpiece, is connected in sequence to an absorption tube, a flow meter and a computer-controlled pump. The end-tidal air sampling is accomplished by activating the pump at appropriate times after expiration, since no measurements of expiratory gas concentration and flow are taken. The total volume sampled in the absorbing
27
tube during multiple breaths can be selected by the user. A CO2
-controlled breath sampling device was proposed by Schubert et al for mechanically ventilated patients [76]. A fast responding infrared absorption mainstream CO2 analyzer supplies data to an electronic
processing unit, which actuates a two-way valve diverting breath flow to an absorbing trap when the percentage volume of carbon dioxide exceeds the set-up point.
Alternatively, the breath sample can be collected into a bag and then pre-concentrated off-line into an absorption tube [77]. The system enabled the sampling of large volumes on multiple breaths and the separation of breath fractions by real time monitoring of CO2 concentration.
Loccioni humancare with Professor T. Risby had developed novel sampling devices:
1) Single Breath Sampler developed to characterize a single breathing act. Mouth pressure and carbon dioxide concentration in real time are displayed and allow the breathing subject to apply a biofeedback technique on pressure and stabilize the expiration flow to a standard value making sampling repeatable and reliable. It is designed for connection with real time monitors (mass spectrometry, tunable diode laser analysers, photo-acoustic laser spectrometers, etc.) allowing to capture the signal from an external sensor for easy and fast data collection.
2) Multiple Breath Sampler developed to allow the subject breathing in a regular way and sample multiple breathing acts. Parameters can be set and changed to select the portion of interest in breath, according to the study performed. Breath can be then sample in desorption tubes or bags and analyzed with standard methods. It is designed for off-line gas analysis (gas cromatography, mass spectrometry, etc.).
28
1.2.2 Analytical techniques used for chemical breath
characterization
Several techniques have been applied to breath analysis that can be differentiated with respect to detection power, types of analyte to which they can be applied, capability of providing unambiguous identification, or possibility of providing real-time data [78, 79]. The high separation efficiency of capillary gas chromatography (GC) and the high identification capability of mass spectrometry (MS) make GC-MS the most common method used to measure low concentrations of more than one thousand VOCs present in human breath [80, 81].
Due to the extremely low level of most substances in exhaled breath, a pre-concentration step is required in most cases to enhance detection power. Generally, there are three approaches to achieve pre-concentration, namely, the chemical, cryogenic, and adsorptive approach [82, 83, 84, 85].
The adsorptive trapping is currently the most convenient and widely used method. It retains volatile compounds by binding them to specific sorbents. There are two types of pre-concentration techniques that use solid phase adsorption, i.e., Solid Phase Micro-Extraction (SPME) and Solid Phase Micro-Extraction (SPE).
The SPME technique, developed by Pawliszyn in 1989, combines in one step analyte collection and extraction [86]. The SPME [87] does not use any solvent and may be easily coupled with the most diffused chromatographic techniques. This method utilizes a fused silica fiber (typical diameter, 50-200 µm) coated with a thin layer of stationary phase (typical thickness 10-100 µm) mounted in a holder. During extraction, the fibre is exposed to the sample for a pre-established time during which the analytes reach the distribution equilibrium between the sample and the fiber coating.
29
The extraction efficiency depends on the value of the analyte partition coefficient and the mass ratio between the sample and the stationary phase. Afterwards, the fiber is withdrawn in the holder which in turn is inserted, for a pre-established time, in a modified split/splitless injector of the GC with a small diameter liner (0.75 mm ID) heated at a suitable temperature so that the analytes are thermally desorbed and transferred into the column by the carrier gas [88]. The optimum time and temperature of desorption and the carrier gas flow influence recovery have to be found experimentally. Several types of coatings with different thicknesses and polarities are commercially available and have an affinity with different classes of compounds [89, 90]. This extraction technique does not require any particular pre-treatment and is fast and easy use. The main disadvantages of this technique are the low pre-concentration factor, due to the limited capacity, and the difficulty in performing quantitative analysis, especially at trace level, due to the competition for absorption sites among minor constituents and more abundant compounds [91, 92].
In the SPE technique, a known volume of the sample passes through a desorption tube, packed with a suitable stationary phase, and the analytes are then retained on the basis of their chemical-physical properties. Analytes are released from the sorbent by applying a sharp temperature increase (Thermal Desorption (TD)) and transferred to the chromatographic column using a flow of an inert gas. Broadening of the chromatographic signal may happen and can be reduced by a two stage desorption system. In fact, the analytes desorbed from the tube are focused in a cryogenic capillary trap, which has a reduced internal volume. The trap is then rapidly heated. In this case the desorption process is faster and the transfer to the chromatographic column is performed with a smaller volume of carrier gas.
30
In order to have better analyte recovery and more reproducible results the packing material, desorption temperatures, timing, and gas flows need to be optimized both for the desorption tube and the focusing trap [93]. Sorbents should have high value of Breakthrough Volume (BTV), low affinity for water, and high thermal stability [92]. Carbon-based materials such as Carbon Molecular Sieves (CMS) and Carbon Blacks (CB) are frequently used, although they present some drawbacks [94]. Graphitized Carbon Black (GCB) is a very hydrophobic adsorbent with excellent thermal stability, low affinity to water, and high affinity to very volatile compounds [95]. Therefore, GCB could be used for the sampling of VOCs in exhaled breath, which has a high humidity content, without additional treatment.
Many of the porous organic polymers derive from the stationary phase used in a packed GC column. Tenax is one of the most frequently used trapping materials. This polymer is hydrophobic and does not retain water. Due to its low surface area (30 m2/g),
very volatile compounds are not trapped. The co-precipitated GCB with Tenax was introduced on the market as a Tenax GR which combines advantages of both materials [96]. If the sample contains compounds with different chemical-physical properties, the use of a multi-bed tube should be preferred.
Information on breath composition can also be obtained from direct breath measurements performed by different mass spectrometric techniques: Selected Ion Flow Tube Mass Spectrometry (SIFT-MS) or Proton Transfer Reaction Mass Spectrometry (PTR-MS). These techniques enable to eliminate the collection and pre-concentration phases and give real time responses.
SIFT-MS is a technique originally developed for the determination of rate coefficients for gas phase reactions. Recently SIFT has been
31
applied to the detection of trace gases in air and breath [97, 98, 99].
In short, the analysis occurs through a process of chemical ionization in a reaction tube (or flow tube). To analyze VOCs, a sample is introduced into the flow tube at a precisely controlled rate. Inside the flow tube, precursor ions, usually H3O+, NO+, or
O2+, react with VOCs present in the sample. This reaction results
in the formation of product ions, which are analyzed by a quadrupole mass spectrometer to identify and quantify VOCs.
SIFT-MS has been used for the monitoring of ammonia, acetone, isoprene, and ethanol in breath of healthy volunteers [100, 101], for the investigation of ethanol metabolism [102], the control of ovulatory cycle [103], the analysis of smokers’ and passive smokers’ breath [104], the assessment of exposure to volatile solvents [105], and the detection of bacterial infections, renal failure and diabetes [99].
PTR-MS is a relatively new technique allowing the quantification of gaseous VOCs at low concentration in real time [106]. This technique is different from SIFT due to some expedients adopted to increase detection power. The system works with an empty cathode ion source, which produces a high density of primary ions travelling across the tube without a pre-selector. The sample is introduced inside the tube without a carrier gas, thus avoiding dilution and increasing detection power by two orders of magnitude compared to SIFT [107].
In brief, chemical ionization is applied based on proton-transfer reactions, with H3O+ as the primary reactant ion, which is most
suitable when air samples containing a wide variety of trace volatile organic compounds are to be analyzed. Almost all VOCs have proton affinities larger than H2O, and therefore proton transfer
32
ionized VOCs by proton transfer from H3O+ are analyzed in mass
types rather than concentration.
PTR-MS has been used for exhaled breath profiling [108] and real time monitoring of anaesthetic agents [109] and to study effects of hemodialysis [110] or smoking [111].
In recent years Ion Mobility Spectrometry (IMS) has developed in comparatively small and effective devices to determine trace quantities of VOCs down to the low ppbv range in air [112, 113, 114]. The fundamental principle of operation is to separate ions according to their gas phase mobility as they travel through a purified gas in an electric field at atmospheric pressure.
The major advantage of IMS is that no vacuum systems are required and the ambient air can be used as carrier gas. IMS is often coupled with a GC system because of the intrinsic limited detection power, especially in the case of the detection of complex mixtures [115]. IMS has been used to identify some metabolites [116] as well as bacteria in human breath [112] coupled with multi-dimension capillary GC.
Recent advances in laser spectroscopic techniques make it possible for breath analysis to be performed on-line without the need to collect breath in containers or traps, thus allowing information about concentration during different phases of exhalation to be obtained. Laser-assisted analytical measurements are specific, fast, and characterized by a great detection power, and trace gas at the picomolar level can be determined with sub-sec resolution [117, 118, 119]. The major laser spectroscopic techniques, which are characterized by their high sensitivities and are currently being applied at breath analysis for detection of CO, CO2, NH3, NO, C2H6,
C2H4 and COS, include tunable diode laser absorption
33
cavity leak-out absorption spectroscopy (CALOS), photo-acoustic spectroscopy (PAS) [120, 121, 122, 123].
Breath analysis is also conducted by using electrical sensors, which are comparatively inexpensive and smaller in size, but they have low detection selectivity and require frequent calibrations [124, 125, 126].
1.3 Renal
physiology
The urinary system consists of two kidneys that filter blood and deliver the produced urine into the two ureters. From the ureters the urine is passed to the urinary bladder, which is drained via the urethra during urination. The kidneys are bean-shaped organs of about 11 cm long, 4 to 5 cm wide and 2 to 3 cm thick, and lie bilaterally in the retroperitoneum in the abdominal cavity.
Figure 1.6 Internal anatomy of the kidneys.
The smallest functional unit of the kidney is the uriniferous tubule, each containing a nephron and a collecting tubule. There are approximately 1 to 1.3 million nephrons in each kidney. One nephron is composed of a vascular part (glomerulus), a drainage part (Bowman's capsule), a proximal tubule, Henle’s loop and a distal tubule (Figure 1.6). Several nephrons are drained by one
34
collecting tubule, which enlarges downstream until it becomes a duct of Bellini and perforates the renal papilla.
The major function of the kidneys is removing toxic by-products of the metabolism and other molecules smaller than 69000 Da (i.e. smaller than albumin) by filtration of the blood flowing through the glomerulus. They also regulate body fluid composition and volume. Specifically resorption of salts (Na+, K+, Cl-), glucose, creatine,
proteins, and water takes place in the tubular parts. Because of these eliminating and conserving functions, the kidneys also contribute to the regulation of the blood pressure, hemodynamics, and the acid-base balance of the body. Additionally, kidneys have an endocrine function: they produce the hormone renin, erythropoietin and prostaglandines (derivatives of essential fatty acids to maintain homeostasis) and help in converting vitamin D to dihydroxycholecalciferol, a substance which controls calcium transport [53].
Renal insufficiency is a condition in which the kidneys lose their ability to purify the blood leading to the accumulation of toxins and waste products. According to the duration in which this occurs renal insufficiency can be divided into two main categories: acute (days to months) and chronic (years) renal failure.
As renal failure progresses, glomerular filtration rate as well as the amount of nephrons decreases. The main causes of end stage renal disease are diabetes and hypertension.
Dialysis is an artificial modality of renal replacement therapy used to manage renal insufficiency. It removes excess liquids and uremic toxins, assures the fluid balance and acid-base equilibrium, but partially replaces kidney functions: it can only replace a part of the excretory function, whereas the endocrine and metabolic function of the kidney cannot be restored.
35
The invention of dialysis dates back to the 19th century, when
Thomas Graham discovered a method for separating gases by diffusion [127]. However, hemodialysis was not widely available till 1960, when the first patient was treated for chronic renal failure by intermittent hemodialysis.
1.3.1 Fundamentals of hemodialysis
Insufficient kidney function can lead to the accumulation of excess electrolytes, waste products and fluid. The concentrations of these compounds can reach toxic levels and need to be removed from the blood stream. Hemodialysis is a blood purifying therapy in which the blood of a patient is circulated through an artificial kidney, also called hemodialyzer. This is realized in an extracorporeal circuit (Figure 1.7) where one or two needles (or catheters) can be used as the patient’s vascular access. A general hemodialysis therapy lasts about 9-15 hours a week, mostly spread over three sessions.
Figure 1.7 The extracorporeal circuit in hemodialysis.
Two types of hemodialyzers are in use: plate and hollow fiber dialyzers [128]. In a plate dialyzer, membrane sheets are packed together and blood and dialysate flow in subsequent layers. The
36
hollow fiber dialyzer consists of thousands of small capillaries (inner diameter in the range of 200 μm and wall thickness of 8-40 μm). Blood flows inside the capillaries whereas dialysate flows counter currently around them. Typical blood flow rates are in the range of 200 up to 350 mL/min, while dialysate flows are preferably twice the blood flow with a typical value of 500 mL/min. Membranes used in hemodialysis are of two basic types: organic cellulose derivatives (i.e. cuprophan, cellulose di-, tri- acetate and hemophan) and synthetic membranes (i.e. polyacrylonitrile, polysulfone, polyamide, polymethyl-methacrylate). With respect to the membrane characteristics, distinction can be made between low, medium, and high flux dialyzers on one hand (ultrafiltration coefficient lower than 15, between 15 and 40, and higher than 40 mL/h/mmHg, respectively), and low and high area dialyzers on the other (membrane surface lower and higher than 1.5 m², respectively).
In hemodialysis therapy, the dialyzer succeeds in purifying the blood and extracting the excess water due to basic transport phenomena, such as diffusion, ultrafiltration, and osmosis. As transport takes place between the blood and dialysate compartment over a semi-permeable membrane, fluid characteristics and membrane properties should also be considered.
Molecules in the blood, with a molecular size smaller than the pore size of the membrane, can diffuse across the semi-permeable membrane into the dialysate. The driving force for the diffusion is the concentration difference between the blood (high concentration) and the dialysate (low concentration). The diffusion is governed by Fick’s law according to:
37
where J is the flux [mmol·L-1], D is the diffusity [cm2·s-1], A is the
area of the membrane [m2], and dc/dx is the concentration
gradient [129].
The diffusity D is a unique property of the solute-solvent system at a specific temperature. The sign convention is adopted, which states that diffusion occurs in positive direction, i.e. from the region of higher activity (conc.) to that of lower so that the concentration will be decreasing in the direction of flux. Therefore, the right hand side of equation 1.7 must carry a negative sign [129]. The diffusity D is a constant at any particular temperature. Therefore, equation 1.7 can be written as:
· · ∆
(1.8)where K0 is the mass transfer coefficient [cm·min-1] and ∆C is the
concentration difference [mmol·L-1] [129].
Equation 1.8 states that with a specific dialyzer (K0·A is constant),
the transfer of solutes from blood into dialysate will depend directly on the concentration difference (∆C). This concentration difference is the driving force of dialysis. The concentration of solutes in blood and dialysate will linearly change, when solutes are transferred from one to the other. The solute concentration in blood decreases whilst in the dialyzer (cBi → cBo). In contrast, the concentration in
the dialysate increases (cDi → cDo). The concentration difference at
any point in the dialyzer determines the flux.
On the other hand, excessive body fluid has also to be removed from the body. However, the driving force for the removal of excessive body fluid is not same as for the solute removal (∆C). The transfer of water from the patient to the dialysate is determined by a pressure difference (∆P). The water flux can be calculated as follows:
38
where QF is the ultrafiltration rate [ml·min-1], and PB-PD is the
pressure difference (driving force) between the pressure on the blood side and the dialysate side [129].
1.3.2 Dialysis fluid characteristics
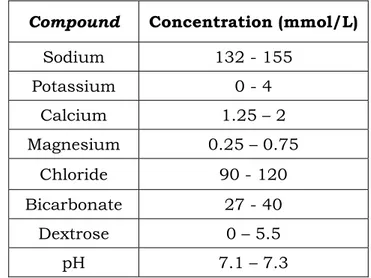
The hemodialysis fluid should be considered as a temporary extension of the patient's extracellular fluid because of the bi-directional transport process when blood and dialysate are flowing through the dialyzer. Therefore, the composition of dialysis fluid is critical in achieving the desired blood purification and body fluid and electrolyte homeostasis. It contains (Table 1.2) reverse osmosis water, dextrose and different electrolytes like calcium-, magnesium-, potassium- and sodium chloride and sodium acetate or –bicarbonate [130]. The latter two fulfill the function of dialysate buffer, responsible for the correction of metabolic acidosis in the uremic patient. Hydrogen ions (H+) are, soon after their production,
buffered by plasma bicarbonate, and can only be removed by the diffusive flux of alkaline from the dialysate into the blood replacing the blood buffers [131].
Table 1.2 Usual composition of dialysis fluid.
Compound Concentration (mmol/L)
Sodium 132 - 155 Potassium 0 - 4 Calcium 1.25 – 2 Magnesium 0.25 – 0.75 Chloride 90 - 120 Bicarbonate 27 - 40 Dextrose 0 – 5.5 pH 7.1 – 7.3
39
Besides the chemical composition, the physical and microbiological characteristics are also important. As the use of highly permeable membranes in hemodialysis is responsible for backfiltration and/or backdiffusion (filtration and/or diffusion from the dialysate compartment towards the blood compartment), toxic and pyrogenic substances can move from the dialysate towards the blood resulting in febrile reactions [132].
Nowadays, the composition of dialysis fluid is prescribed for each single patient to individualize the dialysis therapy according to the personal needs. The actual dialysis machines guarantee accurate proportioning of treated water and concentrated salts, continuous monitoring of the final composition and a constant maintenance of the required conductivity values.
The hemodialysis system is the end point of a hydraulic circuit where tap water is changed into reverse osmosis water through water supply, water pre-treatment, water purification [133], and dialysis fluid preparation. The pre-treatment consists of flowing tap water through filters, softener, carbon filter and microfilters. The subsequent treatment concerns flow through one or two reverse osmosis membranes and a deionizer, closing the purification chain with ultrafiltration and submicrofiltration.
1.3.3 Uremic toxins
The uremic syndrome results from the retention of solutes that are normally cleared by healthy kidneys and secreted into the urine. The gradual retention of a large number of organic metabolites of proteins, fatty acids, and carbohydrates characterizes the progression of renal failure.
Molecular weight is traditionally used as the parameter to classify uremic toxins, resulting in three groups of retention solutes: the
40
toxin class of low molecular weight (MW<500), middle molecular weight (500<MW<15000), and high molecular weight solutes (MW>15000). They can further be subdivided in protein-bound and nonprotein-bound solutes. Recently, an encyclopedic list of uremic retention solutes was composed by the European Uremic Toxin Work Group (EUTox), distinguishing between small molecules (MW<500), small protein-bound solutes (MW mostly <500), and middle molecules (MW>500) [134]. The main known uremic retention solutes are given in Table 1.3.
At present, about 90 uremic retention solutes have been identified. Forty-five of them are small molecules without known protein binding. Twenty-five compounds belong to the group of protein-bound solutes, with a molecular weight smaller than 500 Da, except two (i.e Leptin and Retinal-binding protein). From the 22 recognized middle molecules, 12 have a molecular weight exceeding 15000 Da [134].
Table 1.3 Main known uremic retention solutes. Small water-soluble
molecules Protein-bound solutes Middle molecules
Creatinine Glyoxal β2-Microglobulin
Guanidinosuccinic
acid Hippuric acid β-Endorphin
Hypoxanthine Homocysteine Cystatin C
Methylguanidine Indoxyl sulfate Hyaluronic acid
Malondialdehyde Kynurenic acid Interleukin 1β
Oxalate Methylglyoxal Interleukin 6
Urea p-cresol Leptin
Uric acid Pentosidine Methionine-enkepahlin
41
Low molecular weight molecules are water-soluble and are relatively easy to remove using standard low flux dialysis membranes. Because the removal of small protein-bound solutes is hampered due to protein binding, their dialytic behaviour is comparable to that of larger molecules. The so-called middle molecules can only be removed using high flux dialysis membranes with large pores, unless they are adsorbed on the membrane.
42
CHAPTER
2
Clinical applications
2.1
Warfarin and Oral Anticoagulant Theraphy
Oral anticoagulant therapy (OAT) with coumarin derivatives such as warfarin, acenocoumarol and phenprocoumon, (also called vitamin K antagonists), extends the time it takes for the blood to clot, thereby reducing thromboembolic events in multiple clinical contexts [135]. These include atrial fibrillation, treatment of deep-vein thrombosis, pulmonary embolism, prosthetic heart valves, and acute myocardial infarction. In fact, oral anticoagulant treatment has been available for more than 60 years, and is prescribed for both prophylactic and therapeutic use to patients at increased risk of thromboembolism. The relation between blood clotting and coumarin derivates was established by Dam and Doisy who shared the Nobel Prize in 1943 for their work [136, 137]. Their main discoveries were the postulation and prove of the existence of vitamin K (K for German Koagulation) and the description of structure of the vitamin. The fundamental physiological mechanism of affecting synthesis of certain coagulation factors was known, however, the biochemical description and understanding was yet to be established in the mid 70’s [138].
Both in Italy and around the world, patients receiving oral anticoagulant therapy are very numerous and tend to increase steadily in recent years. Reasons include improvements in clinical outcomes, increasing common disease indications for their use [139], and improvements in anticoagulant safety [140]. According
![Table 2.1 Physicochemical Properties of warfarin [150].](https://thumb-eu.123doks.com/thumbv2/123dokorg/7563844.110827/51.892.182.749.299.612/table-physicochemical-properties-of-warfarin.webp)