Translational insights into the phenotype of sarcopenic obesity
Eleonora Poggiogalle, M.D.
Submitted for the degree of
Ph.D. in ENDOCRINOLOGICAL SCIENCES
Curriculum in Endocrinological, Metabolic and Andrological Sciences
XXXI Cycle
Director: Professor Andrea Lenzi
Supervisor
Co-Supervisors
Professor Lorenzo M Donini
Professor Yves Boirie
Professor Christelle Guillet
In collaboration with
Unité de Nutrition Humaine, UMR 1019 INRA/UCA, CHU Service de Nutrition
Clinique, Clermont-Ferrand, France
2
Table of contents
p.
1. Introduction and significance 3
Overarching summary 5
2. First part: animal study. “Impact of protein intake and high fat diet on muscle protein synthesis, ectopic lipid infiltration, energy balance and metabolic flexibility in relation to aging in rats”- Abstract 10
Background 12
Materials and Methods 13
Results 17 Discussion 20 Conclusion 24 References 25 Tables 31 Figures 33
3. Second part: clinical study. “The decline in muscle strength and muscle quality in relation to metabolic derangements in adult women with obesity” – Abstract 52
Background 54
Materials and Methods 56
Results 59 Discussion 61 Conclusion 63 References 64 Tables 69 Figures 75 4. Future directions 77 5. Key points 78 6. Acknowledgements 79
3 Introduction and significance
Currently the two major global health challenges are represented, on one hand, by the increase of lifespan and aging population, and on the other hand, by the augmented prevalence rates of obesity (1,2).
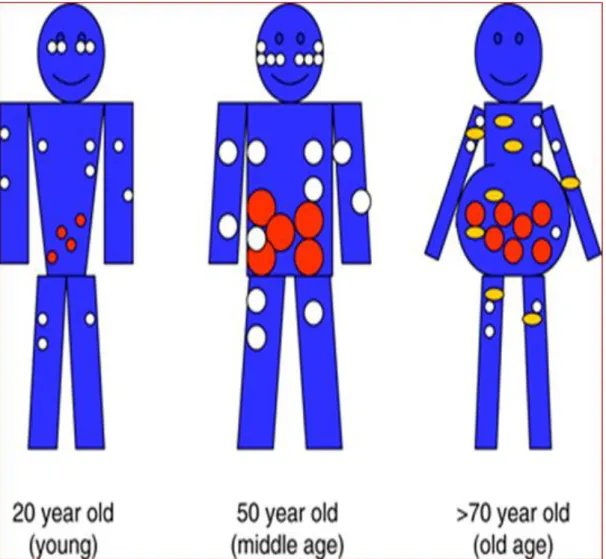
Changes in body composition are the common matrix at the origin of clinical consequences and poor metabolic and functional outcomes in older subjects as well as in individuals with obesity (3,4) [Figure A: “Age-related body composition changes”]. Over the past decades mounting interest has been addressed to the phenotype of “sarcopenic obesity”, that is a clinical syndrome with the overlap of reduced lean mass and increased adipose depots (3,4). The term “sarcopenic obesity” was first used by Baumgartner to describe alterations in body compartments observed in a cohort of older study participants (5). Accumulating evidence suggests that sarcopenic obesity is not simplistically the combination of sarcopenia and obesity, but the two conditions may have synergistic effects in terms of comorbidity (e.g. metabolic and cardiovascular diseases, disability, impaired physical functionality) and mortality (3,4).
Especially in the elderly, stability in body weight is not associated with stability in body composition: even when body weight is maintained stable, the decline in lean body mass has been already described after the third decade, accompanied by a concurrent, progressive increase of the relative adiposity, as body fat percentage (5,6). Increased visceral adiposity and ectopic fat expansion are the main features of age-related changes in adipose tissue.
The vast majority of the extant literature on sarcopenic obesity focused on functional limitations, disability, and impaired physical performance in the older population, and only in recent years greater attention has been paid also to metabolic consequences (3,4,7), but the lack of a universally accepted definition for the diagnosis of sarcopenia and sarcopenic obesity makes difficult comparing results and drawing conclusions.
Multiple determinants are involved in the pathogenesis of sarcopenic obesity, though the interplay among several factors is complex and not thoroughly understood.
An elegant reanalysis of prior studies based on calorie restriction and refeeding allowed a better understanding of mechanisms underpinning body composition changes in relation to energy availability (calorie restriction or energy excess) (8). Evidence supports a reciprocal influence
4
between lean and fat compartments regulated by homeostatic feedback signals finalized to the maintenance of adequate proportions between the two compartments (8,9). Based on the “one-quarter rule”, for a determined amount of body weight gain, approximately 25% consists of lean mass, as an adaptive mechanism to counterbalance metabolically and functionally the increase of body fat (9). Leptin and novel fascinating non-leptin mediators are potential regulators of such homeostatic response (10). The complex scenario of the pathogenesis of sarcopenic obesity encompasses other more classical players, such as sedentary behavior, decline in multiple hormonal axes (e.g. especially regarding sex steroids and growth hormone), inflammation, insulin resistance, mitochondrial dysfunction and oxidative damage (4).
Chronic exposure to nutrient excess has been demonstrated to act as a trigger for a low-grade inflammatory response in metabolic cells, as it occurs in adipose tissue (11). Metabolic cells are able to induce an inflammatory signaling cascade leading to the activation and recruitment of specialized immune cells within the tissue. The term “metaflammation” has been coined to indicate inflammation related to chronic positive energy balance and nutrient overexposure (11,12). Importantly, inflammation is responsible for inhibition of insulin action causing metabolic disturbances as insulin resistance (several inflammatory kinases as JNK, IKK, and PKR are involved in the disruption of insulin-related signaling pathways) (11,12).
Insulin is a relevant anabolic signal in protein anabolism, and insulin resistance is responsible for increased protein catabolism, negatively influencing protein breakdown (13). Insulin resistance plays a central role in a vicious cycle connecting obesity and sarcopenia. The age-related decline in lean body mass favors insulin resistance, as skeletal muscle is the major target tissue of insulin action; in addition, decreased muscularity causes a reduction in basal metabolic rate, favoring weight gain; finally, obesity worsens inflammation and impairs insulin sensitivity (13,14). All together, these mechanisms leads to progressive muscle atrophy and expansion of adipose tissue and ectopic fat depots.
Interestingly, insulin has been also linked to anabolic resistance in the skeletal muscle in healthy, nondiabetic individuals due to impaired insulin action on the vasculature (15): inadequate insulin-mediated vasodilation is responsible for alterations in blood flow and nutrient delivery, especially amino acids, as substrates for protein synthesis.
5
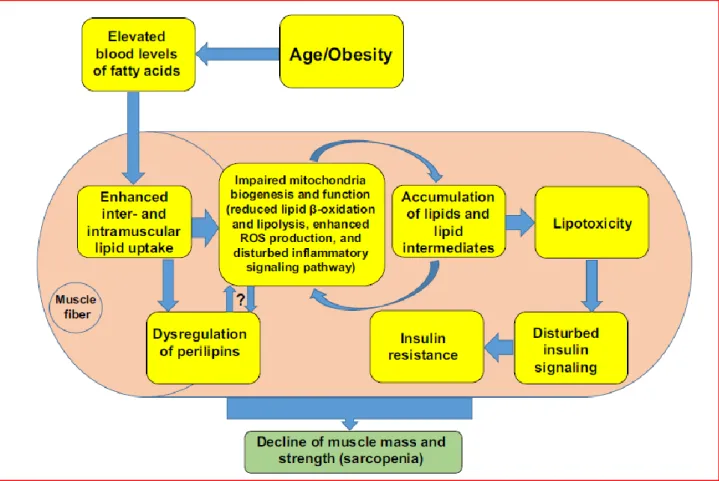
Alterations in mitochondrial biogenesis and age-related mitochondrial dysfunction (reduced fatty acid uptake and oxidation), coupled to chronic excess energy and lipid availability are at the origin of lipotoxicity, characterized by lipid deposition in the skeletal muscle and increased reactive oxygen species production (12,14). Some lipid species and intermediate metabolic by-products, such as ceramides and diacylglycerols (DAGs) have been shown to exert detrimental metabolic effects favoring insulin resistance and inflammation (14). Notably, oxidant signaling pathways activated by ceramides have been shown to affect contractile function in the skeletal muscle, contributing to the development of functional disorders, especially “dynapenia”, that is a reduced strength generation (16-18) [Figure B: “Metabolic connections between sarcopenia and obesity”]. These observations emphasize the contribution of metabolic disturbances to the onset of the phenotypic aspects of sarcopenic obesity, ranging from myosteatosis to reduced muscle strength, disability, and impairment of physical performance.
On the clinical side, a wealth of observations are available regarding the phenotypical aspects of sarcopenic obesity. By contrast, evidence from mechanistic studies is relatively insufficient and further research needs to be prompted for a comprehensive understanding of the pathogenesis of sarcopenic obesity. Especially nutritional geometry is an innovative gateway for the investigation of potential modulation of anabolism in skeletal muscle by nutrients (19).
OVERARCHING SUMMARY
The present dissertation includes an animal study and a clinical study. The first study conducted in rats provides insights for the understanding of nutrient interactions (emphasizing protein and lipid interplay) with protein anabolism and energy metabolism in relation to aging. The second study involved adult women with obesity and the metabolic syndrome, and focused on the association of dynapenia and insulin resistance. These preliminary data may highlight the importance of a gender-specific approach and an early-stage evaluation in the study of metabolic and functional aspects of sarcopenic obesity, posing questions regarding the natural history and trajectory of sarcopenia in the context of obesity in the earliest phases of the aging process.
As an additional contribution to the investigation of body composition phenotypes across aging, carried out during the Ph.D. program, I include a manuscript recently published (20), dealing with body composition changes in osteosarcopenia in the oldest old.
6 References
1. Christensen K, Doblhammer G, Rau R, Vaupel JW. Ageing populations: the challenges ahead. Lancet. 2009;374:1196-208.
2. Batsis JA, Mackenzie TA, Barre LK, Lopez-Jimenez F, Bartels SJ. Sarcopenia, sarcopenic obesity and mortality in older adults: results from the National Health and Nutrition Examination Survey III. Eur J Clin Nutr. 2014;68:1001-7.
3. Kim TN, Choi KM.The implications of sarcopenia and sarcopenic obesity on cardiometabolic disease. J Cell Biochem. 2015;116:1171-8.
4. Stenholm S, Harris TB, Rantanen T, Visser M, Kritchevsky SB, Ferrucci L. Sarcopenic obesity: definition, cause and consequences. Curr Opin Clin Nutr Metab Care. 2008;11:693-700. 5. Baumgartner RN. Body composition in healthy aging. Ann N Y Acad Sci. 2000;904:437-48. 6. Stevens J, Katz EG, Huxley RR. Associations between gender, age and waist circumference.
Eur J Clin Nutr. 2010;64:6-15.
7. Poggiogalle E, Lubrano C, Sergi G, Coin A, Gnessi L, Mariani S, Lenzi A, Donini LM. Sarcopenic Obesity and Metabolic Syndrome in Adult Caucasian Subjects. J Nutr Health Aging.
2016;20:958-963.
8. Dulloo AG, Jacquet J, Montani JP, Schutz Y. How dieting makes the lean fatter: from a perspective of body composition autoregulation through adipostats and proteinstats awaiting discovery. Obes Rev. 2015;16:25-35.
9. Dulloo AG, Jacquet J, Miles-Chan JL, Schutz Y. Passive and active roles of fat-free mass in the control of energy intake and body composition regulation. Eur J Clin Nutr. 2017;71:353-357. 10. Ravussin Y, Edwin E, Gallop M, Xu L, Bartolomé A, Kraakman MJ, LeDuc CA, Ferrante AW
Jr.Evidence for a Non-leptin System that Defends against Weight Gain in Overfeeding. Cell Metab. 2018;28:289-299.e5.
11. Gregor MF, Hotamisligil GS. Inflammatory mechanisms in obesity. Annu Rev Immunol. 2011;29:415-45.
12. Kalinkovich A, Livshits G. Sarcopenic obesity or obese sarcopenia: A cross talk between age-associated adipose tissue and skeletal muscle inflammation as a main mechanism of the pathogenesis. Ageing Res Rev. 2017;35:200-221.
13. Guillet C, Masgrau A, Walrand S, Boirie Y. Impaired protein metabolism: interlinks between obesity, insulin resistance and inflammation. Obes Rev. 2012;13:51-7.Cleasby ME, Jamieson
7
PM, Atherton PJ. Insulin resistance and sarcopenia: mechanistic links between common co-morbidities. J Endocrinol. 2016 May;229:R67-81.
14. Cleasby ME, Jamieson PM, Atherton PJ.Insulin resistance and sarcopenia: mechanistic links between common co-morbidities.J Endocrinol. 201;229:R67-81.
15. Timmerman KL, Lee JL, Dreyer HC, Dhanani S, Glynn EL, Fry CS, Drummond MJ, Sheffield-Moore M, Rasmussen BB, Volpi E. Insulin stimulates human skeletal muscle protein synthesis via an indirect mechanism involving endothelial-dependent vasodilation and mammalian target of rapamycin complex 1 signaling. J Clin Endocrinol Metab.
2010;95:3848-57.
16. Ferreira LF, Moylan JS, Gilliam LA, Smith JD, Nikolova-Karakashian M, Reid MB.
Sphingomyelinase stimulates oxidant signaling to weaken skeletal muscle and promote fatigue. Am J Physiol Cell Physiol. 2010;299:C552-60.
17. Baumann CW, Kwak D, Liu HM, Thompson LV. Age-induced oxidative stress: how does it influence skeletal muscle quantity and quality?J Appl Physiol (1985). 2016;121:1047-1052. 18. Scott D, Daly RM, Sanders KM, Ebeling PR.Fall and Fracture Risk in Sarcopenia and
Dynapenia With and Without Obesity: the Role of Lifestyle Interventions. Curr Osteoporos Rep. 2015;13:235-44.
19. Simpson SJ, Le Couteur DG, Raubenheimer D, Solon-Biet SM, Cooney GJ, Cogger VC, Fontana L.Dietary protein, aging and nutritional geometry. Ageing Res Rev. 2017;39:78-86. 20. Poggiogalle E, Cherry KE, Su LJ, Kim S, Myers L, Welsh DA, Jazwinski SM, Ravussin E. Body
Composition, IGF1 Status, and Physical Functionality in Nonagenarians: Implications for Osteosarcopenia. J Am Med Dir Assoc. 2018 Aug 24. pii: S1525-8610(18)30389-X.
8
Figure A: Age-related body composition changes, adapted from Stevens J, Katz EG, Huxley RR. Associations
9
Figure B: Metabolic connections between sarcopenia and obesity, adapted from Kalinkovich A, Livshits G.
Sarcopenic obesity or obese sarcopenia: A cross talk between age-associated adipose tissue and skeletal muscle inflammation as a main mechanism of the pathogenesis. Ageing Res Rev. 2017;35:200-221.
10 FIRST PART: ANIMAL STUDY
Impact of protein intake and high fat diet on muscle protein synthesis, ectopic lipid infiltration, energy balance and metabolic flexibility in relation to aging in rats
Abstract
Background Ectopic lipid deposition impairs muscle anabolic response especially during aging. We
hypothesized that the anabolic efficiency of dietary protein in skeletal muscle might be affected within the context of high-fat diet.
Aims The objectives of the study were to investigate muscle protein synthesis, intramuscular lipid
deposition, energy balance, and metabolic flexibility in response to two levels of protein intake combined to two levels of fat intake.
Methods Two groups of fifty-eight adult and forty-one old male Wistar rats were randomly divided
into four groups: isocaloric standard diet (12% protein, 14% lipid, as STD12); isocaloric standard (high-protein) diet (25% protein, 14% lipid, STD25); hypercaloric high-fat (normal-protein) diet (12% protein, 45% lipid, HFD12); and hypercaloric high-fat (high-protein) diet (25% protein, 45% lipid, HFD25). The nutritional intervention lasted 10 weeks. The fractional synthesis (FSR) and absolute synthesis rates (ASR) of mixed muscle proteins were calculated using isotopically labelled C13-valine incorporation in tibialis anterior (TA). Muscle lipid content was assessed using a
chromatography-based method. Protein efficiency ratio (PER) was calculated as PER = {100*[weight gain (g)/protein ingested (g)]}. Respiratory exchanges were assessed by indirect calorimetry, and respiratory quotient (RQ) was calculated. Metabolic flexibility and energy homeostasis were evaluated by the analysis of 24h-RQ using the relative cumulative frequency methodology.
Results Rats in the high-fat diet groups self-limited their food intake, so that energy intake was not
different among the groups. Regardless of dietary intervention, TA muscle weight was lower in old groups compared to their adult counterparts (all p values < 0.01). FSR was lower in old rats fed the HFD25 compared to the old STD12 group (diet effect : p=0.02), whereas FSR in old groups was higher than adult groups (age effect, all p values < 0.05). When considering the ASR, no differences emerged between groups except for a tendency towards higher ASR values in the old HFD12 group than the STD25 group (diet effect: p=0.09). Only old rats in the HFD12 group exhibited increased intramuscular triacylglycerols in TA (age effect : p=0.02 ; diet effect : HFD12 vs. STD 12: 2.04±1.74
11
vs. 0.83±0.49ug/g, p=0.02).PER was lower in the HFD25 group than the HFD12 group, regardless of age (old rats: 25.5 ± 6.2 vs. 57.4 ± 20.1, adult rats: 30.7 ± 15.9 vs. 78.84 ± 20.9, diet effect, p<0.05). In both adult and old rats, PER was higher in the HFD12 groups than the STD12 and STD25 groups (diet effect, p<0.05). Old rats in the HFD25 group exhibited lower RQ values than the HFD12 group, indicating that they relied more markedly on lipids as substrate for oxidation (RQ: 0.83 ± 0.04 vs. 0.87 ± 0.01, diet effect, p<0.05). The comparison between RQ and FQ indicated that, save in the HFD25 groups, RQ was higher than FQ, suggesting energy storage.
Conclusion Aging is characterized by a reduced muscle weight despite an increased FSR,
suggesting specific alterations in the nutritional regulation of muscle protein turnover. In isocaloric conditions, higher protein intake modulates muscle lipid infiltration, but does not improve age-related anabolic resistance in old rats fed a high-fat diet.
12 BACKGROUND
The age-related changes in body composition may be precipitated by energy and nutrient imbalances, as it occurs in obesity (1). In the last decades growing interest has been directed to the phenotype of sarcopenic obesity, a syndrome characterized by the co-existence of increased adiposity and reduced lean body mass (2). Despite a wealth of clinical studies investigating clinical aspects of sarcopenic obesity (3-5), mechanistic data are scarce and the pathogenesis of sarcopenic obesity, as well as the interaction between nutrient metabolism and anabolic response in the aging trajectory, need to be further explored. Even in case of stable weight, adiposity tends to redistribute from the subcutaneous depots toward the visceral compartment. The limited expandability of subcutaneous adipose tissue in obesity can exacerbate the above mentioned alterations in body compartments favoring ectopic lipid accumulation (e.g. in the liver and in the skeletal muscle) (6). In addition , in obesity and during aging, a reduced fat oxidative capacity has been associated to muscle lipid accumulation and insulin resistance (7). Ectopic lipid infiltration is able to impair muscle anabolic response especially during aging (8, 9). However, to which extent protein intake can modulate protein anabolism in the presence of excess energy and high-fat feeding, and the interference of aging, has not been thoroughly understood yet. We hypothesized that the anabolic efficiency of dietary protein in skeletal muscle may be affected within the context of high fat diet. The objectives of the study were: to investigate muscle protein synthesis, ectopic lipid infiltration in the skeletal muscle (i.e. myosteatosis), energy balance, and metabolic flexibility in response to two levels of protein intake combined to two levels of fat intake.
13 MATERIALS AND METHODS
Animals and experimental procedures
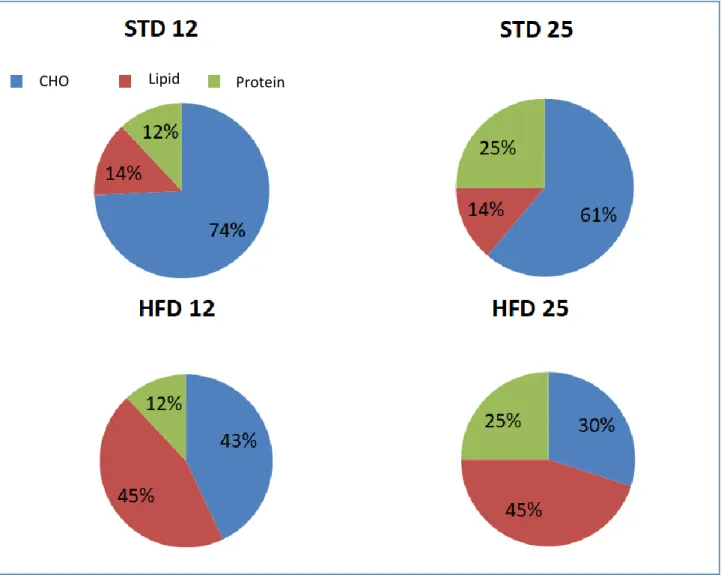
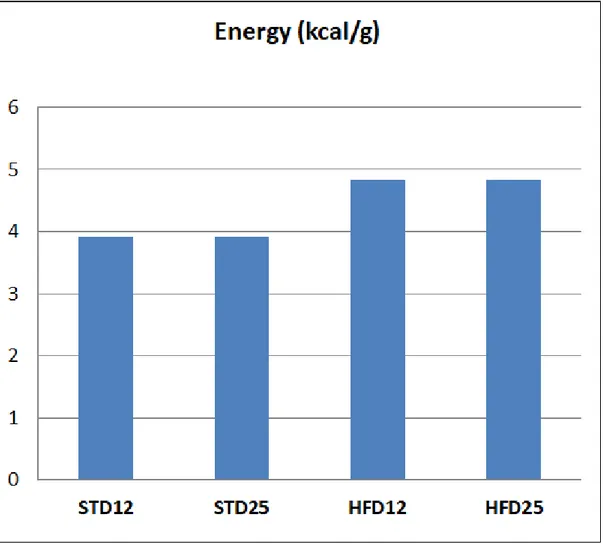
Experiments were conducted according to guidelines for the care and use of animals, and approved by the local Ethical Committee for animal experimentation . Fifty-eight adult and forty-one old male Wistar rats (CERJ Janvier, Le Genest St. Isle, France) –aged 9 months and 22 months, respectively- were individually housed with free access to water under standard conditions (controlled room temperature 20°C to 22°C, inverted 12:12h light-dark cycle). After 1-week acclimatization, animals were randomly divided into four groups, according to body weight, body fat, and fat-free mass assessed by Echo-MRI® (EchoMRI® 900, Texas, USA) at baseline, as follows : isocaloric (3.9 kcal/g) standard (normal- protein) diet (12% protein, 14% lipid, and 74% carbohydrate) ; isocaloric (3.9 kcal/g) standard (high-protein) diet : (25% protein, 14% lipid, and 61% carbohydrate) ; hypercaloric (4.8 kcal/g) high-fat (normal-protein) diet : (12% protein, 45% lipid, and 43% carbohydrate) ; and hypercaloric (4.8 kcal/g) high-fat (high-protein) diet : (25% protein, 45% lipid, and 30% carbohydrate). The duration of nutritional intervention was 10 weeks. Experimental diet compositions are shown in Figures 1 and 2. Study design is summarized in Figure 3.
Body weight & Body composition
Body weight was measured on a weekly basis from baseline to week 10.
Total body composition [two compartments: fat mass (FM) and fat-free mass (FFM)] was measured at baseline (time 0: “T0”), after 5 weeks (time 1: “T1”), and at week 10 (time 2: “T2”), at the end of the study, through Echo-MRI (EchoMRI® 900, Texas, USA) (10). The metabolic body size, corresponding to the active metabolic mass (AMM), was calculated as follows: (FFM + 0.2 * FM) (11).
Intramuscular lipid content
Lipids were extracted from tibialis anterior muscle according to Bligh and Dyer (12) in the presence of the internal standards. Diacylglycerols (DAGs) and triacylglycerols (TAGs) were analyzed by gas-liquid chromatography on a FOCUS Thermo Electron system using a Zebron-1 Phenomenex fused silica capillary column (5 m 9 0.32 mm i.d, 0.50 lm film thickness).
Measurement of in vivo muscle protein synthesis
Reagents were obtained from Sigma Chemical (St Louis, MO, USA) and L-13C-valine (99 atom%
14
was assessed in tibialis anterior muscle by using the flooding-dose method (13). After an overnight fast, rats were injected subcutaneously with L-13C-valine (300 μmol (100 g body)−1). The
incorporation time was 50 min. After anaesthesia by inhalation of 5% isoflurane and oxygen for 3 to 5 min, rats were killed by exsanguination- blood was collected from the aorta artery. After centrifugation plasma and serum samples were frozen at −80◦C until analysis. Tibialis anterior muscles of both legs were quickly excised, weighed, frozen in liquid nitrogen and stored at −80◦C.
Analytical method
An 80 mg piece of tibialis anterior was used to isolate mixed proteins as described previously (14). Muscle samples were homogenized in an ice-cold buffer, using a Potter-Elvehjem homogenizer. A fraction of the homogenate was collected to measure total muscle protein synthesis rates. After protein hydrolysis (6 N HCl, 110◦C, 24 h), amino acids were derivatized, and measurement of L-13
C-valine enrichment in hydrolysed proteins was performed using gas chromatography–combustion– isotope ratio mass spectrometry (Gas System; Fisons Instruments, VG Isotech, Middlewich, UK).
L-13C-valine enrichments in tissue fluid were assessed using a gas chromatograph–mass
spectrometer (Hewlett-Packard 5971A; Hewlett-Packard Co., Palo Alto, CA, USA) and used as precursor pool enrichment for the calculations of the fractional synthesis rate (FSR).
FSRs were calculated as previously described in Guillet et al. (14). FSR of mixed proteins was calculated using the following equation: FSR = (Ei × 100)/(EP × t) (1) where Ei represents the enrichment as atom percentage excess of [13C] derived from valine from proteins at time t (minus
basal enrichment); EP is the mean enrichment in the precursor pool (tissue fluid L-1-13C-valine); t is
the incorporation time in day. Data are expressed as percentage per day.
Absolute synthesis rate (ASR) was calculated by multiplying FSR by total tissue protein content (mg per day).
Glucose homeostasis
Glucose concentrations were determined by using Konelab20 (Thermo Electron Corporation) and Konelab system reagents (Thermo Fisher Scientific, Vantaa, Finland). Plasma insulin concentrations were measured using an ELISA kit (Millipore Corporate Headquarters, Billerica, MA, USA).
15 Energy balance and food efficiency
Energy balance (EB) was computed from changes in body composition [assuming that 4.8 kJ/g are fixed in lean tissues and 34 kJ/g in adipose tissue (11)] for the whole 70 days of feeding (EB-MRI) and from differences between calorie intake (CI) and total energy expenditure (TEE) measured during the calorimetry measurements (EB- Calo). Food efficiency during calorimetry measurements was computed as the ratio of energy deposited to caloric intake (kJ/kJ).
Food efficiency was also assessed according to the Food Efficiency Ratio (FER) calculated as: FER = {100*[weight gain (g)/food intake (g)]} (15).
In addition, protein efficiency was evaluated through the Protein Efficiency Ratio (PER), computed as follows:
PER = {100*[weight gain (g)/protein ingested (g)]} (15).
In order to explore further energy balance, the relationship between energy utilization and energy storage was investigated comparing respiratory quotient (RQ) versus Food Quotient (FQ) computed as:
FQ = (0.835 * % protein) + (1.0 * % carbohydrate) + (0.71 * % lipid) (16).
assuming a quotient of oxidation of 1.0 for carbohydrate, 0.825 for protein, and 0.70 for lipid. In more detail, food quotient is a theoretic RQ expected on the basis of diet composition but it can be different from the actual RQ due to variability in metabolic flexibility to energy substrate.
Energy Expenditure
During the last (10th) week of the study, the rats were housed for five consecutive days in
metabolic cages (TSE System PhenoMaster/LabMaster, Bad Homburg, Germany) with free access to the four diets for measurements of total daily energy expenditure (TDEE), feeding behaviour, and spontaneous motor activity (17). In the present study data regarding energy expenditure only are shown.
Gas exchanges (VO2 and VCO2) were measured for each cage during 2 min every 5 min.
Measurements were performed over 4 days. The first day spent in the metabolic cage was used for habituation. VO2 and VCO2, calorie intake (CI), and spontaneous activity were measured on
16
To account for variability in rats in terms of body size and composition, energy expenditure and caloric intake were adjusted to fat free mass (FFM) and active metabolic mass (AMM) by linear regression analyses (18).
Metabolic flexibility
Every RQ measurement from each group, rat, and interval over 96-h binned by value and then converted to a relative cumulative frequency as percentage (PRCF), as first described by Riachi et al. (19).
The median value (50th percentile) corresponded to the 24-h RQ value, and the direction of
energy imbalance (i.e. either negative or positive energy imbalance) was related to the horizontal displacement of the 24-h RQ value from the dietary food quotient value.
Statistical Analysis
Data are presented as means ± SD. Data analyses were performed using IBM SPSS Statistics, version 23 (IBM Corp., Armonk, NY). Distributions of continuous variables were examined for skewness and kurtosis, and were logarithmically transformed when appropriate. Log-transformed variables are presented as untransformed values for ease of reading (insulin, insulin-to-glucose ratio, FGIR). A two-way analysis of variance (ANOVA) was performed to test the effect of the experimental nutritional conditions and the effect of age. When a significant effect was detected, an a posteriori Fisher test was applied to locate pairwise differences between groups. Pearson’s correlation was used to examine the relationship between variables. Regarding the analysis of the percentage relative cumulative frequency (PRCF) of RQ, the 50th percentile values of the PRCF
(Gaussian distribution ascertained) were compared using unpaired t test. The level of significance for all statistical tests was set at p<0.05.
17 RESULTS
Body weight and body composition
Body weight and body composition trajectories over time are shown in Figures 4-6. More detailed data are provided in Tables 1 and 2.
Regarding body weight, a time effect (p<0.05) was observed in all diet groups compared to control group (STD12) at all time-points in adult rats; in old rats in all diet groups compared to control group time effect (p<0.05) was detected between body weight at T1 or T2 versus T0, whereas in the HFD25 group body weight tended to decline between week 5 and week 10. A significant diet effect was observed in both adult and old rats in the HFD12 compared to STD12 and STD25 groups (p<0.05).
With respect to changes in body compartments, a time effect (p<0.05) for the increase in body fat was reported in all diet groups at all time-points regardless of age group. In adult rats and old rats body fat was significantly increased at T1 and T2 in the HFD12 group compared to the STD12 and STD25 group (diet effect, p<0.05), but not in the HFD25 group.
Changes in body compartments are more clearly displayed in Figures 7 and 8 as delta changes between baseline and week 10. Notably, fat-free mass in the old HFD25 group was significantly lower than STD25 group (diet effect, p<0.05).
Energy balance, food efficiency and protein efficiency
Despite diets providing higher energy were administered to the HFD12 and HFD25 groups compared to the two STD groups, rats in the high-fat diet groups self-limited their food intake, and no differences were observed in calories ingested (Figure 9).
Energy balance, as energy ingested and stored as fat mass and fat-free mass, was significant augmented in adult HFD12 and HFD25 groups compared to their STD12 and STD25 counterparts (diet effect, p<0.05); in old rats a significant diet effect was detected between the HFD25 group and the STD25 group (Figure 10).
Food efficiency (as the ratio between energy stored in soft tissues and energy ingested) was higher in adult HFD12 rats than the standard diet groups (diet effect, p<0.05), and in HFD25 group than the STD25 group, whereas in old rats food efficiency was higher in the HFD12 group than the STD25 group (diet effect, p<0.05). When considering food efficiency ratio (FER), based on weight gain to food intake ratio, findings were quite overlapping for diet effect, and in terms of time effect in the HFD12 groups, FER was lower in old rats than adult rats (FER: 8.3 ± 2.8 vs. 11.4 ± 3.0,
18
p<0.05). Remarkably, protein efficiency ratio was lower in the HFD25 group than the HFD12 group, regardless of age (old rats: 25.5 ± 6.2 vs. 57.4 ± 20.1, adult rats: 30.7 ± 15.9 vs. 78.84 ± 20.9, diet effect, p<0.05). In both adult and old rats, PER was higher in the HFD12 groups than the STD12 and STD25 groups (diet effect, p<0.05). Food efficiency data and protein efficiency data are shown in Figure 11.
Protein anabolism: FSR & ASR
FSR and ASR values are displayed in Figures 12 and 13. FSR was lower in old rats fed the HFD25 compared to the old STD12 group (diet effect: p=0.02). FSR in old groups was higher than adult groups (age effect, all p values < 0.05) save the HFD25 group. When considering the ASR, no differences emerged between groups, except for a tendency towards higher ASR values in the old HFD12 group than the STD25 group (diet effect: p=0.09). Regardless of dietary intervention, tibialis anterior muscle weight was lower in old groups compared to their adult counterparts (all p values < 0.01). Similarly, an age effect was detected in all groups when total hindlimb muscle weight was considered (all p<0.05); a diet effect was observed in adult HFD12 (18.96 ± 2.06 g) and HFD25 (19.12 ± 2.0 g) groups compared to the adult STD25 group (15.52 ± 2.02 g), p<0.05.
Ectopic lipid content (intramuscular lipids)
Figure 14 shows data concerning ectopic lipid accumulation. Only old rats in the HFD12 group exhibited increased intramuscular triacylglycerols (TAGs) in TA than the control group (age effect: p=0.02; diet effect: HFD12 vs. STD 12: 2.04±1.74 vs. 0.83±0.49 ug/g, p=0.02). No significant differences emerged in the adult groups. Surprisingly DAGs were detected just in a minority of rats, preventing further analyses and comparisons.
Glucose metabolism
Glucose levels were significantly lower in old HFD25 rats (6.8±2.7 vs. HFD12: 7.5±1.4 mmol/l vs. STD25: 7.8±0.9 mmol/l vs. STD12: 8.2±1.5 mmol/l) than the other three groups (diet effect, p<0.02), whereas no differences were found among the adult groups. When compared to their adult counterparts, old rats in the STD12, ST25, and HFD12 groups had higher glucose concentrations (time effect, p<0.005).
Insulin levels were significantly lower in the old HF12 group than the adult group (time effect, p=0.039), and old HFD25 rats tended to have lower insulin levels than the adult group (time effect, p=0.07).
19
Insulin-to-glucose ratio was significantly higher in adult HFD12 rats than adult STD12 rats (0.95± 0.36 vs. 0.63±0.19, diet effect, p= 0.01); in old STD25, HFD12 and HFD25 groups, insulin-to-glucose ratio was significantly lower than adult groups (time effect, p<0.05) .
Insulin resistance and protein synthesis (FSR)
FSR was negatively correlated with the insulin-to-glucose ratio (r= -0.272, p= 0.012) and positively associated with the FGIR (r= 0.234, p= 0.33). FSR was positively correlated with glucose levels (r= 0.544, p<0.001). A negative correlation was found between FSR and protein content in the TA muscle (r=-0.619, p<0.001).
Energy expenditure, fuel selection, and metabolic flexibility
Figures 15-18 show energy expenditure data. In all groups, save the STD25 groups, TDEE adjusted for either FFM or the active metabolic mass was significantly lower in the old groups compared to the adult groups. No diet effect was observed (Figure 15).
According to the respiratory quotient (RQ) values (Figure 16), old rats in the HFD25 group exhibited lower RQ values than the HFD12 group, indicating that they relied more markedly on lipids as substrate for oxidation (RQ: 0.83 ± 0.04 vs. 0.87 ± 0.01, diet effect, p<0.05).
The comparison between RQ and FQ indicated that, save in the HFD25 groups, RQ was higher than FQ, suggesting energy storage (Figure 17). These data are in agreement with results obtained using the relative cumulative frequency method, indicating positive energy imbalance in groups with curves shifted right (Figure 18).
20 DISCUSSION
Accumulating evidence suggests a stringent relationship between obesity and sarcopenia. However, the majority of data concerning sarcopenic obesity rely on findings from clinical studies, and evidence is scarce in terms of underlying mechanisms. The present study conducted in rats sheds light on the potential interaction among aging and nutrient imbalance in the development of the phenotype of sarcopenic obesity. Based on our observations, in isocaloric conditions, high protein intake affected lipid infiltration in the skeletal muscle, without ameliorating age-related anabolic resistance in old rats fed a high-fat diet, leading to reduced skeletal muscle weight (namely, “sarcopenia”).
Given that rats receiving high-calorie diets self-limited their energy intake, leading to a lack of differences in terms of calorie intake among the four groups, observations can be interpreted as effects of macronutrient manipulation, namely protein and lipid manipulation, without the influence of overfeeding. However, our findings with regard to the self-limitation of ingested calories are in line with data in mice showing that food intake was reduced with high-protein-content diets once protein intake exceeded about 10 kJ/day, whereas carbohydrate intake decelerated once carbohydrate intake exceeded about 15 kJ/day (20). Indeed based on animal and human studies, it is well-established that protein intake acts as a pivotal modulator of mechanisms of appetite, with elevated protein intake associated with high satiety and satiation (21-23). However rats in the high fat groups reported an increase in adiposity even in the absence of energy excess with respect to the two standard diets groups. These data are in agreement with prior animal studies revealing that an isocaloric high-fat diet induced weight gain and fat accumulation than the isocaloric control diet (24-26).
Differential metabolic flexibility to lipid versus carbohydrate can be also implicated in fat deposition when lipid dietary content is increased and calories are not: when lipids provided by the diet are augmented, it can take several days, even weeks, to adapt to increased energy substrate (namely lipid) availability: in the case of lipids, this delayed switch from preferential carbohydrate to lipid oxidation can be at the origin of the expansion of fat depots, as initial process in the development of obesity (27).
The relevant role of dietary composition, especially in terms of high-fat and high-sucrose diets (24, 25), emerged as an important determinant of body weight regulation, the interplay between lipid and protein has been poorly investigated. From our findings, it appeared that high-protein intake
21
(25%) combined with high-lipid intake limited weight gain and fat deposition especially in adult as well as old rats. When it comes to effects on lean compartments, the old rats, but not adult rats, reported a lower increase in fat-free tissues in response to high protein, high-fat feeding. These observations may be related to the presence of anabolic resistance in the aged rats (28); furthermore, a downregulation of genes involved in lipogenesis and an up-regulation of genes related to fatty acid β-oxidation have been described after high-protein diets (29, 30). More recently, an intriguing non-leptin dependent model has been hypothesized to support a mechanism preventing weight gain in response to high-fat and/ or high-calorie intake in order to defend the body from further gain in weight and adipose depots (31, 32). In this original homeostatic scenario, the role of macronutrient interaction, especially the potential role played by different protein amounts, has yet to be established. In fact, based on our observations, in which 12% protein, but not 25%, in the high-fat diet group elicited fat-free mass accretion, one can hypothesize that a threshold of protein intake can be responsible for anabolic or catabolic response in the presence of high-fat feeding. This hypothesis may be consistent also with our findings in terms of food efficiency and protein efficiency. Regardless of protein amount, both hyperlipidic diets resulted in increased food efficiency. By contrast, protein efficiency (as weight gain related to protein intake) was lower in rats in the high-fat diet with 25% protein compared to rats in the HFD12 group regardless of age.
Alterations in glucose metabolism and insulin resistance, with relevant impact on protein anabolism, represent additional explanations for our observations. Beyond the interaction between protein and lipid content, we have to acknowledge that macronutrient imbalance in the HFD groups included not only lipid and protein but also carbohydrate intake. Insulin is a crucial factor in the regulation of protein anabolism and protein breakdown (33). In terms of macronutrient imbalance, rats in the HFD with 25% protein ingested 25% carbohydrate compared to 43% energy from carbohydrates in the HFD - 12 % protein groups. Glucose levels in the old HFD25 rats were lower than the other groups, and insulin-to glucose ratio was lower in old HFD groups than their adult counterparts. An insufficient stimulation of insulin secretion in relation to carbohydrate dietary content (34), as well as anabolic resistance to insulin in the old groups (35), can be postulated to explain body weight, fat-free mass, and protein efficiency trajectories over the 10-week dietary intervention in rats ingesting high-fat high-protein, and relatively low-carbohydrate, diet. The present potential explanation is supported also by other findings in our
22
study: globally, a positive correlation has been observed between the fractional synthesis rate for mixed muscle proteins and glucose levels or FGIR. Elevated insulin-to-glucose ratio can also be considered as a marker of insulin resistance (36). FSR was inversely related to insulin-to-glucose ratio, indicating that rats with higher insulin resistance exhibited lower protein synthesis ability. The finding of higher FSR in old groups than adult rats is potentially related to their lower muscle protein content, the latter likely exerting a homeostatic pressure toward increased protein synthesis, as well as elevated protein turnover. In fact differences disappeared when accounting for protein content in the calculation of the absolute synthesis rate, suggesting that intrinsic protein synthesis ability in the skeletal muscle is not affected by aging, but it can be modulated by changes in the lean body mass. These results are in agreement with data from Mosoni et al. (37). Moreover, elevated protein intake did not ameliorate age-related anabolic resistance in old rats fed a high-fat diet. However, we have to take into account that we did not assess protein
breakdown, protein translation efficiency (38), and age- related shift in skeletal muscle fibers (39) as additional factors potentially providing with a more comprehensive and exhaustive explanation for our findings across aging.
Concerning ectopic lipid accumulation and lipotoxicity, we found increased intramuscular TAGs in old rats in the HFD12 group but not in the adult HFD12 group; in a context of fat overfeeding, independent of energy excess, aged rats accumulated intramuscular lipids, especially TAGs, but not DAGs. Generally speaking, in aged animals and humans, lipid accumulation within the skeletal muscle, namely “myosteatosis”, may be mainly due to the age-related mitochondrial dysfunction. Mitochondrial disturbances occurring with aging are characterized by altered mitochondrial biogenesis (i.e. leading to giant, dysfunctional mitochondria) and limited oxidative capacity; also an increased production of reactive oxygen species is another hallmark of mitochondrial senescence. All together, these derangements favor the expansion of lipid droplets. Conversely, intramuscular TAGs were not increased in the HFD25 groups, and a role for high-protein diet in preventing ectopic lipid deposition needs to be explored in future research. However, our observations are somewhat in line with recent findings from French et al. (40), showing that lean and obese rats fed a high-protein diet (40% protein) exhibited lower lipid deposition in the skeletal muscle than lean and obese rats on a 20%- protein diet. The discrepancy of TAGs accumulation but not DAGs deposition in the TA muscle in old rats may be due to the lack of excess energy intake; furthermore, given that DAGs are generated from TAGs through reactions catalyzed by lipase (or
23
acyltransferase), a role for reduced activity of hormone-sensitive lipase can be postulated because of the decline in the somatotropic axis as well as the altered catecholamine catabolism during aging (41,42). Unfortunately we did not explore the GH/IGF1 axis or other endocrine axes in the present study to verify this hypothesis. However our results are in agreement with a study of overfeeding with high-fat diet in mice showing that TAGs only, and not DAGs, increased after HFD (43), as well as analogous observations in young and old rats fed a HFD reporting an increase in ceramide levels but not DAGs in the tibialis anterior muscle (9).
With respect to energy expenditure, when variability in body size and body composition was taken into account (through adjustment for fat-free mass or active metabolic mass), total daily energy expenditure was lower in old rats compared to the adult groups. A decline in energy expenditure during aging is associated to the decrease in the metabolically active mass (lean body mass and organ mass) (44). Our results accounting for changes in the lean compartments, may be explained by a reduction in contribution to total energy expenditure from fat-free tissues excluding skeletal muscle mass, such as organ mass, whose volume and function can be also affected by aging. Additional potential determinants of our finding could be altered skeletal muscle quality and blunted stimulation of energy expenditure mediated by catecholamine in aging (42).
Based on analysis of respiratory quotient, HFD25 rats used mainly lipids as substrate for oxidation showing higher metabolic flexibility that rats in the HFD12; these observations may be due to a more favorable metabolic profile (i.e. insulin sensitivity, as indicated by the insulin-to-glucose ratio) (45).
Regardless of age, excluding rats fed the HFD25, a respiratory quotient higher than food quotient was observed, indicating energy storage (46). These findings are consistent with data regarding changes in body composition, suggesting that the imbalance in macronutrients as in the HFD25 was less effective for anabolic purposes. Moreover, these data are in agreement with the more positive energy imbalance in HFD12 rats than HFD25 rats as indicated by the representation of substrate flexibility and energy balance through the original relative cumulative frequency method that we used for respiratory quotient (19).
The point of strength of the present study is a comprehensive assessment of effects of macronutrient manipulation, with emphasis on protein and lipid intakes, in aging on skeletal muscle protein anabolism, intramuscular lipid infiltration, energy homeostasis and metabolic flexibility in rats. Based on our observations, implications can be drawn for mechanistic aspects in
24
the interplay among dietary composition, anabolic resistance and metabolic flexibility during aging. However several limitations need to be acknowledged: fractional synthesis rate was assessed, but not fractional breakdown rate of mixed proteins in the tibialis anterior skeletal muscle for a better understanding of muscle protein turnover. Regarding the discrepancy between DAGs and TAGs in the tibialis anterior muscle, methods other than chromatography could have higher sensitivity to detect DAGs. Finally, we did not assess the proportion of ceramide content in tibialis anterior muscle.
CONCLUSION
Aging is characterized by a reduced muscle weight despite an increased mixed protein fractional synthesis rate, suggesting specific alterations in the nutritional regulation of muscle protein turnover. In isocaloric conditions, higher protein intake modulates muscle lipid infiltration, but does not improve age-related anabolic resistance in old rats fed a high-fat diet.
25 References
1. Buch A, Carmeli E, Boker LK, Marcus Y, Shefer G, Kis O, et al. Muscle function and fat content in relation to sarcopenia, obesity and frailty of old age--An overview. Exp Gerontol. 2016;76:25-32.
2. Waters DL, Baumgartner RN. Sarcopenia and obesity. Clin Geriatr Med. 2011;27:401-21. 3. Poggiogalle E, Migliaccio S, Lenzi A, Donini LM. Treatment of body composition changes in
obese and overweight older adults: insight into the phenotype of sarcopenic obesity. Endocrine. 2014;47:699-716.
4. Poggiogalle E, Lubrano C, Sergi G, Coin A, Gnessi L, Mariani S, Lenzi A, Donini LM. Sarcopenic Obesity and Metabolic Syndrome in Adult Caucasian Subjects. J Nutr Health Aging. 2016;20:958-963.
5. Poggiogalle E, Cherry KE, Su LJ, Kim S, Myers L, Welsh DA, Jazwinski SM, Ravussin E Body Composition, IGF1 Status, and Physical Functionality in Nonagenarians: Implications for Osteosarcopenia. J Am Med Dir Assoc. 2018. pii: S1525-8610(18)30389-X.)
6. Virtue S, Vidal-Puig A. Adipose tissue expandability, lipotoxicity and the Metabolic Syndrome--an allostatic perspective. Biochim Biophys Acta. 2010;1801:338-49.
7. Timmers et al. Proc Natl Acad Sci U S A. 2012; 109: 11711–11716.
8. Tardif N, Salles J, Guillet C, Tordjman J, Reggio S, Landrier JF, et al. Muscle ectopic fat deposition contributes to anabolic resistance in obese sarcopenic old rats through eIF2α activation. Aging Cell. 2014;13:1001-11.
9. Masgrau A, Mishellany-Dutour A, Murakami H, Beaufrère AM, Walrand S, Giraudet C, et al.Time-course changes of muscle protein synthesis associated with obesity-induced lipotoxicity. J Physiol. 2012;590:5199-210.
10. Nadkarni NA, Chaumontet C, Azzout-Marniche D, Piedcoq J, Fromentin G, Tomé D, Even PC.The carbohydrate sensitive rat as a model of obesity. PLoS One. 2013;8:e68436.
11. Azzout-Marniche D, Chaumontet C, Nadkarni NA, Piedcoq J, Fromentin G, Tomé D, Even PC. Food intake and energy expenditure are increased in fat-sensitive but not in high-carbohydrate-sensitive obesity-prone rats. Am J Physiol Regul Integr Comp Physiol. 2014;307:R299-309.
26
12. Bligh EG, Dyer WJ.A rapid method of total lipid extraction and purification. Can J Biochem Physiol. 1959 ;37:911-7.
13. Chanseaume E, Giraudet C, Gryson C, Walrand S, Rousset P, Boirie Y, Morio B. Enhanced muscle mixed and mitochondrial protein synthesis rates after a high-fat or high-sucrose diet. Obesity (Silver Spring). 2007;15:853-9.
14. Guillet C, Prod'homme M, Balage M, Gachon P, Giraudet C, Morin L, Grizard J, Boirie Y. Impaired anabolic response of muscle protein synthesis is associated with S6K1 dysregulation in elderly humans. FASEB J. 2004;18:1586-7.
15. López-Varela S, et al. Food Chem Toxicol. 1995;33:181-9. 16. Livesey G, Elia M. Am J Clin Nutr 1988; 47: 608–628.
17. Even PC, Nadkarni NA. Indirect calorimetry in laboratory mice and rats: principles, practical considerations, interpretation and perspectives. Am J Physiol Regul Integr Comp Physiol 2012;303: R459 –R476.
18. Allison DB, Paultre F, Goran MI, Poehlman ET, Heymsfield SB. Statistical considerations regarding the use of ratios to adjust data. Int J Obes Relat Metab Disord 19: 644–652, 1995. 19. Riachi M, Himms-Hagen J, Harper ME. Percent relative cumulative frequency analysis in indirect calorimetry: application to studies of transgenic mice. Can J Physiol Pharmacol. 2004;82:1075-83.
20. Solon-Biet SM, McMahon AC, Ballard JW, Ruohonen K, Wu LE, Cogger VC, et al. The ratio of macronutrients, not caloric intake, dictates cardiometabolic health, aging, and longevity in ad libitum-fed mice. Cell Metab 2014;19:418-430.
21. Carreiro AL, Dhillon J, Gordon S, Higgins KA, Jacobs AG, McArthur BM, et al. The Macronutrients, Appetite, and Energy Intake. Annu Rev Nutr. 2016;36:73-103.
22. Martens EA, Westerterp-Plantenga MS. Protein diets, body weight loss and weight maintenance. Curr Opin Clin Nutr Metab Care. 2014;17:75-9.
23. Fromentin G, Darcel N, Chaumontet C, Marsset-Baglieri A, Nadkarni N, Tomé D. Peripheral and central mechanisms involved in the control of food intake by dietary amino acids and proteins. Nutr Res Rev. 2012;25:29-39.
24. Lomba A, Martínez JA, García-Díaz DF, Paternain L, Marti A, Campión J, Milagro FI.Weight gain induced by an isocaloric pair-fed high fat diet: a nutriepigenetic study on FASN and NDUFB6 gene promoters. Mol Genet Metab. 2010;101:273-8.
27
25. Boqué N, Campión J, Paternain L, García-Díaz DF, Galarraga M, Portillo MP, et al. Influence of dietary macronutrient composition on adiposity and cellularity of different fat depots in Wistar rats. J Physiol Biochem. 2009;65:387-95.
26. Hariri N, Thibault L.High-fat diet-induced obesity in animal models. Nutr Res Rev. 2010;23:270-99.
27. Miles-Chan JL, Dulloo AG, Schutz Y. Fasting substrate oxidation at rest assessed by indirect calorimetry: is prior dietary macronutrient level and composition a confounder? Int J Obes (Lond). 2015;39:1114-7.
28. Boirie Y, Morio B, Caumon E, Cano NJ. Nutrition and protein energy homeostasis in elderly. Mech Ageing Dev. 2014;136-137:76-84.
29. Chaumontet C, Even PC, Schwarz J, Simonin-Foucault A, Piedcoq J, Fromentin G, et al. High dietary protein decreases fat deposition induced by high-fat and high-sucrose diet in rats.Br J Nutr. 2015;114:1132-42.
30. Akieda-Asai S, Koda S, Sugiyama M, Hasegawa K, Furuya M, Miyazato M, Date Y. Metabolic features of rats resistant to a high-fat diet. Obes Res Clin Pract. 2013;7:e243-50.
31. Ravussin Y, Leibel RL, Ferrante AW Jr. A missing link in body weight homeostasis: the catabolic signal of the overfed state. Cell Metab. 2014;20:565-72.
32. Ravussin Y, Edwin E, Gallop M, Xu L, Bartolomé A, Kraakman MJ, LeDuc CA, Ferrante AW Jr. Evidence for a Non-leptin System that Defends against Weight Gain in Overfeeding. Cell Metab. 2018;28:289-299.e5.
33. Proud CG. Regulation of protein synthesis by insulin. Biochem Soc Trans. 2006;34:213-6. 34. Guillet C, Boirie Y. Insulin resistance: a contributing factor to age-related muscle mass loss?
Diabetes Metab. 2005 ;31:5S20-5S26.
35. Boirie Y. Insulin regulation of mitochondrial proteins and oxidative phosphorylation in human muscle. Trends Endocrinol Metab. 2003;14:393-4.
36. Guerrero-Romero F, Rodríguez-Morán M. Glucose intolerance is predicted by the high Fasting Insulin-to-Glucose ratio. Diabetes & Metabolism 2001; 27; 117.
37. Mosoni L, Valluy MC, Serrurier B, Prugnaud J, Obled C, Guezennec CY, Mirand PP. Altered response of protein synthesis to nutritional state and endurance training in old rats. Am J Physiol. 1995;268:E328-35.
28
38. Vary TC, Jefferson LS, Kimball SR.Amino acid-induced stimulation of translation initiation in rat skeletal muscle. Am J Physiol. 1999 ;277:E1077-86.
39. Garlick PJ, Maltin CA, Baillie AG, Delday MI, Grubb DA. Fiber-type composition of nine rat muscles. II. Relationship to protein turnover. Am J Physiol. 1989;257:E828-32.
40. French WW, Dridi S, Shouse SA, Wu H, Hawley A, Lee SO, Gu X, Baum JI. A High-Protein Diet Reduces Weight Gain, Decreases Food Intake, Decreases Liver Fat Deposition, and
Improves Markers of Muscle Metabolism in Obese Zucker Rats. Nutrients. 2017;9. pii: E587.
41. Lombardi G, Tauchmanova L, Di Somma C, Musella T, Rota F, Savanelli MC, Colao A. Somatopause: dismetabolic and bone effects. J Endocrinol Invest. 2005;28:36-42.
42. Camell CD, Sander J, Spadaro O, Lee A, Nguyen KY, Wing A, et al. Inflammasome-driven catecholamine catabolism in macrophages blunts lipolysis during ageing. Nature. 2017;550:119-123
43. Montgomery MK, Brown SHJ, Mitchell TW, Coster ACF, Cooney GJ, Turner N. Association of muscle lipidomic profile with high-fat diet-induced insulin resistance across five mouse strains. Sci Rep. 2017;7:13914.
44. Manini TM. Energy expenditure and aging. Ageing Res Rev. 2010;9:1-11.
45. Galgani JE, Moro C, Ravussin E. Metabolic flexibility and insulin resistance. Am J Physiol Endocrinol Metab. 2008;295:E1009-17.
46. Westerterp KR. Food quotient, respiratory quotient, and energy balance. Am J Clin Nutr. 1993;57:759S-764.
29 ABBREVIATIONS
STD12: ISOCALORIC (3.9 KCAL/G) STANDARD (NORMAL- PROTEIN) DIET (12% PROTEIN,14% LIPID, AND 74%
CARBOHYDRATE)
STD25: ISOCALORIC (3.9 KCAL/G) STANDARD (HIGH-PROTEIN) DIET :(25% PROTEIN,14% LIPID, AND 61%
CARBOHYDRATE)
HFD12: HYPERCALORIC (4.8 KCAL/G) HIGH-FAT (NORMAL-PROTEIN) DIET :(12% PROTEIN,45% LIPID, AND 43%
CARBOHYDRATE)
HFD25: HYPERCALORIC (4.8 KCAL/G) HIGH-FAT (HIGH-PROTEIN) DIET :(25% PROTEIN,45% LIPID, AND 30%
CARBOHYDRATE)
FM: FAT MASS
FFM: FAT-FREE MASS
FER:FOOD EFFICIENCY RATIO
PER:PROTEIN EFFICIENCY RATIO
TDEE:TOTAL DAILY ENERGY EXPENDITURE
RQ:RESPIRATORY QUOTIENT
FQ:FOOD QUOTIENT
31 TABLES
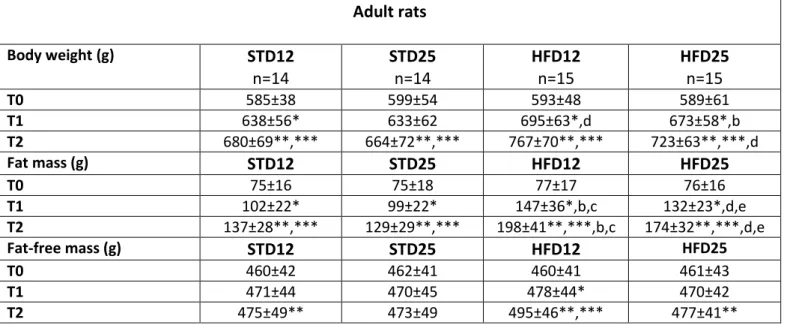
Table 1 Body weight and body composition at baseline (T0), week 5 (T1) and week 10 (T2) in adult rats
Time effect (same diet) p<0.05: *T0 vs. T1; **T0 vs. T2; ***T1 vs. T2.
Diet effect p<0.05 a ST12 vs. ST25, b ST12 vs. HF12, c ST12 vs. HF25, d ST25 vs. HF12, e ST25 vs. HF25, f HF12 vs. HF25. Adult rats Body weight (g) STD12 n=14 STD25 n=14 HFD12 n=15 HFD25 n=15 T0 585±38 599±54 593±48 589±61 T1 638±56* 633±62 695±63*,d 673±58*,b T2 680±69**,*** 664±72**,*** 767±70**,*** 723±63**,***,d Fat mass (g) STD12 STD25 HFD12 HFD25 T0 75±16 75±18 77±17 76±16 T1 102±22* 99±22* 147±36*,b,c 132±23*,d,e T2 137±28**,*** 129±29**,*** 198±41**,***,b,c 174±32**,***,d,e Fat-free mass (g) STD12 STD25 HFD12 HFD25 T0 460±42 462±41 460±41 461±43 T1 471±44 470±45 478±44* 470±42 T2 475±49** 473±49 495±46**,*** 477±41**
32
Table 2 Body weight and body composition at baseline (T0), week 5 (T1) and week 10 (T2) in old rats
Time effect p<0.05: *T0 vs. T1; **T0 vs. T2; ***T1 vs. T2.
Diet (treatment) effect p<0.05 a ST12 vs. ST25, b ST12 vs. HF12, c ST12 vs. HF25, d ST25 vs. HF12, e ST25 vs.
HF25, f HF12 vs. HF25. Old rats Body weight (g) STD12 n=11 STD25 n=11 HFD12 n=10 HFD25 n=9 T0 537±57 530±60 539±65 535±58 T1 589±53* 593±46* 657±35*,b 643±61*,d T2 613±77** 612±43** 689±43** 634±100** Fat mass (g) STD12 STD25 HFD12 HFD25 T0 68±21 68±24 72±28 73±23 T1 100±30* 95±30* 154±40*b,d 155±41*c,e T2 129±48**,*** 103±37**,*** 185±44**,***,b,d 165±50**,c,e Fat-free mass (g) STD12 STD25 HFD12 HFD25 T0 422±39 422±36 426±36 413±31 T1 436±32 455±30* 450±39* 441±39* T2 431±35 458±28** 448±40 411±64***
33 FIGURES
Figure 1 Macronutrient composition of dietary interventions
CHO: carbohydrate
34
35 Figure 3 Study design
1 2
3 4
36 Figure 4 Body weight change
37 Figure 5 Fat mass (FM) change
Time effect (p<0.05) in all diet groups at all time-points regardless of age group § p<0.05 diet effect
38 Figure 6 Fat-free mass (FFM) change
39 Figure 7 Delta-change in fat mass (FM)
* p<0.05 age effect (same diet) § p<0.05 diet effect (same age)
40 Figure 8 Delta-change in fat-free mass (FFM)
* p<0.05 age effect (same diet) § p<0.05 diet effect (same age)
41 Figure 9 Energy intake
42 Figure 10 Energy balance based on energy stored as tissues at Echo-MRI
43 Figure 11 Food Efficiency Ratio and Protein Efficiency Ratio
44 Figure 12 Fractional synthesis rate (FSR): mixed proteins in tibialis anterior muscle
45 Figure 13 Absolute synthesis rate (ASR): mixed proteins in tibialis anterior muscle
46 Figure 14 Intramuscular Triacylglicerols (TAGs) in the tibialis anterior (TA) muscle
* p<0.05 age effect (same diet) § p<0.05 diet effect (same age)
47 Figure 15 Total daily energy expenditure (TDEE) adjusted for fat-free mass (FFM) or active
metabolic mass (metabolic size)
48 Figure 16 Respiratory quotient (RQ)
49 Figure 17 Respiratory Quotient (RQ) vs. Food Quotient (FQ)
50 Figure 18 Metabolic flexibility according to the percent relative cumulative frequency (PRCF) of
24-h respiratory quotient (RQ) in adult rats
HFD25 vs. HFD12; HFD25 vs. STD25; HFD12 vs. STD25; HFD25 vs. STD12; HFD12 vs. STD12: all p values <0.05 0 10 20 30 40 50 60 70 80 90 100 110 0,6 0,7 0,8 0,9 1 1,1 1,2 PRCF (% ) RQ STD12 STD25 HFD12 HFD25
52 SECOND PART: CLINICAL STUDY
The decline in muscle strength and muscle quality in relation to metabolic derangements in adult women with obesity
ABSTRACT
Background & Aims: Sarcopenic obesity is a clinical syndrome described especially in the elderly in
which excess fat and reduced muscularity coexist. The metabolic and functional characteristics related to sarcopenic obesity have not been thoroughly investigated in the early stages of the aging process. The aim of the present study was to investigate the phenotype of sarcopenic obesity- lean body mass, muscle strength and muscle quality in women with and without the Metabolic Syndrome (MetS), and its relationship with the features of myosteatosis.
Methods: Study participants were enrolled at the Sapienza University, Rome, Italy. Body
composition was assessed by DXA. The Handgrip strength test (HGST) was performed. HGST was normalized to arm lean mass to indicate muscle quality; intermuscular adipose tissue (IMAT) and intramyocellular lipid content (IMCL) were measured by magnetic resonance imaging and spectroscopy, as indicators of myosteatosis. Different indices of sarcopenia were calculated, based on appendicular lean mass (ALM, kg) divided by height squared, or weight, or BMI. The NCEP-ATPIII criteria were used to diagnose the MetS. HOMA-IR was calculated. The physical activity level (PAL) was assessed through the IPAQ questionnaire.
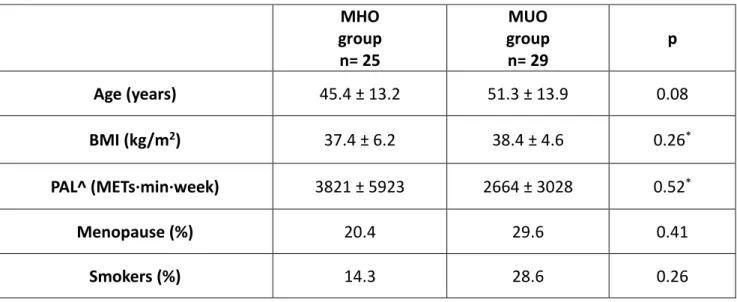
Results: 54 women (age: 48±14 years, BMI: 37.9±5.4 kg/m2 ) were included. 54% had the MetS
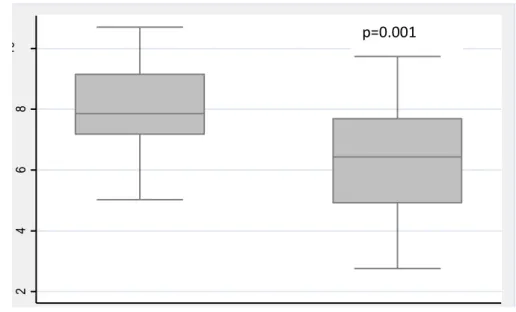
(metabolically unhealthy). HGST/arm lean mass was lower in metabolically unhealthy women than women without the MetS (6.3±1.8 vs. 7.8±1.6, p=0.03). No differences emerged in terms of absolute ALM (kg) or other indices of sarcopenia (ALM/h2 , ALM/weight, or ALM/BMI) between
metabolically healthy vs. unhealthy women (p>0.05). Muscle quality (HGST/arm lean mass) was negatively associated with HOMA-IR (p=0.02), after adjustment for age, body fat, hs-CRP levels, and PAL. IMAT, but not IMCL, was significantly higher in obese women with the MetS compared to women without the MetS (p>0.05). No association emerged between HGST/arm lean mass and IMAT or IMCL when HOMA-IR was included in the models.
53 Conclusion: Insulin resistance, and not myosteatosis per se, may play a role in the decline of
muscle strength, leading to the phenotype of dynapenic obesity. Dynapenia may precede the decline of lean body mass in metabolically unhealthy obese women.
54 BACKGROUND
The onset of dynapenia may precede sarcopenia due to metabolic derangements in adult women with obesity.
In recent years growing interest has been directed to sarcopenic obesity, given the parallel increase of obesity and life expectancy in Western countries (1, 2). Alterations in body compartments are strictly linked to energy imbalance, though multiple factors interfere with energy partitioning and the consequent changes in body composition (e.g. hormone dysregulations, insulin-resistance, inflammation, etc.) (3, 4). Even keeping weight stable, a relatively precocious decline in lean body mass has been reported, starting after the third decade (5, 6).
Concurrently, body fat tends to redistribute from the subcutaneous depots toward the visceral compartment (7). Indeed, the presence of obesity can precipitate and exacerbate the changes in body compartments. However the presence of excess fat and reduced lean mass partially depicts the complex phenotype of sarcopenic obesity: in fact the hallmarks of this syndrome encompass an array of clinical aspects, mainly represented by functional impairment and mobility limitations (8-10). In addition, accumulating evidence pointed out a tight connection between sarcopenia, sarcopenic obesity and metabolic alterations such as the metabolic syndrome (11). Insulin resistance in obese individuals may be responsible for the development of sarcopenia through the interference on protein anabolism and protein breakdown leading to the decrease of lean body mass (12, 13); in turn, reduced skeletal muscle quantity favors insulin resistance, being skeletal muscle the major target tissue of insulin action (14). However, muscle atrophy is only a partial contributor to functional features of sarcopenia, such as weakness, namely dynapenia, and poor functionality and performance (15-17). Muscle quality, defined as strength generated per unit of muscle mass, has been recognized to perform better than absolute muscle strength in predicting global functional capacity (18, 19). Notably, Newman et al. demonstrated that muscle strength represents a robust predictor of mortality in older individuals, regardless of low lean mass (20). Importantly, due to its easiness of measurement in the clinical setting, grip strength was validated against leg strength, with analogous and overlapping predictive ability for mortality risk (20). Furthermore, based on previous studies including elderly participants, age-related fat infiltration within skeletal muscle affects muscle contractility and strength generation (21-23). On the other
55
hand, just few studies examined the connection between ectopic lipid storage within myocytes (based on muscle biopsy or magnetic resonance spectroscopy) and strength (24, 25).
The majority of studies investigating metabolic and functional correlates of sarcopenia and sarcopenic obesity were conducted in the geriatric population, whereas evidence is scarce regarding the adult population.
Thus, the aims of the present study were: to investigate the presence of the phenotypic aspects of sarcopenia, in terms of muscle quantity: reduced skeletal muscle mass (whole body level and segmental level), and muscle quality: reduced muscle strength (dynapenia), and to examine the relationship between muscle strength, muscle quality and features of myosteatosis (ectopic fat storage in skeletal muscle as intermuscular adipose tissue, “IMAT”, that is adipose tissue beneath the muscle fascia and between muscle groups, and lipid droplet deposition in myocytes as intramyocellular lipid content “IMCL”) in metabolically healthy (MHO) and metabolically unhealthy (MUO) adult women with obesity.