To cite: Bianco F, Cicchitti V, Bucciarelli V, et al. Intraventricular flow patterns during right ventricular apical pacing. Open Heart
2019;6:e001057. doi:10.1136/
openhrt-2019-001057 FB and VC contributed equally. Received 25 March 2019 Revised 7 April 2019 Accepted 14 April 2019
1Institute of Cardiology, “G. d’Annunzio” University, Chieti, Italy
2Brigham and Women's Hospital, Boston, Massachusetts, USA 3Department of Cardiology, “S.S. Annunziata” Hospital, Chieti, Italy
4Department of Engineering and Architecture, University of Trieste, Trieste, Italy 5Institute of Cardiology, University of L’Aquila, L’Aquila, Italy
Correspondence to
Dr Francesco Bianco; dr. francescobianco@ gmail. com
Intraventricular flow patterns during
right ventricular apical pacing
Francesco Bianco, 1,2 Vincenzo Cicchitti,1 Valentina Bucciarelli,1 Alvin Chandra,2 Enrico Di Girolamo,3 Gianni Pedrizzetti,4 Gianni Tonti,1 Silvio Romano,5
Raffaele De Caterina,1 Sabina Gallina1
© Author(s) (or their employer(s)) 2019. Re-use permitted under CC BY-NC. No commercial re-use. See rights and permissions. Published by BMJ.
Key questions
What is already known about this subject?
► In patients receiving permanent cardiac electrical
stimulation, a high burden of right ventricular apical pacing is associated with an increased incidence of left ventricular dysfunction, mechanisms of which are not fully understood.
What does this study add?
► This study has the potential to yield new insight
and understanding of the pathophysiology of heart failure in dyssynchrony conditions: the consequent changes in blood flow motion and pressure gradi-ents seem to contribute to energy dissipation, in-creasing cardiac walls shear stress.
How might this impact on clinical practice?
► An in-depth study of intraventricular fluid dynamics
is a new powerful tool for a complete pathophysi-ological understanding of mechanisms involved in pacing-related heart failure.
AbstrAct
Objectives To assess differences in blood flow momentum (BFM) and kinetic energy (KE) dissipation in a model of cardiac dyssynchrony induced by electrical right ventricular apical (RVA) stimulation compared with spontaneous sinus rhythm.
Methods We cross-sectionally enrolled 12 consecutive patients (mean age 74±8 years, 60% male, mean left ventricular ejection fraction 58%±6 %), within 48 hours from pacemaker (PMK) implantation. Inclusion criteria were: age>18 years, no PMK-dependency, sinus rhythm with a spontaneous narrow QRS at the ECG, preserved ejection fraction (>50%) and a low percentage of PMK-stimulation (<20%). All the participants underwent a complete echocardiographic evaluation, including left ventricular strain analysis and particle image velocimetry. Results Compared with sinus rhythm, BFM shifted from 27±3.3 to 34±7.6° (p=0.016), while RVA-pacing was characterised by a 35% of increment in KE dissipation, during diastole (p=0.043) and 32% during systole (p=0.016). In the same conditions, left ventricle global longitudinal strain (LV GLS) significantly decreased from 17±3.3 to 11%±2.8% (p=0.004) during RVA-stimulation. At the multivariable analysis, BFM and diastolic KE dissipation were significantly associated with LV GLS deterioration (Beta Coeff.=0.54, 95% CI 0.07 to 1.00, p=0.034 and Beta Coeff.=0.29, 95% CI 0.02 to 0.57, p=0.049, respectively).
Conclusions In RVA-stimulation, BFM impairment and KE dissipation were found to be significantly associated with LV GLS deterioration, when controlling for potential confounders. Such changes may favour the onset of cardiac remodelling and sustain heart failure.
IntROduCtIOn
Pacing-induced ventricular dysfunction, also termed pacing cardiomyopathy, usually refers to the manifestations of a significantly decreased left ventricular (LV) systolic func-tion ascribable to the right ventricular apical (RVA) pacing.1 The prevalence of this
condi-tion varies from 9% at 1 year2 and up to 15%
at 25 years,3 depending on the definitions
used by authors. Due to the lack of definite recommendations about the optimal site for pacemaker (PMK) lead positioning, over
time the RVA-stimulation has been the most frequently adopted.1
Alternative pacing sites, such as the right ventricular septum or right ventricular outflow tract, have been less implemented.4
However, the clinical disadvantages of the ‘apical approach’ for antibradycardia pacing therapies have been debated over the years.5 6
The recent 2018 ACC/AHA/HRS Guide-lines, on the Evaluation and Management of Patients With Bradycardia and Cardiac Conduction Delay, recommend in patients with a LV ejection fraction (EF) (between 36% and 50%) and atrioventricular block, who have an indication for permanent pacing and are expected to require ventricular pacing >40% of the time, pacing techniques that provide more physiologic ventricular activa-tion (ie, cardiac resynchronisaactiva-tion therapy (CRT) or His bundle pacing), instead of RVA-pacing, to prevent heart failure (HF).7
Despite such recommendations, a compre-hensive pathophysiological understanding of
on September 24, 2019 by guest. Protected by copyright.
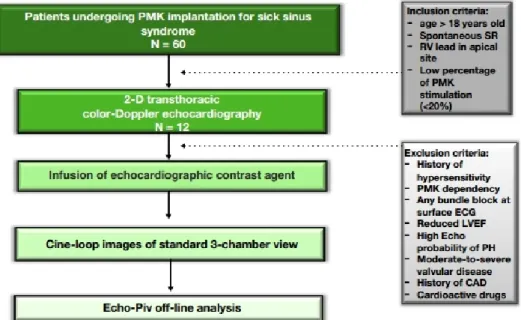
Figure 1 An outline of the study protocol. CAD, coronary artery disease; EF, ejection fraction; LV, left ventricle; PH, pulmonary hypertension; PMK, pacemaker; RV, right ventricle; SR, sinus rhythm.
RVA pacing-induced LV dysfunction is not yet currently available.4
Evidence has shown that specific patient popula-tions may experience adverse effects with conventional RVA-pacing,8 even after implementing various algorithms
to reduce unnecessary ventricular pacing.9 Conversely, it
has been recently suggested that RVA-pacing may produce alterations in LV endocavitary blood flow motion,1 linking
intraventricular flow patterns with LV dyssynchrony as a way to understand the pathophysiology of pacing
cardio-myopathy. Flow patterns have also been able to guide the
resynchronisation therapy,10 proposing a potential link
with the conditions mentioned above.
We aimed at this background at characterising and quantifying LV blood flow (BF) differences in structur-ally normal hearts, during spontaneous sinus rhythm and RVA-pacing, a model of cardiac dyssynchrony induced by electrical stimulation. For our purposes, we used the echo-cardiographic particle imaging velocimetry (Echo-PIV): a relatively new echocardiographic emerging imaging tech-nique, which allows intraventricular fluid dynamics eval-uation and vorticity characterisation concerning blood flow momentum (BFM) and consequent kinetic energy (KE) dissipation.
MetHOds study population
We studied 60 patients in our Arrhythmology Depart-ment over a period of 6 months. All patients undergoing a PMK implantation due to sick sinus syndrome were considered eligible and evaluated within 48 hours after the implantation.
Inclusion criteria were: age>18 years, no-PMK depen-dency, baseline sinus rhythm and spontaneous narrow QRS complexes at the surface 12-leads-ECG; preserved
EF (>50%) and a positioned apical right ventricular lead. A low percentage of ventricular stimulation (<20%) was also considered, in order to avoid any phenomenon of myocardial electrical memory.
Exclusion criteria were PMK dependency, any form of known allergy or prior adverse reactions to sonographic contrast agents or high echocardiographic probability of pulmonary arterial hypertension; any valvular disease from moderate-to-severe, history of coronary artery disease (previous acute myocardial infarction or chronic ischaemic heart disease) and treatment with drugs modulating the heart systolic function (ie, beta-blockers, calcium antagonists or amiodarone).
No selection was made about either the PMK brand or model or the catheters type.
Accordingly, 22 patients were excluded due to concom-itant ischaemic or valvular heart disease; 16 were treated with cardioactive medications and 5 had a left/right bundle branch block on surface ECG. Three patients had poor acoustic windows, while two had a pacing-time >20% within 48 hours after implant. Thus, 12 patients constituted the final sample.
The local Ethics Committee approved the study protocol, and all participants provided written informed consent before enrolment.
Image acquisition and pacing protocols
Figure 1 summarises the acquisition protocol for echo-cardiographic images.
All the examinations were conducted with a standard commercial ultrasound machine (Esaote MyLab30 Gold), provided with the Contrast Tuned Imaging (CnTI) software, and a phased array 3.5 MHz cardiac probe. For each participant were collected general echo-cardiographic characteristics regarding cardiac chambers
on September 24, 2019 by guest. Protected by copyright.
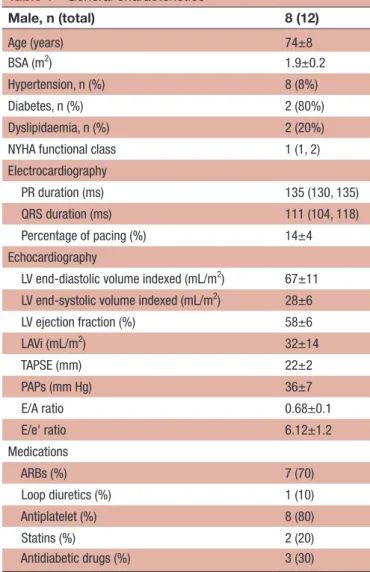
Table 1 General characteristics Male, n (total) 8 (12) Age (years) 74±8 BSA (m2) 1.9±0.2 Hypertension, n (%) 8 (8%) Diabetes, n (%) 2 (80%) Dyslipidaemia, n (%) 2 (20%)
NYHA functional class 1 (1, 2)
Electrocardiography
PR duration (ms) 135 (130, 135)
QRS duration (ms) 111 (104, 118)
Percentage of pacing (%) 14±4
Echocardiography
LV end-diastolic volume indexed (mL/m2) 67±11
LV end-systolic volume indexed (mL/m2) 28±6
LV ejection fraction (%) 58±6 LAVi (mL/m2) 32±14 TAPSE (mm) 22±2 PAPs (mm Hg) 36±7 E/A ratio 0.68±0.1 E/e' ratio 6.12±1.2 Medications ARBs (%) 7 (70) Loop diuretics (%) 1 (10) Antiplatelet (%) 8 (80) Statins (%) 2 (20) Antidiabetic drugs (%) 3 (30)
Data are described as mean (±SD) or median (IQR) for quantitative variables, and counts (proportions) for categorical variables. ARBs, angiotensin receptors blockers; BSA, body surface area; EF, ejection fraction; LAVi, left atrial volume index; LV, left ventricle; PAPs, systolic pulmonary arterial pressure ; TAPSE, tricuspid annular plane systolic excursion.
volumes, and function, including diastolic function and LV global longitudinal strain analysis (GLS), according to the recommendations from the European Association of Cardiovascular Imaging (EACVI) guidelines.11
Our protocol included a 2 mL intravenous injection of a sonographic contrast agent (SonoVueTM, Bracco Inter-national, Amsterdam) administered through an 18–20-gauge intravenous catheter to avoid any fluid turbulence and the resulting contrast microbubble disruption. In order to visualise and quantify the patterns of BF motion from the LV inlet to the outflow, intraventricular flow images were acquired from the apical three-chamber view. All the movie clips were obtained during sponta-neous sinus rhythm and subsequently during RVA-pacing. For each patient, the minimum frequency of stimula-tion was used to induce the RVA-rhythm with a pacing stimulation in DDD mode, with sensed atrium and paced ventricle, in order to avoid any atrioventricular dyssynchrony.
echo-PIV image analysis
All the movie clips were analysed offline using the Echo-PIV technique. For this purpose, we used the already validated HyperFlow (AMID, LTD) software for Micro-soft Windows.12–14 The HyperFlow Echo-PIV method
allows depicting and quantifying intracardiac flow paths, and the software can track the microbubbles and deter-mine the relative instantaneous two-dimensional velocity vector. Using the Navier-Stokes equation, it is possible to derive several physical quantities: two-dimensional pres-sure gradient, BFM, geometrical parameters of diastolic vorticity and energetic indexes, as the KE-dissipation.14
statistical analysis
At the best of our knowledge, the largest study that evalu-ated by means of Echo-PIV the effects of PMK stimulation enrolled 11 participants10; we enrolled 12 participants,
and in both cases patients were at the same time case and controls, thus reducing the need for a more numerous sample.
All categorical variables were expressed as percent-ages, while continuous as mean and ±SD or median and IQR, as appropriate. For statistical processing and following previous studies,12–14 the variables were
dimen-sionless and expressed in modules when analysed. Abso-lute changes for Echo-PIV variables were obtained by subtracting the RVA-pacing to the sinus rhythm value; those were subsequently normalised for the sinus rhythm value ((RVA-pacing-sinus rhythm)/sinus rhythm). Differ-ences in continuous variables were assessed through Student’s t-test, while χ² for categorical.
A multivariable linear regression model was used to assess the Beta coefficients (Beta Coeff.) for changes in LV GLS between sinus rhythm and RVA-pacing. Model 1 was non-adjusted, while Model 2 was adjusted for PMK-in-duced heart-rate. Due to the small sample size, models were tested only for BFM, KE systolic/diastolic dissi-pation and LV end-systolic volume, and they should be
considered as explorative for our hypothesis. According to the Kolmogorov-Smirnov test, variables not normally distributed were logarithmically transformed before entering the multivariable analysis. The interaction terms in regression analysis were also tested for KE dissipation, both systolic and diastolic, and BFM.
A two-tailed p value of 0.05 was considered statistically significant. All statistical analyses were performed with Stata V.14.1 (Stata, College Station, Texas, USA).
Results
General characteristics
A total of 12 participants (mean age 74±8 years, 60% male) were studied. General characteristics of the partic-ipants are presented in table 1.
The median QRS duration was 111 ms (IQR, IQR, 115–120); the median PR duration was 135 ms (IQR, 130–135). Most (8/12) had systemic arterial hypertension,
on September 24, 2019 by guest. Protected by copyright.
Table 2 Echocardiographic and Echo-PIV differences according to pacing models
Echocardiography
Sinus
rhythm RVA-pacing P value
Heart rate (bpm) 62±5 67±11 0.29 LV end-diastolic volume (mL/ m2) 67±12 68±11 0.12 LV end-systolic volume (mL/ m2) 28±6 29±6 0.039 LV ejection fraction (%) 58±6 56±6 0.042 LV GLS (%) 17±3.3 11±2.8 0.004 Echo-PIV KE-dissipation, diastolic (mJ) 8.35±6.7 11.26±8.7 0.043 KE-dissipation, systolic (mJ) 7.11±3.5 9.43±5.3 0.016
Blood flow momentum (°) 27.47±3.3 34.43±7.6 0.016
EF, ejection fraction; Echo-PIV, echocardiographic particle image velocimetry; GLS, global longitudinal strain; KE, kinetic energy; LV, left ventricle; RVA, right ventricular apical.
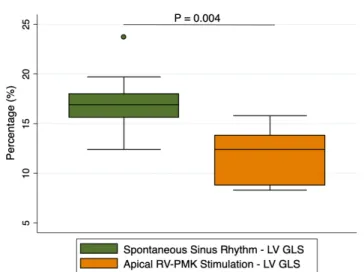
Figure 2 GLS variations during sinus rhythm and RVA-pacing. GLS, global longitudinal strain; LV, left ventricle; PMK, pacemaker.
mainly treated with angiotensin receptors blockers and in therapy with antiplatelet agents, for primary cardiovas-cular prevention. Two subjects had type 2 diabetes; only one was treated with loop diuretics.
The mean EF was 58%±6%, while the mean tricuspid annular plane systolic excursion was 22±2 mm. Doppler-derived diastolic parameters were found between the normal ranges, considering the age of study participants (mean E/A 0.68±0.11, E/e’ 6.12±1.2). echocardiographic and global longitudinal strain analysis Echocardiographic differences between sinus and RVA-pacing are shown in table 2.
LV end-systolic volume indexed was slightly higher during RVA-pacing (28±6 to 29±6, p=0.039); conse-quently, LV ejection fraction resulted diminished when participants were RVA-paced (58±6 to 56±6, p=0.042). On the other hand, LV GLS significantly decreased from sinus rhythm to RVA-pacing, from 17±3.3 % to 11±2.8 %(p=0.004) (figure 2) .
No other differences were found regarding echocar-diographic parameters.
Blood flow analysis
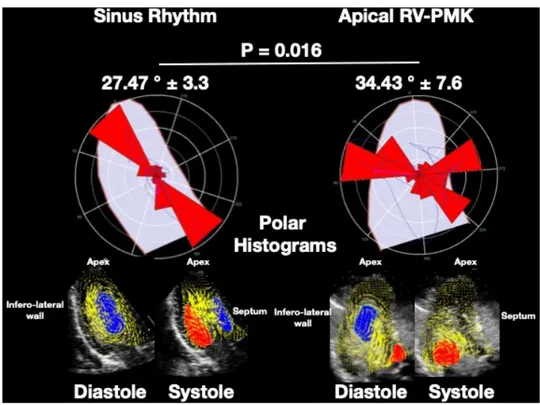
A first substantial macroscopic difference was observed between BF models: spontaneous sinus rhythm and RVA-pacing (figure 3).
During sinus rhythm, the formation of a vortex beneath the mitral annulus was documented in LV-diastole; it was functionally directed to the apex of the heart, in a base-to-apex direction. In systole, the flux was directed by the vortex to the LV outflow tract, in an apex-to-out-flow path. The vortex motion pathways determined a very small angle with the imaginary line crossing the LV long axis. On the contrary, in PMK-model, there was a dysfunc-tional BF, resulting in multiple vortices formation, with a distribution of flow forces no longer physiologically
directed in an apex-to-base direction, but towards the ventricular walls, determining a wider motion angle with LV long axis.
According to the macroscopic BF-changes in flux direction, BFM shifted from an angle of 27.47±3.3° to 34.43±7.6° (p=0.016), while due to the higher turbulence generated by the disturbance in the normal dynamics of diastolic vorticity, the KE-dissipation increased up to 35% during diastole, from 8.35±6.7 mJ to 11.26±8.7 mJ (p=0.043).(figure 4)
The KE-dissipation absolute change from the PMK-off to the PMK-on status was 3 mJ. The systolic KE-dissipation went up to 32.6%, from 7.11±3.3 to 9.43±5.3 (p=0.016),(-figure 4) respectively, with an absolute change from the PM-off to the PM-on status by 2.3 mJ.
Cardiac predictors of left ventricle global longitudinal strain impairment
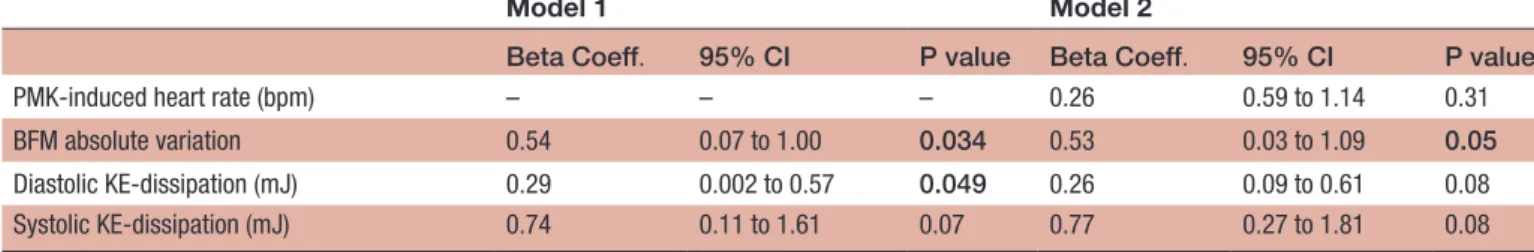
At the multivariable analysis (table 3), BFM and diastolic KE dissipation were independently associated with LV GLS impairment (Beta Coeff.=0.54, 95% CI (0.07, 1.00), p=0.034 and Beta Coeff.=0.29, 95% CI 0.002 to 0.57, p=0.049, respectively), even when adjusted for PMK-in-duced heart rate (Beta Coeff.=0.53, 95% CI 0.03 to 1.09, p=0.05).
In addition, a significant interaction was found between diastolic KE dissipation and BFM (Beta Coeff.=−1.55, 95% CI −3.21 to 0.98, p=0.05), but not with systolic KE dissipa-tion (Beta Coeff.=−1.53, 95% CI −3.62 to 0.55, p=0.10).
In this way, for any given increment of LV GLS, it was estimated an absolute decrement of 0.54 total BFM vari-ation, accompanied by a reduction in diastolic KE dissi-pation of 0.29 mJ. In other words, and according to our explorative model, the wider the angle, more transverse the direction of the forces (more lateral), the more the KE dissipation and the GLS impairment; on the contrary, a narrow-angle (smaller BFM) determined less KE dissi-pation and better LV GLS.
on September 24, 2019 by guest. Protected by copyright.
Figure 4 Histograms of KE variations during sinus rhythm and RVA-pacing. KE, kinetic energy; PMK, pacemaker; RV, right ventricle.
Figure 3 Examples of Echo-PIV derived polar histograms during sinus rhythm and RVA-pacing. The directional distribution of global momentum during the entire heart cycle is summarised regarding a polar histograms. This polar image gives a synthetic picture of the overall haemodynamic velocities associated with intraventricular blood flow motion identifying whether they are aligned along the base-apex direction (left) or they develop non-physiological transversal components (right). The parameter ‘blood flow momentum’ indicates the dominant orientation of the haemodynamic velocities (diastole and systole). During RVA-pacing there is an irregular vortex formation with local stagnation resulting in transversal velocities forces and loss of the physiological longitudinal orientation of the intraventricular velocities. Echo-PIV, echocardiographic particle velocity imaging; RVA, right ventricular apical.
dIsCussIOn
The present study provides for the first time a detailed anal-ysis of LV flow patterns during spontaneous sinus rhythm and RVA-pacing in structurally normal hearts. First of all, we measured a significant BFM shift, regarding the orien-tation of forces, from a physiological to a frankly patho-logical direction during RVA-stimulation. Remarkably,
the presence of multiple dysfunctional vortexes, instead of a single functional one, accompanied these changes. Contextually, we measured an increased KE-dissipation during RVA-pacing. LV GLS showed a significant decre-ment when participants were RVA-paced, while the total BFM variation and the increment in diastolic KE dissi-pation, determined by RVA-pacing, were independently correlated with this LV GLS deterioration, even when adjusted for PMK-induced heart rate.
It is demonstrated that, when contracting in synchrony, myocardial walls lead to the formation of a LV vortex during diastole.14 This process permits a correct and
functional LV BF motion through the LV outflow tract and the aorta, minimising the KE dissipation.15 On the
contrary, PMK-induced dyssynchrony, especially during RVA-pacing, determines a biphasic electromechanical activation. It results in premature activation of a large portion of the interventricular septum, and the right ventricle (RV) outflow septal portion.16 In such
condi-tions, the LV free wall significantly delays its shortening, with the development of significant interventricular and intraventricular dyssynchrony and reduced contraction/ shortening.17
The stretching of myocardial fibres elicits local Frank-Starling mechanisms, which further delay the short-ening of late-activated LV regions and impose a systolic
on September 24, 2019 by guest. Protected by copyright.
Table 3 Echo-PIV correlates of left ventricle GLS impairment
Model 1 Model 2
Beta Coeff. 95% CI P value Beta Coeff. 95% CI P value
PMK-induced heart rate (bpm) – – – 0.26 0.59 to 1.14 0.31
BFM absolute variation 0.54 0.07 to 1.00 0.034 0.53 0.03 to 1.09 0.05
Diastolic KE-dissipation (mJ) 0.29 0.002 to 0.57 0.049 0.26 0.09 to 0.61 0.08
Systolic KE-dissipation (mJ) 0.74 0.11 to 1.61 0.07 0.77 0.27 to 1.81 0.08
Multivariable linear regression models. Models were tested for BFM diastolic/systolic KE dissipation and LV end-systolic volume. Model 1 is non-adjusted. Model 2 was adjusted for PMK-induced heart rate.
BFM, blood flow momentum; Coeff., coefficient; Conf., confidence; Echo-PIV, echocardiographic particle image velocimetry; GLS, global longitudinal strain; KE, kinetic energy; LV, left ventricle; PMK, pacemaker; bpm, beats per minute.
stretch to early-activated ones.16 The RV/LV or LV alone
dyssynchrony, as we demonstrated, produces multiple and dysfunctional LV intracavitary vortexes, a BFM shift, towards the septum and lateral walls, and a higher systolic and diastolic KE-dissipation, independently from heart rate.
LV GLS is a measure that assesses the degree of defor-mation for any studied cardiac segment and therefore is expressed as a percentage value.11 Within the LV
longitu-dinal function, decreased values of GLS are indicative of a reduced shortening/compression of the studied object; on the contrary, incremented values prove a myocardial extension or expansion of LV chambers.11
We exploratively proved in this study a tight correla-tion between BFM and diastolic KE dissipacorrela-tion with LV GLS impairment (reduced shortening/compression), with an interaction term between diastolic KE dissipation and BFM towards LV GLS decrement; these data suggest a potential pathophysiological mechanism of wall stress and BF sheering. In other words, diastole prepares the systole, preventing KE dissipation. If dyssynchrony alters this process, it may potentially enhance cardiac inflam-mation, amplify matrix metalloproteinase expression and increase their activity through a macrophage-medi-ated activation process.18 If not physiologically restored,
a wide BFM and augmented KE dissipation, in the pres-ence of cardiac wall dyssynchrony, may lead over time to LV remodelling and HF.1 18
Pathophysiological implications
The study of average LV BF has the potential to yield new insight and understanding of the pathophysiology of HF in dyssynchrony conditions. In human hearts, altered BF patterns, associated with abnormal stretching and contrac-tion of LV walls, may lead to myocardial remodelling. In fact, the consequent changes in BFM and pressure gradi-ents may contribute to energy dissipation, increasing the LV walls shear stress. The latter combination, as seen in animal models, is also associated with increased levels of natriuretic peptides,19 and may lead to, and sustain,
a slow and subclinical myocardial remodelling, involving local inflammation and metalloproteinase activation.20
These experimental interpretations, combined with data from observational studies, support the concept that
dyssynchrony is associated with an increased incidence of HF. The investigators of the Mode Selection Trial (MoST), in a dedicated substudy, established a causal link between a high burden of ventricular pacing and HF hospital-isations.5 These observations suggest the occurrence of
several mechanisms, not yet understood entirely,1 but
partially quantifiable using the Echo-PIV flow assessment. BF dysfunctional patterns are also modified by effec-tive CRT, hinting at potential, new and functional rela-tions between BF patterns and dyssynchrony.10 To date,
the prognostic role of Echo-PIV is not yet established and need further investigations to be defined, but Echo-PIV may currently target a specific HF drug therapy response or CRT multipacing optimisation.
limitations
The most important limitation of our study is the small population observed. Even if following the previous liter-ature, our results need to be confirmed in larger and more varied cohorts. Also, strict precautions were taken in scanning both the mitral and the aortic valve in the same plane, considered approximately representative of the main BF properties. Nevertheless, the possibility of missing important three-dimensional (3D) flow features remains. However, the relatively low frame rate of 3D-echo imaging to date does not allow precise and accurate analysis of LV flow dynamics, compared with 2D imaging, that we used.
On the other hand, the strength of our study was to enrol a very selected population, thus reducing as much as possible the influence of confounding factors. In addi-tion, the analysis was repeated on the same subject during sinus rhythm and RVA-pacing considerably minimising the need for a bigger sample size.
COnClusIOn
In a small cohort of high selected structural normal hearts, undergoing a PMK implantation due to sick sinus syndrome, markers of LV BF impairment, induced by elec-trical RVA-stimulation, were found to be significantly asso-ciated with LV GLS impairment, even when controlling for potential confounders. These observations suggest a crucial role of BFM, assessed by means of Echo-PIV, in BF dysfunctional patterns characterisation. In the presence
on September 24, 2019 by guest. Protected by copyright.
of PMK-induced dyssynchrony, KE dissipation seems to be markedly increased as a consequence of BFM shift, from functional to dysfunctional BF patterns. If confirmed by similar future analyses, serial monitoring of BFM changes over time might allow quantitative information on LV pump efficiency, drive HF drug therapy and guide CRT optimisation.
Acknowledgements Special thanks to Marziale Marchetti, M.D., Francesco Radico, M.D. and Manuel Conti, M.D. for their help in data acquisition.
Collaborators Marziale Marchetti; Francesco Radico; Manuel Conti.
Contributors FB and VC designed the study and drafted the manuscript. FB performed the statistical analysis. VB and AC revised the manuscript and contributed to the analysis and interpretation of the data. EDG contributed to clinical evaluation and support to the recruitment of patients. GP and GT were involved in critical revision and data interpretation. RDC, SR and SG revised the final manuscript and supported the study design.
Funding This research received no specific grant from any funding agency in the public, commercial or not-for-profit sectors.
Competing interests None declared.
Provenance and peer review Not commissioned; externally peer reviewed.
data availability statement All data relevant to the study are included in the article or uploaded as supplementary information.
Open access This is an open access article distributed in accordance with the Creative Commons Attribution Non Commercial (CC BY-NC 4.0) license, which permits others to distribute, remix, adapt, build upon this work non-commercially, and license their derivative works on different terms, provided the original work is properly cited, appropriate credit is given, any changes made indicated, and the use is non-commercial. See: http:// creativecommons. org/ licenses/ by- nc/ 4. 0/.
RefeRences
1. Cicchitti V, Radico F, Bianco F, et al. Heart failure due to right ventricular apical pacing: the importance of flow patterns. Europace
2016;18:1679–88.
2. Yu C-M, Chan JY-S, Zhang Q, et al. Biventricular pacing in patients with bradycardia and normal ejection fraction. N Engl J Med
2009;361:2123–34.
3. Dreger H, Maethner K, Bondke H, et al. Pacing-induced
cardiomyopathy in patients with right ventricular stimulation for >15 years. Europace 2012;14:238–42.
4. Slotwiner DJ, Raitt MH, Del-Carpio Munoz F, et al. Impact of physiologic pacing versus right ventricular pacing among patients with left ventricular ejection Fraction greater than 35%: A Systematic review for the 2018 acc/aha/hrs guideline on the evaluation and management of patients with bradycardia and cardiac conduction delay. Journal of the American College of Cardiology 2018. 5. Sweeney MO, Hellkamp AS, Ellenbogen KA, et al. Adverse effect
of ventricular pacing on heart failure and atrial fibrillation among
patients with normal baseline QRS duration in a clinical trial of pacemaker therapy for sinus node dysfunction. Circulation
2003;107:2932–7.
6. Wilkoff BL, Cook JR, Epstein AE, et al. Dual-chamber pacing or ventricular backup pacing in patients with an implantable defibrillator: the dual chamber and VVI implantable defibrillator (David) trial. JAMA 2002;288:3115–23.
7. Kusumoto FM, Schoenfeld MH, Barrett C, et al. Acc/aha/hrs guideline on the evaluation and management of patients with bradycardia and cardiac conduction delay: A report of the american college of cardiology/american heart association task force on clinical practice guidelines and the heart rhythm society. Journal of the American College of Cardiology 2018;2018.
8. O'Keefe JH, Abuissa H, Jones PG, et al. Effect of chronic right ventricular apical pacing on left ventricular function. The American Journal of Cardiology 2005;95:771–3.
9. Nielsen JC, Andersen HR, Thomsen PEB, et al. Heart failure and echocardiographic changes during long-term follow-up of patients with Sick sinus syndrome randomized to single-chamber atrial or ventricular pacing. Circulation 1998;97:987–95.
10. Siciliano M, Migliore F, Badano L, et al. Cardiac resynchronization therapy by multipoint pacing improves response of left ventricular mechanics and fluid dynamics: a three-dimensional and particle image velocimetry echo study. Europace 2017;19:1833–40.
11. Lang RM, Badano LP, Mor-Avi V, et al. Recommendations for cardiac chamber quantification by echocardiography in adults: an update from the American Society of echocardiography and the European association of cardiovascular imaging. Eur Heart J Cardiovasc Imaging 2015;16:233–71.
12. Hong G-R, Pedrizzetti G, Tonti G, et al. Characterization and quantification of vortex flow in the human left ventricle by contrast echocardiography using vector Particle image velocimetry. JACC Cardiovasc Imaging 2008;1:705–17.
13. Kheradvar A, Houle H, Pedrizzetti G, et al. Echocardiographic Particle image velocimetry: a novel technique for quantification of left ventricular blood vorticity pattern. Journal of the American Society of Echocardiography 2010;23:86–94.
14. Cimino S, Pedrizzetti G, Tonti G, et al. In vivo analysis of
intraventricular fluid dynamics in healthy hearts. European Journal of Mechanics - B/Fluids 2012;35:40–6.
15. Kanski M, Arvidsson PM, Töger J, et al. Left ventricular fluid kinetic energy time curves in heart failure from cardiovascular magnetic resonance 4D flow data. J Cardiovasc Magn Reson 2015;17. 16. Wyman BT, Hunter WC, Prinzen FW, et al. Effects of single- and
biventricular pacing on temporal and spatial dynamics of ventricular contraction. American Journal of Physiology-Heart and Circulatory Physiology 2002;282:H372–H379.
17. Prinzen FW, Peschar M. Relation between the pacing induced sequence of activation and left ventricular pump function in animals.
Pacing Clin Electrophysiol 2002;25:484–98.
18. Ahmed FZ, Khattar RS, Zaidi AM, et al. Pacing-induced cardiomyopathy: pathophysiological insights through matrix metalloproteinases. Heart failure reviews 2013.
19. Moe GW, Grima EA, Wong NL, et al. Dual natriuretic peptide system in experimental heart failure. J Am Coll Cardiol 1993;22:891–8. 20. Pasipoularides A. Diastolic filling vortex forces and cardiac
adaptations: probing the epigenetic nexus. Hellenic J Cardiol
2012;53:458–69.
on September 24, 2019 by guest. Protected by copyright.