2016
Publication Year
2020-06-29T09:26:53Z
Acceptance in OA@INAF
ALMA Spectroscopic Survey in the Hubble Ultra Deep Field: The Infrared Excess
of UV-Selected z = 2-10 Galaxies as a Function of UV-Continuum Slope and
Stellar Mass
Title
Bouwens, Rychard J.; Aravena, Manuel; DECARLI, ROBERTO; Walter, Fabian;
Labbé, Ivo; et al.
Authors
10.3847/1538-4357/833/1/72
DOI
http://hdl.handle.net/20.500.12386/26255
Handle
THE ASTROPHYSICAL JOURNAL
Journal
833
ALMA SPECTROSCOPIC SURVEY IN THE HUBBLE ULTRA DEEP FIELD: THE INFRARED EXCESS OF
UV-SELECTED z
=2–10 GALAXIES AS A FUNCTION OF UV-CONTINUUM SLOPE AND STELLAR MASS
Rychard J. Bouwens1, Manuel Aravena2, Roberto Decarli3, Fabian Walter3,4,5, Elisabete da Cunha6,7, Ivo Labbé1, Franz E. Bauer8,9,10, Frank Bertoldi11, Chris Carilli5,12, Scott Chapman13, Emanuele Daddi14, Jacqueline Hodge1,
Rob J. Ivison15,16, Alex Karim11, Olivier Le Fevre17, Benjamin Magnelli11, Kazuaki Ota12, Dominik Riechers18, Ian R. Smail19, Paul van der Werf1, Axel Weiss11, Pierre Cox20, David Elbaz14, Jorge Gonzalez-Lopez8,
Leopoldo Infante8, Pascal Oesch21, Jeff Wagg22, and Steve Wilkins23 1
Leiden Observatory, Leiden University, NL-2300 RA Leiden, Netherlands 2
Núcleo de Astronomía, Facultad de Ingeniería, Universidad Diego Portales, Av. Ejército 441, Santiago, Chile 3
Max-Planck Institut für Astronomie, Königstuhl 17, D-69117, Heidelberg, Germany 4
Astronomy Department, California Institute of Technology, MC105-24, Pasadena, CA 91125, USA 5
NRAO, Pete V. Domenici Array Science Center, P.O. Box O, Socorro, NM 87801, USA 6
Centre for Astrophysics and Supercomputing, Swinburne University of Technology, Hawthorn, Victoria 3122, Australia 7
Research School of Astronomy and Astrophysics, Australian National University, Canberra, ACT 2611, Australia 8Instituto de Astrofísica, Facultad de Física, Pontificia Universidad Católica de Chile, Casilla 306, Santiago 22, Chile
9
Millennium Institute of Astrophysics(MAS), Nuncio Monseñor Sótero Sanz 100, Providencia, Santiago, Chile 10Space Science Institute, 4750 Walnut Street, Suite 205, Boulder, CO 80301, USA
11
Argelander Institute for Astronomy, University of Bonn, Auf dem Hügel 71, D-53121 Bonn, Germany 12
Cavendish Laboratory, University of Cambridge, 19 J. J. Thomson Avenue, Cambridge CB3 0HE, UK 13
Dalhousie University, Halifax, Nova Scotia, Canada 14
Laboratoire AIM, CEA/DSM-CNRS-Université Paris Diderot, Irfu/Service d’Astrophysique, CEA Saclay, Orme des Merisiers, F-91191 Gif-sur-Yvette cedex, France
15
European Southern Observatory, Alonso de Cordova 3107, Casilla 19001, Vitacura Santiago, Chile 16
Institute for Astronomy, University of Edinburgh, Royal Observatory, Blackford Hill, Edinburgh EH9 3HJ, UK 17
IRAM, 300 rue de la piscine, F-38406 Saint-Martin d’Hères, France 18
Cornell University, 220 Space Sciences Building, Ithaca, NY 14853, USA 19
Centre for Extragalactic Astronomy, Department of Physics, Durham University, South Road, Durham DH1 3LE, UK 20Joint ALMA Observatory—ESO, Av. Alonso de Cordova, 3104, Santiago, Chile
21
Astronomy Department, Yale University, New Haven, CT 06511, USA 22
SKA Organisation, Lower Withington, Cheshire, UK 23
Astronomy Centre, Department of Physics and Astronomy, University of Sussex, Brighton BN1 9QH, UK Received 2016 May 6; revised 2016 July 22; accepted 2016 August 3; published 2016 December 8
ABSTRACT
We make use of deep 1.2 mm continuum observations(12.7 μJy beam−1rms) of a 1 arcmin2region in the Hubble Ultra Deep Field to probe dust-enshrouded star formation from 330 Lyman-break galaxies spanning the redshift range z=2–10 (to ∼2–3 Meyr−1at 1σ over the entire range). Given the depth and area of ASPECS, we would expect to tentatively detect 35 galaxies, extrapolating the Meurer z∼0 IRX–β relation to z 2 (assuming dust temperature Td∼35 K). However, only six tentative detections are found at z2 in ASPECS, with just three at
>3σ. Subdividing our z=2–10 galaxy samples according to stellar mass, UV luminosity, and UV-continuum slope and stacking the results, wefind a significant detection only in the most massive (>109.75Me) subsample, with an infrared excess(IRX=LIR/LUV) consistent with previous z∼2 results. However, the infrared excess we
measure from our large selection of sub-L∗ (<109.75 Me) galaxies is 0.11-+0.42
0.32±0.34 (bootstrap and formal
uncertainties) and0.14-+0.140.15±0.18 at z=2–3 and z=4–10, respectively, lying below even an IRX–β relation for
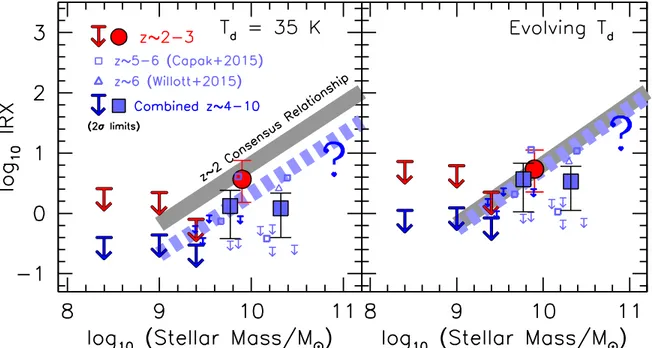
the Small Magellanic Cloud (95% confidence). These results demonstrate the relevance of stellar mass for predicting the IR luminosity of z2 galaxies. We find that the evolution of the IRX–stellar mass relationship depends on the evolution of the dust temperature. If the dust temperature increases monotonically with redshift (µ + z(1 )0.32) such that T
d∼44–50 K at z 4, current results are suggestive of little evolution in this relationship
to z∼6. We use these results to revisit recent estimates of the z 3 star formation rate density.
Key words: galaxies: evolution– galaxies: ISM – galaxies: star formation – galaxies: statistics – instrumentation: interferometers– submillimeter: galaxies
1. INTRODUCTION
One particularly interesting and long-standing focus of galaxy studies has been quantifying the total energy output and stellar birth rate in galaxies across cosmic time. The first significant investigations became possible following systematic searches for galaxies to intermediate and high redshifts, z∼3–4 (Lilly et al.1996; Madau et al.1996). The immediate picture was that the star formation rate (SFR) density likely peaked around z∼2–4 (Madau et al.1996; Steidel et al.1999).
Using photometric searches for Lyman-break galaxies at z>4, it later became clear that there was a significant drop in the SFR density to z>4 (Dickinson 2000; see review by Madau & Dickinson 2014). Rough constraints now exist on the SFR density to z∼10 (e.g., Bouwens et al. 2011, 2015a; Ellis et al. 2013; Oesch et al. 2014, 2015; McLeod et al. 2015; Laporte et al.2016).
In spite of huge progress in mapping the SFR density from z∼0 to z∼11 from surveys in the rest-frame UV, our understanding of the energy output from UV-selected galaxies The Astrophysical Journal,833:72(32pp), 2016 December 10 doi:10.3847/1538-4357/833/1/72 © 2016. The American Astronomical Society. All rights reserved.
at far-infrared wavelengths is most developed over the redshift range z∼0 to z∼3, with increasing maturity (Reddy et al. 2008; Daddi et al. 2009; Magnelli et al. 2009, 2011, 2013; Karim et al. 2011; Cucciati et al. 2012; Álvarez-Márquez et al. 2016). This general picture of the energy output from galaxies at rest-frame UV and far-IR wavelengths has been confirmed by many independent probes at X-ray and radio wavelengths and using the Hα emission line, with consistent results (e.g., Reddy & Steidel2004; Reddy et al.2006,2010; Erb et al. 2006b; Daddi et al.2007).
The observational situation becomes much more uncertain when one considers dust-enshrouded star formation at z>3, as use of standard techniques or facilities becomes more difficult (owing to the features from polycyclic aromatic hydrocarbons shifting out of the Spitzer/MIPS 24 μm band or increasing source confusion in Spitzer or Herschel 70–500 μm observa-tions), effectively limiting studies to the brightest, most intensely star-forming sources at z>3 (e.g., HFLS3: Riechers et al.2013). As a result of these challenges, various researchers (e.g., Meurer et al. 1999[M99]; Reddy et al.2006; Bouwens et al. 2007, 2009,2012; Daddi et al.2007) have made use of well-known z∼0 correlations, i.e., the relationship between infrared excess (IRX=LIR/LUV) and UV-continuum slope
(β), to estimate dust extinction in more typical z 3 galaxies based on the UV slopes measured from the observed UV data. Such correlations have been confirmed to apply out to z∼2 using a variety of multi-wavelength data (Reddy et al. 2006, 2008; Daddi et al.2007,2009; Pannella et al.2009), but it is unclear if they apply at z 3.
Despite the power of stacking, e.g., with the SCUBA-2 or Herschel data, more direct measurements of the dust-enshrouded star formation have required the advent of some new or upgraded facilities (e.g., Atacama Large Millimeter Array (ALMA), NOrthern Extended Millimeter Array (NOEMA)). The first results from these facilities indicated that there was no detectable dust-enshrouded star formation in normal or even extremely bright UV-selected z>5 galaxies (Walter et al. 2012; Ouchi et al.2013; González-López et al. 2014; Ota et al. 2014; Riechers et al. 2014; Maiolino et al.2015). Later, some bright z∼5–6 galaxies were weakly detected in the far-IR continuum (Capak et al. 2015; Willott et al.2015), but at lower levels than seen in similar galaxies at lower redshifts using well known lower-redshift z∼0–2 IRX– β relations.
While current results generally suggest much lower dust emission from z>3 galaxies than expected based on z=0–2 IRX–β relations, the number of z>3 sources where such constraints are available remains modest. This is especially the case when one considers only sources that can be confidently placed in z>3 samples and have accurately measured UV continuum slopes, stellar masses, or SFRs. As such, it is clearly helpful to obtain deep continuum observations with ALMA over fields with substantial amounts of legacy observations at other wavelengths from the Hubble Space Telescope (HST), Spitzer, Herschel, and ground-based observatories.
Fortunately, with our recent 20 hr, 1.2 mm ALMA program (2013.1.00718.S: PapersIand IIin the ALMA Spectroscopic Survey in the HUDF (ASPECS) series (Walter et al. 2016; Aravena et al. 2016a), we were able to acquire very deep continuum observations over a 1 arcmin2region of the sky with high-quality multi-wavelength observations. That region was the Hubble Ultra Deep Field (HUDF: Beckwith et al. 2006;
Xue et al. 2011; Illingworth et al.2013), containing the most sensitive ultraviolet, optical, near-infrared, X-ray, and radio observations available anywhere on the sky (Bouwens et al. 2011; Xue et al.2011; Ellis et al.2013; Illingworth et al.2013; Teplitz et al. 2013; Rujopakarn et al. 2016). Our new observations(12.7 μJy beam−1) were sufficiently deep to probe to an almost-constant dust-enshrouded SFR of 4 Meyr−1at 2σ from z∼2 to z∼10 over the field (for dust temperature Td∼35 K), allowing us to obtain a census of such star
formation over a substantial volume (∼2×10⁴ Mpc3) in the early universe.
With these deep ALMA observations, we have the capacity not only to detect dust emission from individual sources to almost unprecedented limits, but also to systematically measure how the dust-enshrouded SFRs in galaxies depend on redshift, stellar mass, and UV-continuum slopeβ. In an earlier paper in this series (Paper II: Aravena et al. 2016a), we identified all those sources that showed significant individual detections (>3.5σ) in our 1 arcmin2 mosaic and briefly examined the
characteristics of the detected sources, noting that the mean redshift of those sources was approximately z∼1.5. We also considered stacks of various sources over thisfield, subdividing these samples by redshift, stellar mass, and SFR. We demonstrated that by combining the individual detections in ASPECS with the stacked measures we could match the measured cosmic background at 1.2 mm.
The purpose of this paper(Paper VI in the ASPECS series) is to focus in particular on the infrared excess (LIR/LUV) of
z=2–10 galaxies over our 1 arcmin2field and to quantify the dependence of this excess on stellar mass and UV-continuum slopeβ. Over the 1 arcmin2ASPECSfield, we have sufficient z=2–10 sources, i.e., ∼330 in total, to attempt a first exploration of the IRX–β and IRX–stellar mass relations at z>2 for normal galaxies. We can also investigate quantita-tively whether the IRX–β relationship shows a dependence on stellar mass and how strong that dependence is (if it exists). Previous work(e.g., Baker et al.2001; Reddy et al.2006; Siana et al.2008,2009; Álvarez-Márquez et al.2016) has presented seemingly compelling evidence for such a dependence, with higher- and lower-mass galaxies showing an M99 and a Small Magellanic Cloud (SMC) IRX–β relationship, respectively.24 However, most of these studies have not extended into the mass regime that we explore with the present data set and have not extended out to z 3.
The outline of the paper is as follows. We begin with a description of the ASPECS 1.2 mm data set that we employ for this study, our procedure for constructing z=2–10 samples from the HUDF data, and finally our derivation of stellar population parameters for individual sources (Section 2). In Section3, we discuss the number of z=2–10 galaxies that we would expect to individually detect based on z=0–2 results, compare that with what wefind, and then finally measure the stacked signal from the observations, subdividing the samples according to stellar mass, UV-continuum slopeβ, and apparent magnitude. We discuss our results in Section4and their likely implications in Section 5. Finally, Section 6 summarizes our results and the most important conclusions.
24
Reddy et al.(2006) frame the dependence of the IRX–β relation in terms of
the stellar population age of a galaxy. Sources with ages <100 Myr and >100 Myr were found to show SMC and M99 IRX–β relations, respectively. In the context of the samples of Reddy et al.(2006), stellar population age is
functionally equivalent to stellar mass. 2
We refer to the HST F225W, F275W, F336W, F435W, F606W, F600LP, F775W, F814W, F850LP, F105W, F125W, F140W, and F160W bands as UV225, UV275, U336, B435, V606,
V600, i775, I814, z850, Y105, J125, JH140, and H160, respectively,
for simplicity. For consistency with previous work, we find it convenient to quote results in terms of the luminosityLz*=3that
Steidel et al.(1999) derived at z∼3, i.e.,M1700,AB= -21.07. Throughout the paper we assume a standard “concordance” cosmology with H0=70 km s−1 Mpc−1, Ωm=0.3, and
ΩΛ=0.7, which are in good agreement with recent
cosmo-logical constraints (Planck Collaboration et al. 2015). Stellar masses and obscured SFRs are quoted assuming a Chabrier (2003) initial mass function (IMF) while the SFR density is presented adopting a Salpeter (1955) IMF. Magnitudes are in the AB system(Oke & Gunn1983).
2. OBSERVATIONS AND SAMPLE 2.1. Band-6 Data Set and Flux Measurements The principal data used are the ALMA observations from the 2013.1.00718.S program(PI: Aravena) over the HUDF. Those observations were obtained through a full frequency scan in band 6 (212–272 GHz) with ALMA in its most compact configuration. The observations are distributed over seven pointings and cover an approximate area of∼1 arcmin2to near uniform depth. As described in PaperII(Aravena et al.2016a), we collapsed our spectral data cube along the frequency axis in the uv-plane, inverting the visibilities using the CASA task
CLEAN using natural weighting and mosaic mode, to produce the continuum image. The peak sensitivity we measure in these continuum observations is 12.7μJy (1σ) per primary beam. Our observations fall within the region of the HUDF that possesses the deepest UV, optical, and near-infrared observa-tions(see Illingworth et al.2013; Teplitz et al.2013).
The sensitivity of our ALMA observations allows us to provide useful individual constraints on the far-IR dust emission from normal sub-L*galaxies. If we adopt a modified blackbody form for the shape of the spectral energy distribution (SED) with a dust temperature of 35 K and a power-law spectral index for the dust emissivity of βd=1.6 (Eales
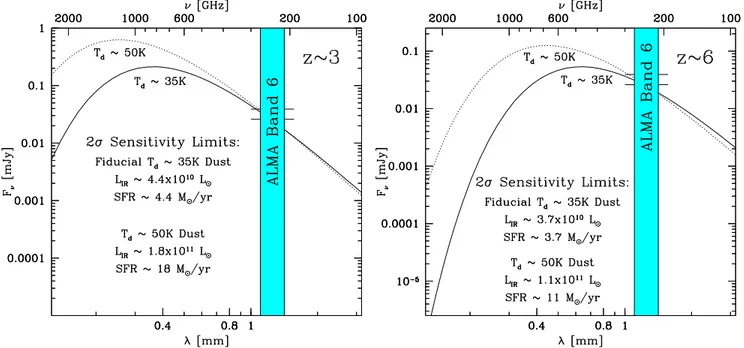
et al.1989; Klaas et al.1997), and account for the impact of the cosmic microwave background (CMB) (e.g., da Cunha et al. 2013b: Section 3.1.1), we estimate that we should be able to tentatively detect at 2σ any star-forming galaxy at z > 3 with an IR luminosity(8–1000 μm rest-frame) in excess of 4 × 10¹⁰Le (see Table1 and Figure1). For comparison, the characteristic luminosity of galaxies in the rest-frame UV is approximately equal to 4×10¹⁰ Lefrom z∼3 to z∼8. The implication is that the typical L∗galaxy should be tentatively detected at2σ in our data set if it were outputting equal amounts of energy in the far-IR and rest-frame UV.
We consider tentative 2σ detections in our examination of our ASPECSfield, instead of the usual 3σ or 3.5σ limit, to push as faint as possible in looking for evidence of obscured star formation. We can use this aggressive limit because of the relatively modest number of z=2–10 sources over ASPECS Table 1
2σ Sensitivity Limits for our Probe of Obscured Star Formation from Individual z2 Galaxies and the Dependence on SED
Far-Infrared 2σ Sensitivity Limits (10
10 Le)
SED Model z∼2 z∼3 z∼4 z∼5 z∼6 z∼7 z∼8 z∼9 z∼10
35 K modified blackbodya( fiducial) 5.0 4.4 4.0 3.7 3.7 3.8 4.2 4.8 6.0
Modified blackbody with evolving Tdb 6.3 7.8 8.8 9.5 10.1 10.2 9.5 9.2 9.1
25 K modified blackbodya 1.4 1.4 1.4 1.6 1.9 2.7 4.1 6.9 12.3
30 K modified blackbodya 2.7 2.5 2.4 2.4 2.5 2.9 3.6 4.9 7.0
40 K modified blackbodya 8.5 7.3 6.3 5.7 5.3 5.2 5.3 5.7 6.4
45 K modified blackbodya 13.9 11.6 9.8 8.5 7.7 7.3 7.1 7.2 7.5
50 K modified blackbodya 21.6 17.6 14.6 12.4 11.0 10.1 9.5 9.3 9.3 NGC 6946c 1.3 1.3 1.4 1.6 1.9 2.5 3.5 5.4 8.7 M51c 1.4 1.4 1.5 1.6 1.9 2.5 3.4 5.2 8.2 Arp 220c 7.4 6.6 6.1 5.6 5.4 5.5 5.7 5.9 6.6 M82c 11.8 10.4 9.4 8.7 8.4 8.4 8.6 9.1 9.9
2σ Limit for Probes of the Obscured SFR (Meyr−1)d
SED Model z∼2 z∼3 z∼4 z∼5 z∼6 z∼7 z∼8 z∼9 z∼10
35 K modified blackbodya( fiducial) 5.0 4.4 4.0 3.7 3.7 3.8 4.2 4.8 6.0
Modified blackbody with evolving Tdb 6.3 7.8 8.8 9.5 10.1 10.0 9.4 9.0 8.9
25 K modified blackbodya 1.4 1.4 1.4 1.6 1.9 2.7 4.1 6.9 12.3
30 K modified blackbodya 2.7 2.5 2.4 2.4 2.5 2.9 3.6 4.9 7.0
40 K modified blackbodya 8.5 7.3 6.3 5.7 5.3 5.2 5.3 5.7 6.4
45 K modified blackbodya 13.9 11.6 9.8 8.5 7.7 7.3 7.1 7.2 7.5
50 K modified blackbodya 21.6 17.6 14.6 12.4 11.0 10.1 9.5 9.3 9.3 NGC 6946c 1.3 1.3 1.4 1.6 1.9 2.5 3.5 5.4 8.7 M51c 1.4 1.4 1.5 1.6 1.9 2.5 3.4 5.2 8.2 Arp 220c 7.4 6.6 6.1 5.6 5.4 5.5 5.7 5.9 6.6 M82c 11.8 10.4 9.4 8.7 8.4 8.4 8.6 9.1 9.9 Notes. a
Standard modified blackbody form (e.g., Casey2012) with a power-law spectral index for the dust emissivity of βd=1.6 (Eales et al.1989; Klaas et al.1997).
b
Assuming dust temperature Tdevolves as(35 K)((1+ z) 2.5)0.32(Béthermin et al.2015) such that Td∼44–50 K at z∼4–6. See Section3.1.3.
c
Empirical SED templatefits to specific galaxies in the nearby universe (Silva et al.1998).
d
Using the conversionSFR=LIR (1010L) appropriate for a Chabrier IMF(Kennicutt1998; Carilli & Walter2013).
3
and the availability of sensitive MIPS 24μm observations and photometrically inferred physical properties to evaluate any tentative detections.
To ensure accurate far-IR flux measurements for sources over our HUDF mosaic, care was taken in determining the offset between the nominal sky coordinates for sources in our deep ALMA continuum observations and the positions in the ultraviolet, optical, and near-IR observations using the six best-continuum-detected sources over the HUDF (Aravena et al. 2016a). The positional offset between the images was found to be such that sources in our ALMA continuum image were positioned ∼0 3 to the south of sources in the HST mosaic, with ∼0 2 source-to-source scatter in the derived offset. Such source-to-source offsets from UV to far-IR are not surprising for bright sources, but are expected to be smaller for most of the fainter sources we are stacking, as the results we present in Section 3.2 indicate. Overall, on the basis of the source-to-source scatter, we estimate that we can register the HST and ALMA mosaics to better than 0 1 on average.
Flux measurements themselves were made using the nominal flux at the position of the source in the continuum map divided by the primary beam. We checked those flux measurements against those we derive after convolving the maps by the primary beam and looking at theflux at source center. For this latter procedure, we found that we recovered a flux that was less than 5% higher than using the flux at the position of the source.
For a more detailed summary of the ASPECS data set and the basic results, we refer the reader to Papers IandIIin this series(Walter et al.2016; Aravena et al.2016a). PaperVin this series (Aravena et al. 2016b) provides a comprehensive discussion of the candidate [C II] 158 μm lines identified in the band-6 data.
2.2. Samples of Lyman-break Galaxies
The high-redshift star-forming galaxies that we analyzed in this study were selected for this study using the best existing HST observations over the HUDF.
We briefly describe the z=1.5–3.5 samples that we constructed over the HUDF using the available WFC3/UVIS, ACS/WFC, and WFC3/IR observations. For HST optical ACS/WFC and near-infrared WFC3/IR observations, we make use of the XDF reductions (Illingworth et al. 2013), which incorporated all ACS+WFC3/IR data available over the HUDF in 2013. The XDF reductions are∼0.1–0.2 mag deeper than original reductions of Beckwith et al. (2006) at optical wavelengths and also provide coverage in the F814W band. The WFC3/IR reductions made available as part of the XDF release include all data from the original HUDF09(Bouwens et al.2011), CANDELS (Grogin et al.2011; Koekemoer et al. 2011), and HUDF12 (Ellis et al.2013) programs.
In the process of assembling our z=1.5–3.5 samples, we derived our initial source catalogs and performed photometry on sources using our own modified version of the SExtractor (Bertin & Arnouts 1996) software. Source detection was performed on the square root ofχ2image(Szalay et al.1999: similar to a coadded image) constructed from the V606, i775,
Y105, J125, JH140, and H160images. After correctingfluxes for
point-spread function (PSF) to match the H160-band image,
color measurements were made in scalable apertures in the style of Kron (1980) with a Kron factor of 1.6. “Total magnitude” fluxes were derived from the smaller scalable apertures by(1) correcting the flux to account for the additional flux seen in a larger scalable aperture (Kron factor of 2.5) as seen on the square root ofχ2image and(2) correcting for the flux outside these larger scalable apertures and on the wings of Figure 1. Model SEDs in the far-IR for the faintest z∼3 and z∼6 galaxies for which we would be able to obtain tentative individual detections (>2σ) in our deep ALMA band-6 observations. The plotted SEDs are modified blackbody SEDs with a dust temperature of 35 K and a power-law spectral index for the dust emissivity ofβd=1.6 (Eales et al.1989; Klaas et al.1997). The two short horizontal lines at 1.2 mm show our 2σ and 3σ sensitivity limits. At both z∼3 and z∼6, we would expect to tentatively detect individual galaxies to approximately the same IR luminosity,∼4×10¹⁰L
e, which is equivalent to an obscured star formation rate(SFR) of∼4 Meyr−1. For galaxies with dust temperatures of 50 K, we would expect to tentatively detect galaxies to IR luminosities of∼1.8×10¹¹Leand∼1.1×10¹¹Le at z∼3 and z∼6, equivalent to obscured SFRs of ∼18 and ∼11 Meyr−1, respectively. These sensitivities account for the impact of the CMB(da Cunha et al.
2013b).
4
the PSF using tabulations of the encircled energy (Dressel et al.2012).
Galaxies at intermediate redshift z∼2–3 were selected by applying simple two-color criteria using the Lyman-break galaxy(LBG) strategy: / - > - < - < < UV U U B V Y UV 1 1 0.7 S N 1.5 275 336 336 435 606 105 225 ( ) ( ) ( ) ( ( ) )
for z∼2 galaxies and
c - > - < - < < U B B V i Y 1 1.2 0.7 UV UV 2 336 435 435 606 775 105 , 2 225 275 ( ) ( ) ( ) ( )
for z∼3 galaxies, where ∧, ∨, and S/N represent the logical AND, OR symbols, and signal-to-noise in our smaller scalable apertures, respectively. We define cUV2 ,UV
225 275 as
s
SiSGN( )(fi fi i)2 where fi is the flux in bands UV225 and
UV275in a small scalable aperture,σiis the uncertainty in this
flux, and SGN( fi) is equal to 1 if fi>0 and −1 if fi<0. These
criteria are similar to the two-color criteria previously utilized in Oesch et al. (2010) and Hathi et al. (2010).
Our z=4–8 samples were drawn from the samples of Bouwens et al. (2015a) and include all z=3.5–8.5 galaxies located over the 1 arcmin2 ASPECS region. The samples of Bouwens et al. (2015a) were based on the deep optical ACS and WFC3/IR observations within the HUDF. z=4–8 samples were constructed by applying Lyman-break-like color criteria to the XDF reduction (Illingworth et al. 2013) of the HUDF.
The z=9–10 samples of R. J. Bouwens et al. (2016, in preparation) were constructed applying a Y105or J125-dropout
Lyman-break color criterion to the available HST data and then splitting the selected sources into z∼9 and z∼10 subsamples. Two sources from that z=9–10 sample lie within the ASPECS region (see also Bouwens et al. 2011; Ellis et al.2013; Oesch et al.2013b).
To maximize the total number of star-forming galaxies at z∼2–10 considered in this study, we also applied the EAZY photometric redshift code to the HST WFC3/UVIS, ACS, and WFC3/IR photometric catalogs we had available over our deep ALMA field and included all sources with a best-fit redshift solution between z∼1.5 and z∼8.5, which were not in our Lyman-break catalogs, and which utilized star-forming or dusty SED templates to reproduce the observed SED. We also made use of the photometric catalog of Rafelski et al. (2015) and included those sources in our samples, if not present in our primary two selections.
The star-forming galaxies selected by photometric redshift added 64, 31, 2, and 1 z∼2, z∼3, z∼4, and z∼7 galaxies to our study, respectively. Sources in our photometric-redshift selections showed almost identical distributions of properties to our LBG selections at z∼2–3 (where our photometric-redshift selections add sources), with a median β and stellar mass of −1.84 and 108.41
Me for the photometric-redshift selections versus −1.82 and 108.37Mefor the z∼2–3 LBG selections. 9% (7/79) and 3% (3/96) of the sources in our LBG and photometric-redshift selections, respectively, have measured βʼs redder than −1.
Eighty-one z∼2 and 81 z∼3 sources in total were identified using our dropout + photometric-redshift criteria over the 1 arcmin2region of the HUDF where we have deep ALMA observations. Our higher-redshift z∼4, z∼5, z∼6,
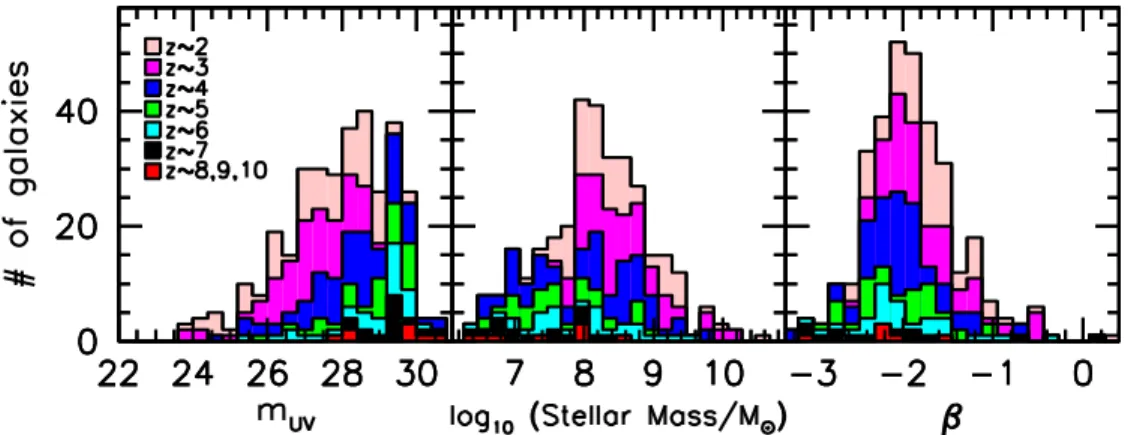
z∼7, z∼8, z∼9, and z∼10 samples (Bouwens et al.2015a, 2016, in preparation) contain 80, 34, 30, 16, 6, 1, and 1 sources, respectively (Table 2) over this same region. The expected contamination rate in these color-selected samples by lower-redshift galaxies(or stars) is estimated to be of the order of 3%–8% (e.g., Bouwens et al. 2015a). In terms of apparent magnitude in the UV continuum, these sources extend from 21.7 mag to 30.8 mag(Figure2: left panel).
2.3. Estimates of the Stellar Mass for Individual Sources in our z=2–10 Sample
We provide a brief description of our estimates of the stellar mass for z=2–10 sources over the HUDF. As in other work (e.g., Sawicki & Yee 1998; Brinchmann & Ellis 2000; Papovich et al. 2001; Labbé et al. 2005; Gonzalez et al. 2014), we estimate stellar masses for individual sources in our samples by modeling the observed photometry using stellar population libraries and considering variable (or fixed) star formation histories, metallicities, and dust content.
For convenience, we make use of the publicly available code FAST(Kriek et al.2009) to perform this fitting. We assume a Chabrier(2003) IMF, a metallicity of 0.2 Ze, an approximately constant SFR in modeling the star formation history while performing thefits (keeping the parameter τ equal to 100 Gyr where the star formation history is proportional to e−t/τ), and we allow the dust extinction in the rest-frame V band to range from zero to 2 mag. Ourfixing the fiducial metallicity to 0.2 Ze is well motivated based on studies of the metallicity of individual z∼2–4 galaxies (Pettini et al.2000) or as predicted from cosmological hydrodynamical simulations (Finlator et al. 2011; Wise et al. 2012). While the current choice of parameters can have a sizeable impact on inferred quantities such as the age of a stellar population(changing by >0.3–0.5 dex), these choices typically do not have a major impact (0.2 dex) on the inferred stellar masses.
In deriving the stellar masses for individual sources, we made use of flux measurements from 11 HST bands (UV225,
UV275, U336, B435, V606, i775, z850, Y105, J125, JH140, H160), one Table 2
Number of UV-selected z∼2, z∼3, z∼4, z∼5, z∼6, z∼7, z∼8, z∼9, and z∼10 Galaxies Located within our Deep ALMA HUDF Pointing
# of
Redshift Selection Criterion Sources Ref.a z∼2 UV275-dropout or
1.5<zphot<2.5 81 This work z∼3 U336-dropout or
2.5<zphot<3.5 81 This work z∼4 B435-dropout or
3.5<zphot<4.5 80 B15/This work
z∼5 V606-dropout 34 B15
z∼6 i775-dropout 30 B15
z∼7 z850-dropout or
6.5<zphot<7.5 16 B15/This work
z∼8 Y105-dropout 6 B15 z∼9 Y105-dropout 1 B16 z∼10 J125-dropout 1 B16 Total 330 Note. a
References: B15—Bouwens et al. (2015a), B16—R. J. Bouwens et al. (2016,
in preparation)
5
band in the near-IR from the ground (Ks), and four Spitzer/
IRAC bands(3.6 μm, 4.5 μm, 5.8 μm, and 8.0 μm). The HST photometry we use for estimating stellar masses was derived by applying the same procedure as used for selecting our z∼2–3 LBG samples (see Section2.2).
Our Spitzer/IRAC flux measurements were derived for individual sources from ∼100–200 hr stacks of the IRAC observations over the HUDF (Labbé et al. 2015) from the IUDF program (PI: Labbé) and the Spitzer/IRAC program of Oesch et al.(2013a). As has become standard procedure (e.g., Labbé et al. 2005, 2015; Shapley et al. 2005; Grazian et al. 2006; Laidler et al. 2007; Merlin et al. 2015), we use the HST observations as a template to model the fluxes of sources in the Spitzer/IRAC observations and thus perform photometry below the nominal confusion limit. The modelflux from neighboring sources is subtracted before attempting to measurefluxes for the sources of interest. Source photometry is performed in 1 8 diameter circular apertures for the Spitzer/ IRAC 3.6μm and 4.5 μm bands and 2 0 diameter circular apertures for the 5.8μm and 8.0 μm bands. The observed fluxes are corrected to the total based on the inferred growth curve for sources after PSF correction to the Spitzer/IRAC PSF. We utilize a similar procedure to derivefluxes for sources based on the deep ground-based K-band observations available from VLT/HAWK-I, VLT/ISAAC, and PANIC observations (Fontana et al.2014) over the HUDF (5σ depths of 26.5 mag). A modest correction is made to the IRAC 3.6μm and 4.5 μm photometry to account for the impact of nebular emission lines on the observed IRACfluxes, decreasing the brightness of the 3.6μm and 4.5 μm band fluxes by 0.32 mag to account for the presence of Hα and by 0.4 mag to account for the presence of [OIII]+Hβ emission where present. These corrections are well motivated based on observations of z∼4–8 galaxies (Labbé et al. 2013; Stark et al.2013; Smit et al.2014,2015; Marmol-Queralto et al.2016; Rasappu et al.2016) and lower the median inferred stellar mass for z>3.8 galaxies in our sample by ∼0.1 dex.
The stellar masses we estimate for the highest-redshift sources in our selection, z>5, are not as well constrained as at lower redshifts, where our sensitive photometry extends to rest-frame 1μm. To guard against noise in the modeling process scattering lower-mass galaxies into higher-mass bins, we also model the photometry of galaxies and force the dust extinction to be zero infitting the observed SEDs with FAST. For sources
where the mass estimates exceed the dust-free stellar-mass estimates by more than 0.9 dex and the photometric evidence for a particularly dusty SED was weak(applicable to only six sources from our total sample of 330 sources), we made use of the dust-free stellar mass estimates instead.
We also estimated stellar masses for our sources by using the MAGPHYS software (da Cunha et al. 2008) to model the photometry for the 330 z=2–10 sources that make up our samples. For sources with redshifts z<3.8, the stellar masses we estimated were in excellent agreement with our fiducial results, with the median and mean stellar mass derived by MAGPHYS being 0.02 dex and 0.04 dex lower, respectively. This points toward no major systematic biases in the results from the present study—which rely on FAST-estimated masses —and from the other papers in the ASPECS series—where the reliance is on MAGPHYS-estimated masses.
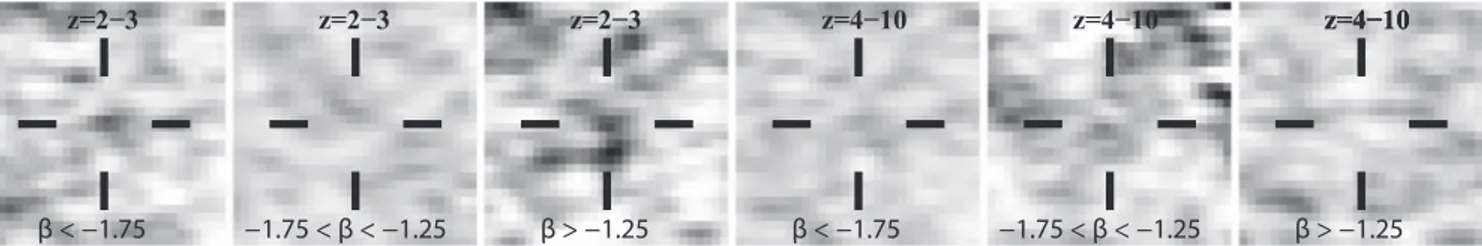
The middle panel of Figure2illustrates the effective range in stellar mass probed by our z=2–10 sample. Most sources from our HUDF z=2–10 sample have stellar masses in the range 107.5Meto 109.5Me. The most massive sources probed by our program extend from 1010 to 1011.2 Me. Beyond the stellar mass itself, Figure 2 also illustrates the range in UV-continuum slopeβ probed by our samples (see Section3.1for details on how β is derived). Since the measured β has been demonstrated to be quite effective in estimating the infrared excess for lower-redshift UV-selected samples (e.g., M99; Reddy et al.2006; Daddi et al.2007), it is useful for us to probe a broad range inβ. As can be seen from Figure2, our samples probe the rangeβ∼−1.5 to ∼−2.5 quite effectively.
3. RESULTS
3.1. Expected Detections in the Far-IR Continuum 3.1.1. Expectations Using the z∼0 IRX–β Relations We commence our analysis of our ALMA HUDF observa-tions byfirst asking ourselves which sources we might expect to detect, given various results at lower redshift. Such an exercise will help us to interpret the results that follow and also to evaluate whether or not the number of sources we detect and the rest-frame far-IR flux density we measure for z>2 galaxies are similar to those found for galaxies at z∼0.
We adopt as our z∼0 baseline the now canonical IRX–β relationship of M99, where a connection was found between the infrared excess(IRX) of galaxies and the spectral slope of Figure 2. Cumulative histograms showing the composition of the HUDF z∼2, z∼3, z∼4, z∼5, z∼6, z∼7, and z∼8–10 samples that we consider here (pink, magenta, blue, green, cyan, black, and red shaded histograms, respectively) as a function of apparent magnitude (measured at wavelengths probing the UV continuum), stellar mass, and UV-continuum slope β (left, central, and right panels, respectively). The deep far-IR continuum observations (12.7 μJy beam−1rms) from ASPECS make it possible for us to set the best constraints on the average dust emission from(mUV>25, <1010Me) galaxies thus far.
6
the UV continuum:
= b+
-M99: IRXM99 1.75 10( 0.4 1.99( ( 2.23)) 1) ( )1 The factor of 1.75 in the above relationship is needed to express the M99 relation in terms of the IR luminosity, rather than the far-IR luminosity utilized by M99. See the discussion in Section5.1 of Reddy et al. (2006). This relationship implicitly includes the slope of the dust law of Calzetti et al. (2000). Despite modest scatter (∼0.3 dex), redder galaxies were systematically found to show higher infrared excesses than blue galaxies. For simplicity, the factor B=BC(1600)* BC(FIR) from M99 is taken to equal one, consistent with the measurements made in that study.
Importantly, the M99 IRX–β relationship was shown to have a basic utility that went beyond the z∼0 universe for UV-selected samples. A series of intermediate-redshift studies (Reddy et al. 2006, 2010; Daddi et al. 2007; Pannella et al. 2009) found this relationship to be approximately valid when comparing the observed IR luminosities of galaxies to the predictions from the M99 IRX–β relationship.
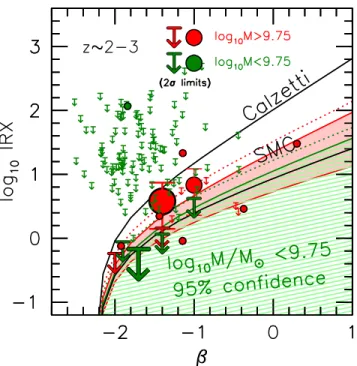
As an alternative baseline, we also consider the expectations when adopting the so-called SMC IRX–β relationship, where a connection is again assumed between the infrared excess of a galaxy and its spectral slope in the UV continuum. However, since the SMC dust curve is steeper in the near-UV than dust laws like that of Calzetti et al.(2000), a small optical depth in dust extinction can have a large impact on the observed color of a galaxy in the UV continuum. The infrared excess, given an SMC extinction, can be expressed as follows:
= b+
-SMC: IRXSMC 100.4 1.1( ( 2.23)) 1 ( )2 This relationship is derived based on the observational results of Lequeux et al. (1982), Prevot et al. (1984), and Bouchet et al. (1985: see also Pei 1992; Pettini et al. 1998; Smit et al.2015).
For each of the z=2–10 sources in our ALMA field, we fit the HST photometry in various bands probing the UV continuum to a power law f1600(l 1600Å) to derive a meanb flux at ∼1600 Å and also a spectral slope β. We derive a
nominal luminosity for the source in the rest-frame UV by multiplying the flux density of the source at 1600 Å by the frequency at that wavelength(ν1600f1600) and convert that to an
expected IR luminosity for the source (considered to extend from 8μm to 1000 μm).25
The equivalentflux at an observed wavelength of 1.2 mm is then computed by adopting a modified blackbody form with a dust temperature of 35 K and a power-law spectral index for the dust emissivity of βd=1.6. A value of Td=35 K is
intermediate between the temperatures found for main-sequence galaxies by Elbaz et al. (2011) and Genzel et al. (2015), i.e., ∼30 K at z∼2, and ∼37–38 K found for stacked sources in other studies(Coppin et al.2015).
Since the flux density we would measure with ALMA is reduced somewhat by the effective temperature of the CMB at z∼2–10, we multiply the measured flux by Cν,
= -n n n C B T z B 1 35 K , 3 CMB ( ( )) ( ) ( )
to compute the expected signal. This treatment follows prescriptions given in da Cunha et al.(2013b).
Performing this exercise over all 330 z=2–10 galaxies with coverage from our ALMA mosaic, we calculated expected fluxes for these sources at 1.2 mm assuming that sources follow the M99 and SMC IRX–β relations. These calculations suggested that 35 and 26 of these galaxies should be detected at 2σ and 3σ significance, respectively, in our observations if the M99 IRX–β relation applied, while eight and five of these sources would be detected at 2σ and 3σ significance, respectively, if the SMC IRX–β relationship applied to z=2–10 galaxies in our samples.
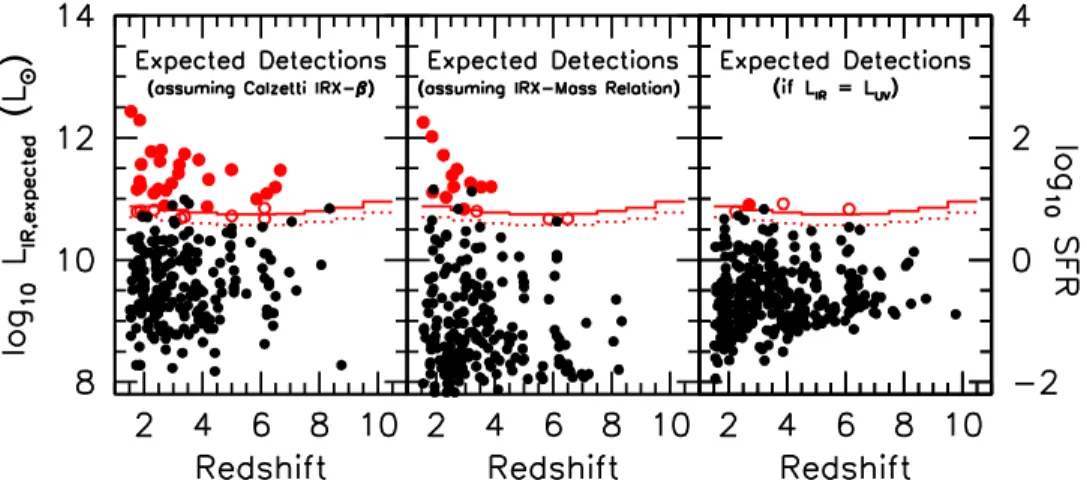
To illustrate these expectations for our z 2 study, we present the predicted IR luminosities for our z∼2–10 sample versus redshift in the left panel of Figure3. The red solid and Figure 3. Expected IR luminosities (in Le) vs. photometric redshift of z=2–10 galaxies (solid circles) within the 1 arcmin2 ASPECS region. Expected IR luminosities are based on(1) the M99 IRX–β relationship (left panel), (2) the approximate z∼2–3 IRX–stellar mass relationship (center panel: see AppendixA), or
(3) assuming LIR=LUV(right panel). The solid and dotted red lines indicate the 3σ and 2σ limiting luminosities, respectively, to which we can probe as a function of redshift in the deepest regions within our 1 arcmin2field (assuming that the SED is well represented by a 35 K modified blackbody). The solid and open red circles correspond to sources where 3σ and 2σ detections are expected, respectively, adopting the assumptions from a given panel, while the black circles indicate sources where a tentative 2σ detection is not expected. Black sources can appear above the red lines if these sources fall in regions of ASPECS where the sensitivities are lower than the maximum.
25
In performing thesefits, we fix this slope to −2.2 for our two z=9–10 candidate galaxies, given the lack of sufficiently deep long-wavelength data to constrain the UV-continuum slopesβ. The β value we utilize here is motivated by the results of Bouwens et al.(2012, 2014b), Finkelstein et al. (2012),
Kurczynski et al.(2014), and Wilkins et al. (2016a), who find evidence for
bluer slopes for higher-redshift and generally fainter, lower-mass galaxies. 7
Table 3
z2 UV-Selected Sources Expected to Show Tentative 2σ Detections Adopting the M99 IRX–β Relationship and Assuming a 35 K Modified Blackbody SED and βd=1.6
Predicted Measured Inferred
mUV,0 f1.2mm([μJy) f1.2mm
IDa R.A. Decl. (mag) zph log10(M/Me) βb Calz.c SMCc Massc,d (μJy) LIR/(1010Le)
z∼2–3 Sample XDFU-2397246112(C2) 03:32:39.72 −27:46:11.2 24.4 1.55e 11.21 0.3±0.1 1426 99 946f 261±25 50±5 XDFU-2373546453(C5) 03:32:37.35 −27:46:45.3 23.7 1.85e 10.52 −0.5±0.1 1028 121 552f 71±14 14±3 XDFU-2393346236 03:32:39.33 −27:46:23.6 25.5 2.59e 10.18 −0.5±0.1 369 44 93f −12±13 −2±2 XDFU-2370746171 03:32:37.07 −27:46:17.1 23.7 2.24e 10.09 −1.2±0.1 350 67 306f 34±14 6±2 XDFU-2358146436 03:32:35.81 −27:46:43.6 24.6 1.90e 9.98 −0.9±0.1 194 31 75 16±52 3±10 XDFU-2356746283 03:32:35.67 −27:46:28.3 25.2 3.17 9.93 −1.3±0.1 153 30 108f −13±21 −2±4 XDFU-2385446340(C1) 03:32:38.54 −27:46:34.0 24.3 2.54e 9.9 −1.2±0.1 242 47 143f 571±14 97±2 XDFU-2388246143 03:32:38.82 −27:46:14.3 26.3 3.38 9.85 −0.5±0.1 321 38 37f 10±14 2±2 XDFU-2387446541 03:32:38.74 −27:46:54.1 25.7 2.74 9.85 −1.2±0.1 81 15 40 18±26 3±4 XDFU-2365446123 03:32:36.54 −27:46:12.3 24.1 1.87e 9.77 −1.5±0.1 85 19 68f 38±16 7±3 XDFU-2384246348 03:32:38.42 −27:46:34.8 23.8 2.70 9.75 −2.0±0.1 46 13 181f 36±14 6±2 XDFU-2369146023 03:32:36.91 −27:46:02.3 24.1 2.33e 9.47 −1.8±0.1 65 17 56f 13±16 3±3 XDFU-2395845544 03:32:39.58 −27:45:54.4 24.4 3.21e 9.46 −1.5±0.1 215 47 78 14±64 2±11 XDFU-2369146348 03:32:36.91 −27:46:34.8 24.7 1.76 9.46 −1.3±0.1 75 15 17 9±14 2±3 XDFU-2370846470 03:32:37.08 −27:46:47.0 24.4 1.85e 9.44 −1.3±0.1 102 20 23 0±15 0±3 XDFU-2363346155 03:32:36.33 −27:46:15.5 25.3 2.34 9.32 −1.6±0.1 35 8 13 1±16 0±3 XDFU-2366846484 03:32:36.68 −27:46:48.4 25.3 1.88e 9.27 −1.0±0.1 84 14 8 −10±19 −2±4 XDFU-2366946210 03:32:36.69 −27:46:21.0 24.9 1.96 9.26 −1.7±0.1 28 7 11 2±13 0±3 XDFU-2382946284 03:32:38.29 −27:46:28.4 26.2 1.76 9.22 −1.0±0.1 32 5 3 −2±14 −0±3 XDFU-2378846451 03:32:37.88 −27:46:45.1 26.4 1.89 8.9 −0.9±0.1 37 6 1 3±15 0±3 XDFU-2372446294 03:32:37.24 −27:46:29.4 27.2 3.25 8.77 −1.2±0.1 28 5 1 −34±14 −6±2 XDFU-2379146261 03:32:37.91 −27:46:26.1 27.1 2.48 8.41 −0.4±0.1 85 10 0 0±13 0±2 XDFU-2379046328 03:32:37.90 −27:46:32.8 26.8 3.38 8.25 −1.4±0.1 30 6 1 −3±14 −1±2 z∼4 Sample XDFB-2394046224 03:32:39.40 −27:46:22.4 25.5 2.94g 9.76 −1.2±0.1 119 22 45f −22±13 −3±2 XDFB-2368245580 03:32:36.82 −27:45:58.0 24.4 3.87e 9.45 −1.5±0.1 291 64 105f −6±22 −1±3 XDFB-2375446199 03:32:37.54 −27:46:19.9 25.9 4.21 9.14 −1.3±0.1 139 27 16 4±14 1±2 XDFB-2394246267 03:32:39.42 −27:46:26.7 27.1 4.99 8.73 −0.7±0.2 200 28 3 −8±13 −1±2 XDFB-2381646267h 03:32:38.16 −27:46:26.7 28.5 4.16 8.57 −0.6±0.4 50 7 0 −21±13 −3±2 z∼5 Sample XDFV-2372946175 03:32:37.29 −27:46:17.5 28.1 5.00 8.92 −1.1±0.3 38 7 2 −1±14 −0±2 z∼6 Sample GSDI-2374046045 03:32:37.40 −27:46:04.5 26.7 5.85 9.52 −1.5±0.8 71 16 34f 4±14 1±2 XDFI-2374646327 03:32:37.46 −27:46:32.7 26.4 6.49 9.35 −1.5±0.2 111 25 34f 12±14 2±2 XDFI-2364964171 03:32:36.49 −27:46:41.71 25.5 6.12 8.97 −2.0±0.2 50 14 31 −11±18 −2±2 8 The Astrophysical Journal, 833:72 (32pp ), 2016 December 10 Bouwens et al.
Table 3 (Continued)
Predicted Measured Inferred
mUV,0 f1.2mm([μJy) f1.2mm
IDa R.A. Decl. (mag) zph log10(M/Me) βb Calz.c SMCc Massc,d (μJy) LIR/(1010Le)
GSDI-2382846172 03:32:38.28 −27:46:17.2 26.2 6.12 8.66 −1.9±0.3 34 9 8 −4±14 −1±2 XDFI-2378346180h 03:32:37.83 −27:46:18.0 29.3 6.20 8.54 −0.3±0.6 87 9 0 1±14 0±2 z∼7 Sample XDFZ-2381446048h 03:32:38.14 −27:46:04.8 29.5 6.66 7.98 0.2±1.7 196 14 0 −11±15 −2±2 Notes. a
Source ID from Bouwens et al.(2015a). Otherwise selected from either a new catalog constructed here or the catalog of Rafelski et al. (2015) based on the HST WFC3/UVIS, ACS, and WFC3/IR observations over
the HUDF. C1, C2, and C5 correspond to the continuum detections identified in our blind search of our ALMA 1.2 mm observations (PaperIIfrom this series: Aravena et al.2016a). b
UV-continuum slopeβ estimated by fitting the UV-continuum fluxes to a power law (Bouwens et al.2012; Castellano et al.2012; Rogers et al.2013). cAssuming a standard modified blackbody SED with dust temperature of 35 K and accounting for the impact of the CMB on the measured flux (da Cunha et al.
2013b). dAssuming the consensus z∼2–3 relationship between the infrared excess and the inferred stellar mass of the galaxy (AppendixA).
e
Spectroscopic redshift from 3D-HST(Momcheva et al.2015). f
Tentative2σ detection of the source is expected.
g
The B435-dropout color selection criterion from Bouwens et al.(2015a) identifies galaxies with photometric redshifts as low as z∼3. We retain this source in our z∼4 sample, consistent with the B435-dropout
selection function of Bouwens et al.(2015a). h
These sources are nominally expected to be detected in our ALMA mosaic based on their very red measuredβʼs. However, the β measurements for these sources are quite uncertain. It is anticipated that a few of the reddest z=6–8 galaxies over our small field would have these colors due to the impact of noise.
9 The Astrophysical Journal, 833:72 (32pp ), 2016 December 10 Bouwens et al.
open circles indicate those sources for which a 3σ and 2σ detection, respectively, is expected in our 1.2 mm continuum observations, while the solid black circles indicate those sources for which a detection is not expected. The solid and dotted red lines indicate the lowest IR luminosities at which we would detect sources at 3σ and 2σ, respectively, over the ∼1 arcmin2ASPECS region.
To help guide the discussion that follows, we provide a complete list of the sources with expected detections in Table3. Comparisons of the actual flux measurements with estimates based upon various z∼0 IRX–β relations provide us with a quantitative sense of how much these relations have evolved from z 3, while also illustrating the source-to-source scatter. M99 found that individual sources exhibited a 0.3 dex scatter in LFIRaround the IRX–β relationship preferred in that study. If
we include a similar scatter in predicting LIR for individual
sources, we predict 36.9 2σ and 28.4 3σ detections instead of 35 and 26, respectively.
The UV-continuum slopes β we use in setting these expectations are not known precisely, especially for the faintest sources in our z=6–8 samples. In particular, if a source is measured to have an especially red β due to the impact of noise, we would predict its detection in the ASPECS data even if this source is actually intrinsically blue. The impact of the scatter is asymmetric since faint blue sources—with βʼs in the range of∼−2 to ∼−2.3 (e.g., Wilkins et al.2011; Dunlop et al. 2013; Kurczynski et al. 2014)—are already predicted to show essentially no dust emission and so the expected emission can only be larger when adding noise to the photometry of faint sources.
To determine the impact that this would have on the expected number of detected sources, we perturbed the measured βʼs for individual sources by the estimated uncertainty, and we calculated the total number of sources we would expect to find. Repeating this exercise multiple times, we found that this would boost the expected number of detections by ∼3.8 sources to 38.8 in total. This simulation result suggests that noise in the HST photometry does boost the expected numbers above what they would be in the noise-free case(by ∼11%). If we suppose that a similar correction applies to our nominal expectations for tentative detections (35 sources), ∼31.6 may be a better estimate for the expected number of tentative detections of z∼2–10 galaxies in ASPECS.
3.1.2. Expectations Using thez~2 IRX–Stellar Mass Relation and AssumingLIR=LUV
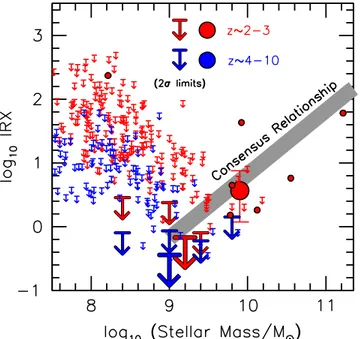
Alternatively, we can (1) use the inferred stellar masses of z∼2–10 galaxies to estimate their IR luminosities or (2) assume that the IR luminosities of galaxies match their luminosities in the rest-frame UV. Previous work at z∼0–3 (e.g., Pannella et al. 2009) has demonstrated that the infrared excess of galaxies exhibits a strong correlation with the stellar mass, and many different authors(Reddy et al.2010; Whitaker et al. 2014; Pannella et al. 2015) recover approximately the same relationship over a wide range in redshift, i.e., z∼0–3.
As an alternative demonstration of the utility of our ALMA observations, we show in the center and right panels of Figure3the expected detections in our data(red solid circles) if we assume that the luminosities of sources in the IR are either (1) dictated by the observed relationship between IRX and stellar mass at z∼2 or (2) equal to their luminosity in the
rest-frame UV, respectively. We adopt the IRX–stellar mass relation presented in Figure 18 from Appendix A, which shows the approximate consensus relationship at z∼2–3 from three separate studies(Reddy et al.2010; Whitaker et al.2014; Álvarez-Márquez et al.2016).
Fifteen and four tentative >2σ detections are expected, respectively, for those two cases.
3.1.3. Impact of the Dust Temperature
We consider the impact that the assumed dust temperature has on these results. If, for example, the mean dust temperature were equal to 30 K as found by Elbaz et al. (2011), the expected number of detections would increase quite signi fi-cantly. The totals would be 40 and 13 if we adopt the M99 IRX–β and SMC IRX–β relationships, respectively, while 20 detections would be expected based on the consensus z∼2–3 IRX–stellar mass relation.
Perhaps, even more importantly, we should consider the possibility that the dust temperature may increase quite substantially as we move out to higher redshift. A variety of work (e.g., Magdis et al. 2012; Béthermin et al. 2015) has found considerable evidence for such an evolution in the typical dust temperature from z∼1.5 to z∼4, in terms of the mean intensity in the radiation field á ñU , which is found to evolve as(1 +z)1.8 0.4 . As á ñ µU T4+b, the temperature can
be inferred to evolve as (1+z)(1.8 0.4 ) (/4+b) ~(1+z)0.32,
such that for a mean dust temperature of 35 K at z∼1.5, the implied dust temperatures at z∼4 and z∼6 are equal to 44 K and 49 K, respectively. Such temperatures are very similar to the 40±2 K found for a massive sample of z∼4 galaxies by Schreiber et al.(2016) and the 40–50 K found by Sklias et al. (2014) for typical z∼2–3 sources from the Herschel Lens Survey(Egami et al.2010). We remark that one might naturally expect an evolution in dust temperature given the observed evolution in the SFR surface densities observed in galaxies with cosmic time(e.g., Shibuya et al.2015) and the correlation of dust temperature with SFR surface density (e.g., Elbaz et al.2011).
Assuming that the dust temperatures increase monotonically toward high redshift, as (35 K)((1 + z) 2.5)0.32, we predict
that we should tentatively detect 20 sources using the M99 IRX–β relationship, three sources using the SMC IRX–β relationship, 11 sources using the consensus z∼2–3 IRX– stellar mass relationship, and zero sources assuming LIR=LUV.
3.2. Continuum Detections of Individual Sources at 1.2 mm Here we look for possible individual detections of z=2–10 galaxies over our deep ALMA continuum map at 1.2 mm. As results from the previous section illustrate, we could reasonably expect the number of detections to be modest if various IRX–β relations from the z∼0 universe serve as a useful guide.
Table4 provides a summary of the properties of the z2 sources from our catalog of 330 z=2–10 sources that are nominally tentatively detected at 2σ in our data. The measured flux density for the detected sources was derived by taking the value in our 1.2 mm continuum image at the nominal optical position of each source in our LBG samples (after correcting for the 0 3 positional offset between the ALMA and optical maps). We verified that we would retain all of our most significantly detected sources from this table if we 10
derivedflux densities for sources using other methods (e.g., by scaling the normalization of the primary beam to fit the pixels in a 3″×3″ aperture centered on a source).
Only two sources from the entire catalog are detected at? 3σ significance. They are the z=2.54 source XDFU-2385446340, where the detection significance is indeed very high, i.e., 41σ, with f1.2 mm =57114mJy, and the z=1.55 source XDFU-2397246112, where the detection significance is 10σ, with f1.2 mm =26125mJy. In Paper IVin this series (Decarli et al.2016), we discuss the far-IR SED and molecular gas properties of both sources in more detail. Based on its X-rayflux in the deep Chandra observations over the Chandra Deep Field South (Xue et al. 2011), the latter source (XDFU-2397246112) is known to host an X-ray active galactic nucleus (AGN).
Six other sources from our catalogs show convincing>3.5σ or tentative>2σ detections in our ASPECS data. However, two of these detections appear to be noise spikes. This can been seen by looking for similar >2σ detections in the negative continuum image for sources with similar stellar masses(also presented in Table4). For the sources with the highest masses (i.e., >109.75M
e), only four positive 2σ detections are found
and no 2σ “detections” in the negative images. The positive detections correspond to XDFU-2373546453, XDFU-2370746171, XDFU-2365446123, and XDFU-2384246348 with 5.1σ, 2.6σ, 2.4σ, and 2.3σ detections, respectively. Given
that there are only 13 sources in our highest-mass sample and six of them show at least a tentative >2.3σ detection in our ALMA observations(expected only 1% of the time assuming Gaussian noise), each of these detections is likely real.26
We remark that each of these four sources is also detected in the MIPS 24μm observations at 2σ significance, providing further support for our conclusions here (see Table 10 from AppendixB). This also points toward MIPS 24 μm data being a valuable probe of the infrared excess to z∼3, given its competitive sensitivity to long exposures with ALMA.
For sources with estimated stellar masses in the range 107to 109Me, tentative 2σ detections are seen in both the positive and negative images. The excess numbers in the negative image appear not to be statistically significant, because small changes to the positions where theflux measurements are made (by ∼0 1) typically result in essentially identical numbers of tentative 2σ detections in the positive and negative continuum images.
To illustrate the significance of this apparent dependence on the inferred stellar mass, we present in Figure5the fraction of Table 4
z2 UV-Selected Galaxies Showing Tentative 2σ Detections in Our Deep ALMA Continuum Observationsa
Predicted Measured Inferred
mUV,0
f1.2mm(μJy)
f1.2mm
ID R.A. Decl. (mag) zph log10(M/Me) β Calz. SMC Mass (μJy)
LIR/ (1010
Le) Tentative>2σ Detections (Most Credible)b
XDFU-2397246112(C2) 03:32:39.72 −27:46:11.2 24.4 1.55 c 11.21 0.3±0.1 1426 99 946 261±25 50±5 XDFU-2373546453(C5) 03:32:37.35 −27:46:45.3 23.7 1.85c 10.52 −0.5±0.1 1028 121 552 71±14 14±3 XDFU-2370746171 03:32:37.07 −27:46:17.1 23.7 2.24c 10.09 −1.2±0.1 350 67 306 34±14 6±2 XDFU-2385446340(C1) 03:32:38.54 −27:46:34.0 24.3 2.54c 9.90 −1.2±0.1 242 47 143 571±14 97±2 XDFU-2365446123 03:32:36.54 −27:46:12.3 24.1 1.87c 9.77 −1.5±0.1 85 19 68 38±16 7±3 XDFU-2384246348 03:32:38.42 −27:46:34.8 23.8 2.70 9.75 −2.0±0.1 46 13 181 36±14 6±2
Not Especially Credible>2σ Detectionsd
XDFU-2403146258 03:32:40.31 −27:46:25.8 27.6 1.55 8.21 −1.9±0.1 1 0 0 54±26 10±5 XDFB-2355846304 03:32:35.58 −27:46:30.4 29.9 4.06 8.15 −1.9±1.0 1 0 0 71±26 11±4
>2σ “Detections” in the Negative Continuum Image
XDFU-2372446294 03:32:37.24 −27:46:29.4 27.2 3.25 8.77 −1.2±0.1 28 5 1 −34±14 −6±2 XDFU-2390646560 03:32:39.06 −27:46:56.0 26.7 2.42 8.75 −1.5±0.1 12 3 1 −82±38 −14±7 XDFU-2390446358 03:32:39.04 −27:46:35.8 28.1 3.25 8.62 −2.0±0.2 1 0 0 −33±14 −6±2 XDFU-2375346041 03:32:37.53 −27:46:04.1 26.4 1.96 8.26 −2.1±0.1 1 0 0 −32±14 −6±3 XDFU-2369446426 03:32:36.94 −27:46:42.6 28.6 1.60 8.08 −1.3±0.2 2 0 0 −32±14 −6±3 XDFB-2401746314 03:32:40.17 −27:46:31.4 28.3 4.01 8.21 −2.0±0.3 1 0 0 −56±26 −8±4 XDFV-2385645553 03:32:38.56 −27:45:55.3 29.8 5.07 6.99 −1.6±0.9 3 1 0 −72±26 −10±4 XDFZ-2375446018 03:32:37.54 −27:46:01.8 29.3 7.05 7.85 −2.3±1.5 0 0 0 −40±16 −6±2 Notes. a
Columns in this table are essentially identical to those in Table3. b
The reality of each of these tentatively detected sources is supported by there not being any comparable detections of>109.75Mesources in the negative continuum images and each of these sources also showing a detection in the MIPS24 m observationsm (see Table10from AppendixB).
c
Spectroscopic redshift from 3D-HST(Momcheva et al.2015).
d
While fewer low-mass(<109Me) galaxies are tentatively detected at >2σ in the positive continuum image than in the negative continuum image, this appears not to be statistically significant. The use of spatially offset positions (by 0 3) to measure the flux in sources typically results in an essentially equal number of tentative >2σ detections in the positive and negative continuum images.
26
Our conclusions here differ significantly from what we would conclude based on a blind search for>2σ detected sources across the entire 1 arcmin2 mosaic(where the fidelity is only 25% for sources with flux densities between 30 and 40μJy: PaperII: Aravena et al.2016a). With a blind search, one has
many opportunities tofind tentative >2σ-detected sources; however, for the present high-mass sample, one only has 13 opportunities.
11
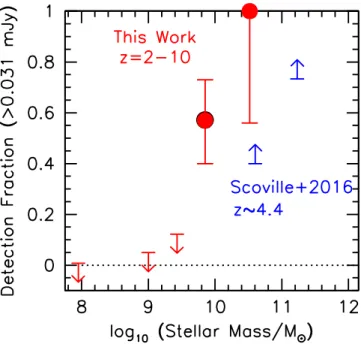
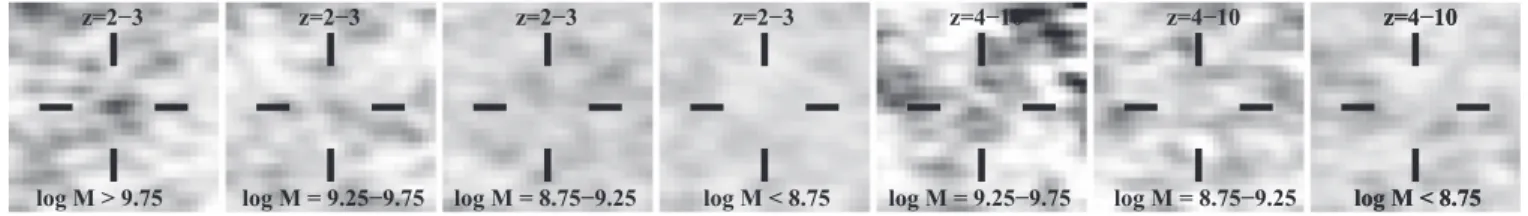
detected z=2–10 galaxies versus mass, after correcting the positive >2σ detections in a mass bin for the >2σ detection seen in the negative image. For this figure, we consider only those sources (172 out of 330) over the ASPECS field for which the 1.2 mm continuum senstivities are the highest, i.e., with 1σ rms noise <17 μJy.63-+1714% of the galaxies with stellar
mass estimates >109.75 Meare detected; none of the sources with masses lower than 109.75Meis detected. Dust-continuum emission shows a clear connection with the apparent stellar
mass in galaxies—which is similar to a few prominent earlier predictions for the expected findings from a deep far-IR continuum survey over the HUDF with ALMA(da Cunha et al. 2013b).
As a separate illustration of the predictive power of stellar mass in estimating the approximate luminosity of galaxies in the IR, we present in Figure6the range in stellar mass versus redshift probed by our HUDF sample and indicate the sources we identify as detected in red(open and solid circles detected at >3σ and 2σ–3σ, respectively) and those we identify as only found in a blind search in green(ASPECS Paper II: Aravena et al.2016a). The sources we detected at >3σ also appear in the blind search of Aravena et al.(2016a). It is clear that stellar mass is a good predictor of which sources are IR-luminous, for galaxies with z>1.5. The stellar masses used for constructing Figure 6 are taken from the 3D-HST catalogs (Skelton et al. 2014) if at z<1.5 (if available); otherwise, they are inferred as in Section 2.3. For the most obscured systems, estimates of the redshift and stellar mass can be quite uncertain (given degeneracies between dust and age and the challenge in locating spectral breaks), so some caution is needed in interpreting thisfigure.
We now return to discussing continuum-detected sources in ASPECS. 1.2 mm continuum images of the six sources showing meaningful detections are presented in Figure 4 together with their HST and Spitzer/IRAC images. We remark that the detected sources in the present samples are much fainter than those identified in many previous programs. For example, the typicalflux measured by Scoville et al. (2016) for detected z∼4.4 galaxies in their very high-mass (2×10¹⁰ Me) sample is ∼200 μJy, which contrasts with the ∼35 μJy Figure 4. HST B i H435 775 160(left), IRAC 3.6 μm (middle), and 1.2 mm
ALMA-continuum images(right) for six z∼2–3 galaxies that we detect (>3.5σ) or tentatively detect(>2σ) in our 1 arcmin2deep ALMA map over the HUDF. The size of the stamps is 7 2×7 2. The positions of our 1.2 mm continuum detections relative to the positions of sources in our HST or Spitzer/IRAC images are illustrated in the left and center stamps with the 2σ, 4σ, 6σ, 8σ, and 10σ contours (white lines). Light from neighboring sources on the IRAC images has been removed for clarity. Significantly enough, these sources are among the 13 z=2–10 candidates from that 1 arcmin2region with the highest stellar mass estimates. All six have estimated stellar masses 109.75Me. Given evidence that dust emission from star-forming galaxies correlates with stellar mass in many studies(e.g., Pannella et al. 2009,2015; Reddy et al.2010; Whitaker et al.2014; Álvarez-Márquez et al.2016), these sources are among
the six sources most likely to show dust emission from our entire z=2–10 LBG selection. The fact that each of them shows ALMAflux at 2.3σ seems to confirm that stellar mass is an especially useful predictor of dust emission for normal star-forming galaxies at z 2. Each of these sources also shows evidence for being detected(2σ) in the MIPS 24 μm observations (Table10
from AppendixB).
Figure 5. Fraction of tentatively detected (>2σ) z=2–10 galaxies in our ALMA 1.2 mm continuum observations vs. the inferred stellar mass(solid red circle). Errors and upper limits are 1σ. Only the 172 z=2–10 galaxies where our 2σ continuum sensitivity is highest (<34 μJy) are included in this determination. The blue upward-pointing arrows are from Scoville et al.(2016)
and indicate lower limits on the detected fraction(i.e., at >0.031 mJy) based on the results of that study. Stellar mass appears to be a very good predictor of dust emission in z=2–10 galaxies, with five of the eight >109.75Megalaxies probed at the requisite sensitivity being detected at>2σ (and several other >109.75
Me galaxies probed by our field show measured 1.2 mm fluxes consistent with the other measurements).
12
seen in the three faintest z∼2–3 galaxies tentatively detected here. The observed differences in the typicalfluxes of detected sources are a natural consequence of the relative sensitivities of the data sets, i.e., 12.7μJy beam−1 rms for ASPECS versus 65μJy beam−1rms in the observations of Scoville et al.(2016).
3.3. Stacked Constraints on the Infrared Excess In addition to looking at which z=2–10 galaxies over the HUDF we can individually detect in our ALMA continuuum observations, we can gain powerful constraints on dust emission from high-redshift galaxies by stacking. For this, we subdivide our samples in terms of various physical properties and then make a weighted stack of the ALMA-continuum observations at the positions of the candidates.
For sources included in the stack, we map the ALMA continuum maps onto the same position and weight the contribution of each source to the stack according to its expected 1.2 mm continuum signal assuming LIR∝LUV and
according to the inverse square of the noise (per beam). We
derive a flux from the stack based on a convolution of the image stack(3 3×3 3 aperture) with the primary beam. No spatial extent is assumed in the stackedflux.
3.3.1. IRX versus Stellar Mass
We begin by looking at the average inferred infrared excesses of z=2–10 galaxies as a function of the stellar mass. Segregating our samples in terms of stellar mass certainly is a logical place to start. Not only is there strong support in the literature for such a correlation at lower redshifts(e.g., Pannella et al.2009,2015; Reddy et al.2010), but there is evidence for this correlation being present in our own limited samples(see Section3.2).
In Figure 7, we show the stacked 1.2 mm continuum observations of z=2–3 and z=4–10 galaxies in four different bins of stellar mass: >109.75Me, 109.25–109.75 Me, 108.75–109.25Me, and<108.75Me. For these stacks, we weight sources according to the square of the expected signal in the Figure 6. Stellar mass vs. redshift range covered by sources identified over the ∼1 arcmin2ASPECS region, with light, medium dark, and dark gray indicating regions where 1, 3, and 7 sources are found (where each region subtends ΔM∼0.5 dex× Δz∼1). Large filled red circles indicate those sources where continuum detections(>3.5σ) are found in both the present study and PaperIIof the ASPECS series(Aravena et al.2016a). Green circles indicate sources that are found only in
PaperIIof ASPECS(Aravena et al.2016a). Open red circles indicate those galaxies that show tentative >2σ detections in ASPECS. 100% and 37% of the
star-forming z=1.5–3.0 sources in the stellar mass rangeslog10(M M)>10.25and 9.75–10.25 (indicated with the red boxes), respectively, show detections in the ALMA continuum 1.2 mm data. It is clear that stellar mass is an especially useful predictor of IR luminosity over a wide range in redshift. Inspiration for thisfigure came in part from Figure 6 of Dunlop et al.(2016).
Figure 7. Stacked 1.2 mm continuum images (9″×9″) for all candidate z=2–3 and z=4–10 galaxies falling in four different ranges of stellar mass (< 108.75M e, 108.75to 109.25Me, 109.25to 109.75Me, and>109.75Me). In the stacks, sources are weighted according to the square of their UV flux and the inverse square of the noise. The three sources from this analysis individually detected at>4σ are not included in the stack results shown in this figure.
13