UNIVERSITÀ DEGLI STUDI DI SASSARI
CORSO DI DOTTORATO DI RICERCA
Scienze Agrarie
Curriculum Scienze e Tecnologie Zootecniche
Ciclo XXXIAPPLICATION OF GENOMIC TOOLS TO BREEDING AND TO GENETIC STRUCTURE STUDIES
IN LIVESTOCK POPULATIONS
dr. Alberto Cesarani
Direttore della Scuola prof. Ignazio Floris Referente di Indirizzo prof. Corrado Dimauro
Docente Guida prof. Nicolò Pietro Paolo Macciotta
Tutor dr. Giustino Gaspa
Acknowledgements
I want to acknowledge Prof. Nicolò Pietro Paolo Macciotta for his constant openness and for the several great opportunities that he offered me during my PhD course. I want to express my gratitude to Dr. Giustino Gaspa and Dott.ssa Silvia Sorbolini for helping me during my work.
Thanks to genetic research group and all my colleagues of the “Scienze Zootecniche” unit of the department of Agriculture of the University of Sassari.
I would also thank Prof. Ignacy Misztal and Prof. Daniela Lourenco for the kind hospitality and helpfulness to teach me their work, as well as all people I met at the Animal Breeding and Genetics Group of the University of Georgia.
Index
CHAPTER 1 ... 1
General introduction ... 1
Introduction ... 2
a. Animal breeding and advances in molecular genetics ... 3
b. Genomic selection methods ... 9
Genetic variability in animal populations ... 14
a. Tool for studying of genetic diversity and application to livestock conservations ... 14
c. Linkage disequilibrium in animal population ... 19
d. Runs of homozygosity ... 23
Objective of the Thesis ... 25
References ... 26
CHAPTER 2 ... 45
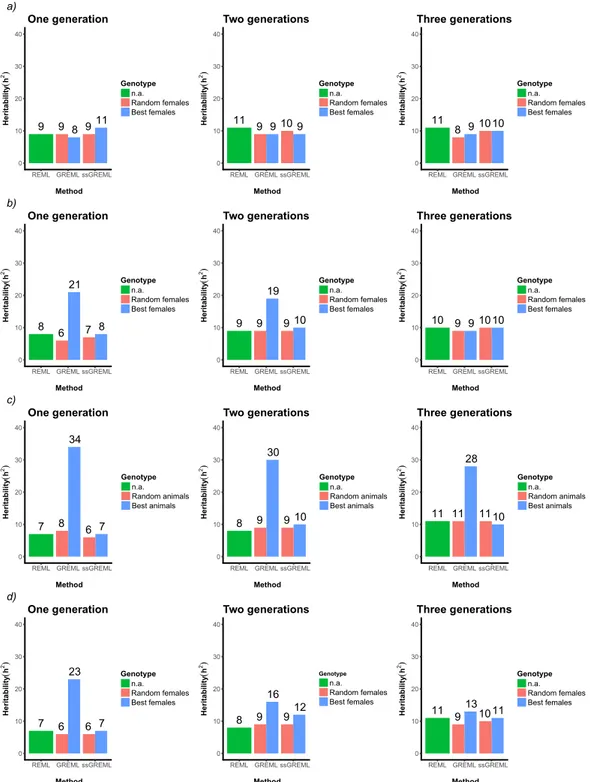
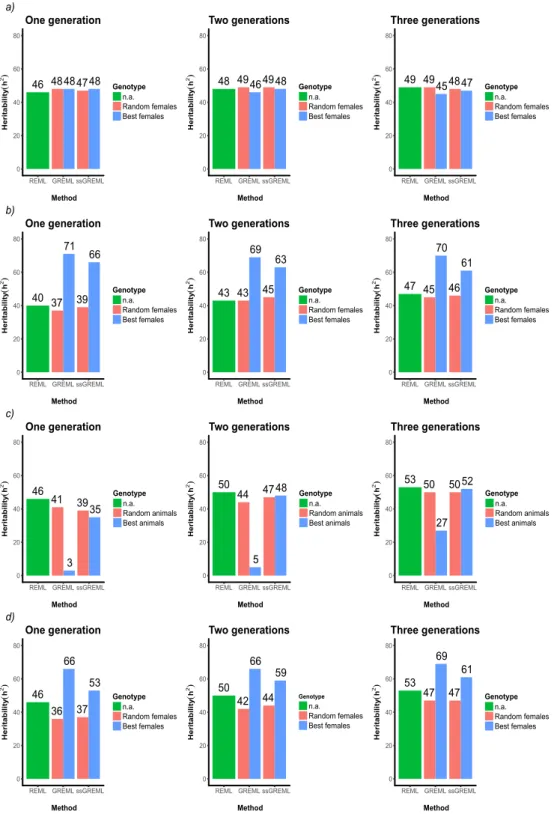
Bias in heritability estimates from genomic restricted maximum likelihood methods under different genotyping strategies ... 45
Abstract ... 46
Introduction ... 47
Materials and methods ... 49
Data ... 49
Models and analysis ... 53
Results ... 54 Discussion ... 62 Conclusions ... 66 Acknowledgements ... 67 References ... 68 Appendix Chapter 2 ... 75 CHAPTER 3 ... 82
Genomic selection of milk fatty acid composition in Sarda dairy sheep: effect of different phenotypes and relationship matrices on heritability and breeding values accuracy ... 82
Abstract ... 83
Introduction ... 85
Data ... 87
Variance component estimation ... 89
Breeding Value Predictions ... 91
Results ... 92
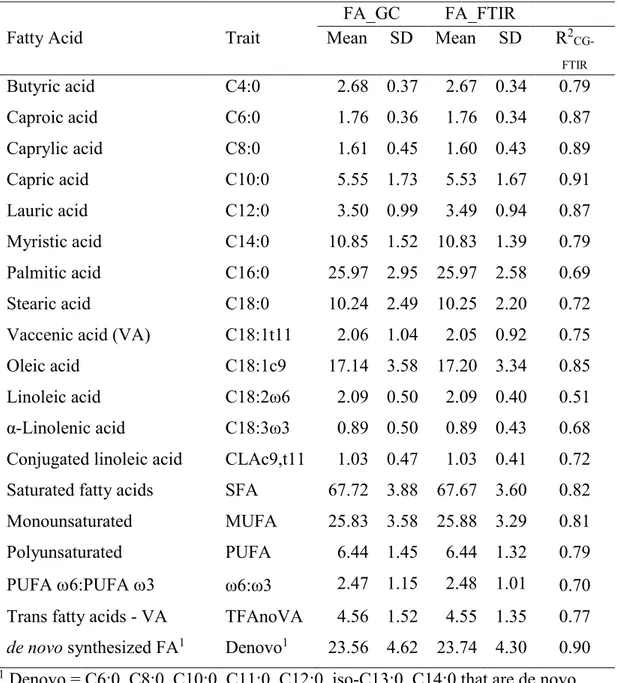
Genetic Parameters of Milk Fatty Acid profile ... 93
Accuracy of EBV and GEBV predictions ... 98
Discussion ... 103
Genetic Parameters of Milk Fatty Acid profile ... 104
Accuracy of EBV and GEBV predictions ... 107
Conclusions ... 108
Acknowledgements ... 109
References ... 110
Appendix Chapter 3 ... 120
CHAPTER 4 ... 123
Genome-wide variability and selection signatures in Italian island cattle breeds ... 123
Abstract ... 124
Introduction ... 126
Materials and methods ... 129
Animals and genotypic data ... 129
Heterozygosity, Minor allele frequency and Linkage Disequilibrium ... 130
Multi-dimensional scaling and admixture analysis ... 130
Wright Fixation Index and LOWESS ... 130
Runs of homozygosity ... 131 Gene discovery ... 132 Results ... 132 Discussion ... 142 Conclusion ... 148 Acknowledgments ... 149 References ... 150 Appendix Chapter 4 ... 159 CHAPTER 5 ... 163
The use of different statistical approaches highlights consensus signatures of selection harboring diversity among sheep breeds ... 163
Abstract ... 164
Materials and methods ... 169
Breeds and animals ... 169
Genotyping ... 170
Population stratification and admixture ... 170
Fixation Index (FST) ... 170
Canonical Discriminant Analysis (CDA) ... 171
Runs of Homozygosity Analysis (ROH) ... 172
Genes Annotation, QTLs and Functional Analysis ... 172
Results ... 174
Detection of significant SNPs with FST, CDA and ROH approaches ... 174
Detection of signatures of selection ... 177
Selection signatures shared among procedures ... 178
Candidate gene discovery, functional annotation and QTLs ... 182
Discussion ... 186 Conclusions ... 192 References ... 194 Appendix Chapter 5 ... 207 CHAPTER 6 ... 241 General conclusion ... 241
CHAPTER 1
General introduction
Introduction
Modern genetics is usually considered to have started with the rediscovery of Mendel’s paper in 1900. Genetic selection for enhance productivity or fitness traits gave impressive results in the last 50 year due to the implementation of the Fisher’s infinitesimal model – that assume infinite number of loci with infinitesimal effects underlying the observed phenotypes – in the mixed models statistics framework.
The expected genetic progress (ΔG) of a breeding scheme is generally evaluated through the breeders’ equation developed by Rendel and Robertson (1950): ∆𝐺 = 𝑖∙𝑟
𝑇 𝜎𝐴 that positively associates ΔG to intensity of selection (i), accuracy of
breeding values (r) and genetic variation (𝜎𝐴) and negatively to generation interval (T).
Moreover, the introduction of best unbiased linear predictor (BLUP) methodology for predicting the genetic merit of a selection candidate represented a breakthrough in the animal quantitative genetics in the late-seventies of the past century.
More recently, genomic selection – based on extensive genotypization for thousands of single nucleotide polymorphisms (SNPs) along animal genomes – has transformed breeding programs worldwide providing more accurate estimated breeding values (EBVs) of selection candidates, especially of those without own records or daughters’ information. Genomic selection has had a big impact on the accuracy and generation interval terms of the breeders equation. Under some preconditions, mainly about the size of genotyped population and the SNP density, genomic selection allowed to give to an animal a more reliable EBV at birth, with a great advantage over traditional quantitative breeding, especially for those traits that are recorded late in life, sex limited or expensive to measure.
If on the one hand the extensive use of advanced selection strategies has doubled production performances of farm animals, on the other hand a general reduction of biodiversity (e.g. number of breeds raised) and, with some exceptions, a general increase of within breed homogeneity have been observed worldwide. Despite of that, the current and large availability of genomic tools at affordable price might allow to cope with these emerging issues. In particular, the SNP marker scan be used both to estimate the genetic diversity among breeds and the within breed degree of homogeneity. The use of genomic tools may be helpful to safeguard endangered population or to control inbreeding in small population where no pedigree records are available.
a. Animal breeding and advances in molecular genetics
The application of genetics to the evaluation of animals and to the improvement of their productions revolutionized this industry and laid the foundations for the modern animal breeding and genetics’ disciplines. Later on, the animal genetic divided into two main branches: quantitative genetics and molecular genetics. The main steps of quantitative genetics were: the proposal of selection index as tool for choosing the parents of the next generation (Hazel, 1943); the application on large dataset of best linear unbiased prediction animal model (BLUP, Henderson, 1975) in order to predict animal breeding values (Gianola et al., 1988); the use of complex statistical models for genetic evaluation, such as animal model, test day model or random regression
model (Kennedy et al., 1988; Jensen, 2001; Schaeffer, 2004). The combination of use
of genetic markers, linkage analysis and measured phenotypic trait, allowed to identify quantitative trait loci (QTLs) for farm animal species (Dekkers and Hospital, 2002;
Dekkers, 2004). QTLs are DNA regions associated with quantitative traits of economic interest. After several years of study about QTL, public datasets with information about productive characters were created (http://www.animalgenome.org/cgi-bin/QTLdb/index).
However, the development of affordable genome sequencing techniques represented the most important insight of molecular genetics both for animal breeding and genetics field. The DNA sequencing technique dated 1975 when this concept was introduced in the scientific community (Sanger, 1975). Thirty years later, in the early 2000th, novel DNA sequencing method open new frontiers: the high-throughput next
generation sequencing (HT-NGS) completely replaced the Sanger based sequencing methods (Pareek et al., 2011). The main advantages of NGS over the Sanger based method are the highly automatization and parallelization of workflow, both reflecting in a dramatic reduction of the time needed to sequence a DNA sample. The main consequence of the introduction of NGS has been the drastic reduction of cost of a complete genome sequence (Altman et al. 2012). Just as example, in the nineties of the past century about $3‐billion project were spent to sequence the human genome producing a “rough draft” of the genome in 2001 (Weller et al., 2016). In the 2008-2012 period, while a project aimed at sequencing the genome of at least 1000 of human individuals was completed (1000 genome project, 2012) the first complete genome sequence of a cow was also obtained (Bovine Genome Sequencing and Analysis Consortium et al., 2009). Three years later (2012) the 1000 bull genomes project was launched in cattle (Daetwyler et al.2014). Since the discovery of microsatellites in 1990 costs for obtaining individual genotype were dramatically reduced from $10 per each marker to $0.002/marker typed (Weller et al. 2016).
This sequencing process allowed to find several variants in the genome that can be used as molecular markers such as mitochondrial DNA (mtDNA), microsatellites, SNPs, insertion or deletion (INDEL) (Yamey, 2000). Mitochondrial DNA are small plasmids that can be found only in mitochondrial organelle that have some inherent characteristics: it shows a strong variability within species, has an almost exclusive maternal inheritance and it is not affected by recombination. The mtDNA has been the reference molecular markers for domestication studies since their maternal inheritance only (Bruford et al., 2003; Naderi et al., 2008; Di Lorenzo et al., 2015). Microsatellite markers, known also as simple sequence repeats (SSRs), identified short repeated sequences (usually less than 6 base pairs ex poly(TG) sites) that can be found several times along the genome: their origin can be ascribable to the DNA polymerase sliding during DNA replication. SNPs identify a variation of a single nucleotide across the genome (Figure 1), that is a single base change in DNA (Vignal
et al., 2002). In animal genome, SNPs markers are usually bi-allelic.
Figure 1. Example of Single Nucleotide Polymorphism (SNP)
In the first draft of human genome, a total of 1.4 Millions of SNPs has been discovered, with an average distribution of 1.9 marker each kb (Sachidanandam et al., 2001, Abdel-Mawgood, 2012).
In animal genetics, first genome-wide linkage maps had 150-200 markers (15-20 centimorgan between each one on bovine genome) and were used to find QTL with whole genome scan, with high confidence interval though. The biggest problem of this type of map was that in the interval between two adjacent markers can harbor up to 50-60 genes. Only in 2009, the Bovine Genome Sequencing and Analysis Consortium (www.bovinegenome.org) produced the reference sequence of taurine genome. Fan et
al. (2010) reported the number of discovered SNPs in some animal genomes. In cattle,
The Bovine HapMap Consortium (2009) detected around 2.2 million SNPs (with an average distance between two SNPs of 1 kb). In 2012, the International Sheep Genomics Consortium (ISGC) started to assemble the ovine reference genome using both Sanger and NGS sequencing (www.sheephapmap.org): this project allowed to discover 2.8 million of SNPs. In horse (Wade et al., 2009) and chicken (International Chicken Polymorphism Map Consortium, 2004), around 1.1 million SNPs and 2.8 million SNPs were highlighted, respectively. In 2014, Daetwyler et al. analyzing several bull genomes of different breeds (1000 genome Project), sequenced using NGS platform, found about 28 millions of variants (26.7 Million SNPs and 1.6 Million INDEL).
Starting from the genome sequencing and knowledge about SNPs, genome maps with medium and high density (with an interval between two markers < 1 cM) of these polymorphisms were created. The subsequent step was the commercialization of SNP beadchips (Figure 2), that allows to automatically genotype tens of DNA
samples with hundreds of thousands of SNPs starting from blood, saliva or male semen (Matukumalli et al., 2009).
Figure 2. BovineSNP50 v3 DNA Analysis BeadChip (www.illumina.com).
In Table 1, the most common commercial SNP beadchips are reported. SNPs are very useful also because are markers that divide the animal genome and circumscribe the information of these small DNA regions. A plus point of SNPs is that they simplify genomic studies because the total amount of DNA information (billions of base pairs) is conveyed in a smaller sample of base pairs (~ 50 thousand bps). Due the high number of SNPs and their uniform distribution along the animal genome, some of them could be near a QTL and, therefore, they could explain a fraction of the trait variance allowing to map QTL more precisely.
Table 1. Commercial SNP chip for most common domesticated species (via
http://bioinformatics.tecnoparco.org/SNPchimp/).
Species Producer Chip name SNPs
Cattle Illumina Bovine 3k BeadChip 2,900 Bovine LD BeadChip 6,909 BovineLD v1.1 6,912 BovineLD v.2 7,931 BovineSNP50v1 BeadChip 54,001 BovineSNP50v2 BeadChip 54,609 BovineHD BeadChip 777,962 GeneSeek Dairy Ultra LD v2 7,049 Genomic Profiler LD v1 8,610 Genomic Profiler LD v2 19,721 Genomic Profiler LD v3 26,151 Genomic Profiler HD 76,879 Genomic Profiler HD v2 139,480
ICBF International Dairy and Beef v2 17,807
International Dairy and Beef v3 53,262
Affymetrix Axiom Bovine 648,875
Sheep Illumina Infinium Ovine SNP50 v1 BeadChip 54,241
AgResearch OvineHD BeadChip 606,006
Goat IGGC CaprineSNP50 BeadChip 53,347
Pig
Illumina Infinium PorcineSNP60 v1 BeadChip 62,163
Infinium PorcineSNP60 v2 BeadChip 61,565
GeneSeek-Neogen Genomic Profiler 10k BeadChip 10,241
PorcineSNP80 BeadChip 68,528
Affymetrix Axiom PorcineHD 658,692
Horse
Illumina Infinium EquineSNP50 BeadChip 54,602
GeneSeek EquineSNP65 BeadChip 65,157
Affymetrix Axiom EquineHD 670,796
b. Genomic selection methods
One of the main applications of SNP beadchips in animal breeding has been defined “genomic selection”. The use of thousands of SNP genotypes in the genetic evaluation of animals deeply changed the breeding schemes and their response. At the beginning, selection programs were based only on phenotypes recording and relationship among animals. These breeding programs took advantages from pedigree and the related pedigree relationship matrix (A). The A matrix is constructed according to the relationship coefficients among animals: e.g. sire/dam and offspring 0.5, grandparents and grandchild 0.25, half-sibs 0.25 etc. Pedigrees are used to identify the additive relationship coefficients that is the proportion of genes shared because inherited from a common ancestor.
The possibility of incorporate information deriving from molecular markers in the design of new breeding schemes was initially termed marker assisted selection (MAS) (Fernando and Grossman, 1989; Lande and Thompson, 1990) and was based on the combination of breeding values and DNA microsatellite information. Theoretically, MAS should have been replaced by genes assisted selection (GAS), once the causative mutations affecting economic traits had been discovered (Ron and Robertson, 2007). However, the major revolution in the animal breeding has been represented by genomic selection (GS) as formalized in influential papers by Meuwissen et al. (2001) and Schaeffer (2006).
The first step prior to start with a breeding program, either traditional or genomic assisted, is the calculation of variance components (Hofer, 1988; Misztal, 2008). Variance components are used to indicate variation in animal populations; they are usually identified using σ2 and they are divided in phenotypic, genetic and
environmental. According to Falconer and Mackay (1996) the genetic variance is further scattered in additive, dominance and interaction. The additive variance is the variance portion which account for breeding values variation. Two main methods are used to calculate variance components: restricted maximum likelihood (REML) and Bayesian (Thompson et al., 2005; Misztal, 2008). The majority of animal traits of human interest (e.g. milk production, meat production, sport performance in horse, etc.) is heritable and it means that related animals show more similar phenotypic expressions than unrelated: this implication is used to estimate variance components and to separate the portion due to the genetic from the one due to the environment. Variance components are used to calculate the heritability (h2) of one trait, usually
defined as the ratio between the additive animal variance and the total phenotypic variance, i.e. as the fraction of phenotype determined by the individual genome (Falconer and Mackay, 1996). Another involvement that must be considered in order to engineer a breeding program is the involved traits, specifically if qualitative or quantitative. Quantitative traits (e.g. milk production, average daily gain, etc.), representing the major traits of livestock, show continuous variability, can be measured using a metric scale, and are under polygenic control. According to the infinitesimal model, all genes affecting a quantitative trait have an infinitesimal effect. Most of the quantitative traits present a frequency distribution similar to the normal distribution. On the other hand, qualitative traits (e.g. coat color, disease resistance, etc.) show discontinuous variability and they are controlled only be one or few genes.
After the first QTL detection experiments, MAS selection took hold (Boichard
et al., 2002; 2006; Bennewitz et al., 2004) in French and German cattle breeds. MAS
(milk could be registered only in females) and the generation interval was long. MAS was implemented with the goal to increase the reliability of breeding values and select for new functional traits (for example fertility). A simulation on the application of MAS program demonstrated that the increase of the breeding value reliability was rather limited (larger for sons of sires with genotyped progeny daughters with records), nonetheless the high number of genotyped animals (Guillaume et al., 2008)
As previously told, GS is the latest proposed methodology to evaluate and to select candidate animals. GS can be performed using different model and methods: SNP-BLUP, genomic BLUP (GBLUP), Bayesian (BayesA, B, C, Cπ-R etc.) or multivariate techniques (VanRaden et al., 2008; Gianola et al., 2009; Moser et al., 2009; Macciotta et al., 2010). Regardless of the statistical method, GS considerably reduced generation interval because it allowed to estimate breeding value at candidate birth (VanRaden et al., 2009).
Most of the GS application involved so called two-step GBLUP models. In GBLUP A matrix has been replaced by the genomic relationship matrix (GRM or G), that use genetic information to establish parental relationship among animals (Goddard and Hayes, 2007). The cornerstone of GS is the genomic breeding values (GEBV) that combine, with different weight, direct genomic value (DGV) estimated from individual SNP effects and traditional EBV (VanRanden et al., 2008).
Recently, a new methodology for GS has been developed: the single step genomic evaluation that combine pedigree and genomic information at the same time. Single-step GBLUP (ssGBLUP) exploits contemporarily phenotypic, pedigree and genomic information, whereas the previous methods were planned in subsequent different steps (Aguilar et al., 2010). In this method, the two relationship matrices
integrated in traditional or GBLUP animal model (i.e. A and G) are blended in one unique matrix identified with the H letter. The main advantages of ssGBLUP are the simplicity of implementation, without extensive change in the mixed model equation settings.
GS is strongly applied in dairy cattle breeding schemes (Hayes et al., 2009; VanRaden et al., 2009; Pryce and Daetwyler, 2012) and pigs (Ostersen et al., 2011; Wellman et al., 2013), but with less emphasis in other farm animal species, even if GS in sheep is gaining popularity (Van der Werf, 2009; Daetwyler et al., 2010; Duchemin
et al., 2012).
Objectives of selection programs are highly varied over the years: next to the traditional improvement of the yield (milk, meat, eggs…) composition (e.g. fat and protein content in the milk), conformation or the production and disease resistance (e.g. mastitis or scrapie), novel traits (e.g. milk coagulation properties, milk and meat fatty acids content, residual feed intake, methane emissions, etc.) are coming onstage or could be integrated in the future breeding schemes.
The huge increase of livestock production was mainly due to better farm management, functional nutrition system and genetic improvement: thanks to increasingly precise breeding programs, livestock production drastically increased in the last 60 years (World Livestock 2011; Alexandratos and Bruinsma, 2012).
Regarding disease resistance, an example can be the scrapie in the sheep. It is a disease already known about 250 years ago; Dickinson (1968), studying Britannic sheep breeds, showed the individual variability for the disease sensibility. This disease was spread in France, United Kingdom, Italy (Macciotta et al., 2005). The prion protein gene was identified as the responsible. The prion protein is a membrane protein
with a not well-known role in the organism. The altered structure is accumulated in the nervous tissue of the affected animals. Mutations of the prion protein have been associated with different resistance levels: the ARR allele was the most resistance (with dominant effect), while the VRQ allele was the most sensitive. The scrapie disease was eradicated by choosing only rams with ARR allele. Several studies analyzed this phenomenon (Barillet et al., 2002; Hurtado et al., 2002; Macciotta et al., 2005; Ligios et al., 2006; Palhiere et al., 2008).
Moreover, with the increased availability of records about the abovementioned new phenotypes, several researches are being conducting in order to establish the possibility to implement this kind of data in the breeding schemes. The genetic background of fatty acid profile has been investigated both for milk (Soyeurt et al., 2007; Mele et al., 2009, Hein et al., 2018) and meat (Cecchinato et al., 2012; Chiaia
et al., 2017) in cattle. Recently, some studies, even if without a homogeneity of goals
and techniques, have been carried out also in dairy (Moioli et al., 2012) and meat (Rovadoscki et al., 2018) sheep. Few researches on beef cattle were directly oriented to genomic selection for FA composition (Uemoto et al., 2011; Chen et al., 2015; Zhu
et al., 2017).
Still, to restrict the farm costs and pollution, future breeding programs will be aimed at improving residual feed intake (RFI) and methane emissions. Luckily, these two traits are strongly related: studies about possible selection schemes aimed to reduce the RFI demonstrated that could also bring to a drop of methane emitted by animals (Alford et al., 2006). Finally, some researchers analyzed the role of enteric methane emission in the farm management and breeding decisions (Negussie et al., 2017).
Genetic variability in animal populations
a. Tool for studying of genetic diversity and application to livestock conservations
Although the use of SNP marker has been applied for improving livestock performance through genomic selection (Schaeffer, 2006; Hayes et al., 2009; VanRaden et al., 2009; 2011) in recent times genomics is widely applied also on genetics and biodiversity (Peter et al., 2007; Bovine HapMap Consortium, 2009; Kijas et al., 2009; 2012; Ciani et al., 2014; Sharma et al., 2016; Upadhyay et al., 2017; Colli
et al., 2018; Mastrangelo et al., 2018; Stella et al., 2018), conservation genomics
(Allendorf et al., 2010), linkage disequilibrium estimation (Grossi et al., 2017; Prieur
et al., 2017; Snelling et al., 2017), runs of homozygosity analysis (Ferenčaković et al.,
2011; Marras et al., 2015), genome-wide association studies GWAS (Hayes et al., 2010; Mai et al., 2010; Peñagaricano et al., 2012; Zhang et al., 2013; Macciotta et al., 2017; Martinez-Royo et al., 2017), relationship between environment and animal genome (Manel et al., 2003; Finocchiaro et al., 2005) and the occurrence and spread of animal diseases (Becker et al., 2010; Testoni et al., 2012; Zhao et al., 2012).
The study of genetic biodiversity of farm animals and its conservation and safeguard is becoming increasingly relevant. The main issue is that a big portion of this genetic diversity has been unknowingly already lost: lots of plant varieties or animal breeds are disappearing and without precise figures about the exact amount of this loss. Moving in this scenario, Scherf (2000) published for the Food and Agriculture Organization of the United Nations (FAO) his “World watch list for domestic animal diversity”. The aim of this book was to monitor the animal genetic biodiversity about mammalian and avian species, trying to classify animal breeds in
extinct, at risk and safe breeds. Moreover, in 2007 FAO organization published the World’s Animal Genetic Resources that debated about the animal history and domestication, the actual status of animal genetic resources, and the future challenges and management of genetic resources (www.fao.org).
The domestication of animals doubtless symbolized one of the most important events for humanity: this occurrence sealed the passage from hunting to cultivators and breeder mankind and therefore was the first step of human sedentary settling (Larson and Fuller, 2014). Through domestication, mankind caused significant morphological and physiological changes in animal and plants: the new characteristics of domesticated individuals discriminated between tamed animals and their ancestors (Ryder, 1983). After dog, sheep was the first domesticated species occurred in the Fertile Crescent at ca. 10,000-9,500 (Clutton-Brock, 1987; Zeder, 2008) and some studies allowed to trace this process (Bruford et al., 2003; Chessa et al., 2009). Sheep was earlier chosen for domestication thanks to its several advantageous characteristics, i.e. small size and versatile productions (meat, milk and wool). Ryder (1983) highlighted that domestication of sheep lead to a reduction of body size and of the horn length if compared with its wild ancestor. Simultaneously, also the domestication of cattle and goat, occurred nearly at the same time in the Fertile Crescent while pigs and buffalo domestication somewhere in the southwest Asia; on the contrary, horse seems to be the last major species that has been domesticated in several independent occasions and places (Bruford et al., 2003).
An overview of modern domestic species reveals a variety of different breeds within each species that are the results of years of crossbreeding and different selection ways. The concept of cattle breeds emerged in the 18th century in Britain primarily
based upon the experiences of Robert Blackwell (Porter, 1991). At a later time, Felius (1995) in his “Cattle breeds: an encyclopedia” described more than 700 different cattle breeds. Instead, at the moment, the known sheep breeds that are raised worldwide are approximately 200 pure and 400 composite ones (Rasali et al., 2005).
The domestication shaped the genome of farm animals: this human action became the first unaware genetic application in animal science because, choosing animal to domesticate, men also chose genes controlling those phenotypes. Indeed, domestication can be defined as the animals and plants genetic adaptation to better suit the human needs (Bruford et al., 2003). Conversely, the aware genetics application on plant science started on 1923 when Karl Sax showed the first evidence that genes control both qualitative and qualitative traits.
The domestication history and the modern breeds can be studied using genetics population approach. The bedrocks of this discipline are Darwin, Mendelian and Hardy-Weinberg laws. The latter affirms that in an infinitely large population distinguished by random matings (with no selection, mutation or migration) there is an equilibrium of allelic and genotype frequencies, unless something from outside happens (Hartwell et al., 2004). Populations showing these constant gene and genotype frequencies through generations are defined to be in Hardy-Weinberg
equilibrium (Falconer and Mackay, 1996).
In summary, the process of animal domestication and the consequent selection and crossbreeding, left trace in the animal genomes. These traces are identified with the locution selection sweeps or selection signatures. Selection sweeps can have two main origins: natural or artificial. Selection signatures can be ascribed to natural
adaptation of animal to the environment (e.g. climate, orography) or due to the selective choice of farmers; in both cases this force leave trace in the farm animal genomes. The appearance of first artificial selection signatures dates back to the farm animal domestication, when an increase in the frequency of genes making the animals more adaptable to human needs was observed (Fan et al., 2010). Population genetics theory and genomic analysis are able to identify selection sweeps due to more or less recent selection events. In the following paragraphs some techniques that are able to identify these signatures will be examined.
b. Method based on allelic frequency: Wright’s F statistics
The genome-wide technique using SNP panel with the aim to identify selection signature or quantify diversity among population, truly used the population genetics theory developed in the past century by the founder of this discipline.
The allelic frequencies and the proportion of polymorphic loci were initially proposed as genetic diversity measurement. However, the use of polymorphic loci proportion was problematic because of the selection criteria of these loci. In order to solve this problem, new indices were created: expected and observed heterozygosity, and observed homozygosity. In a population with N individuals, the observed
homozygosity is the proportion of homozygotes on the total of individuals (Ho/N) and
the observed heterozygosity is the proportion between the number of heterozygotes on the total number of individuals in the population (He/N). The expected heterozygosity is the possibility that taking randomly one individual from a population it is heterozygote under the hypothesis of HWE.
Another important aspect of population genetics are the Wright statistics, developed during the fifties of the last century. These three indices (FIS, FIT and FST)
allow to represent the genetic structure of a population and the potential presence of sub-populations (Hartl and Clark, 2007). FIS coefficient is used to measure a possible
surplus of homozygotes in the population, for example because of matings between relatives (inbreeding). FST parameter represents the probability of extract from one
sub-population two different alleles compared to the same probability in the entire population. FST is used to estimate genetic distance among populations and the genes
flow: the more different are the populations, the higher is the FST value; conversely,
the stronger is the flow between the populations the lower is the value.
The FIS and FIT coefficients can assume both positive and negative values:
positive if there is a lack of heterozygotes and negative when there is an excess of heterozygotes. Wright FST, instead, can be only positive, ranging from 0 to 1.
Following the Wright (1951) formulation of F statistics, a relationship that combine different source of reduction in expected heterozygosity occurs: (1 – FIT) = (1 – FST) ∙
(1 – FIS) where in the right-hand term the products of the deviations from the expected
heterozygosity due to the subpopulation differentiations and the deviations due to the within population inbreeding are equated the overall deviation from hardy-Weinberg expectation (Falconer and Mackay, 1996)
According to Holsinger and Weir (2009), FST is related to variation in allele
frequency among different populations; instead, within population, is an evaluator of the resemblance degree among individuals. They argued that high value of FST for one
locus could be determined by natural selection that concern this locus over others. From pioneer work of Wright (1955), various estimators of FST have been proposed in
literature (e.g. Nei at al., 1977; Weir and Cockerham, 1984). For example, another useful definition of FST is the ratio between allele variance among populations and the
genetic diversity in the entire population according to Weir and Cockerham (1984). Typically, to estimate the degree of diversity among animal populations – usually belonging to different groups or breeds – FST is a suitable measure (Holsinger
and Weir, 2009) and it became, among the others, one of the most commonly used parameters (Laval et al., 2000; Peter et al., 2007; Mastrangelo et al., 2014; Pintus et
al., 2014; Kelleher et al., 2017) within the same species.
c. Linkage disequilibrium in animal population
The genome of an individual can be separated in intervals harboring genes that control the external phenotypic expression. Association among genes is strongly related with their distance on the genome and it can be identified through segregation analysis. With independent assortment, the dissimilarity between the observed and expected segregation ratios is called linkage disequilibrium (LD). The LD level decreases with the succession of generations: after some generations, no LD can be found also between two close genes. LD is related with recombination frequency: the smaller is the LD value, the higher is this frequency. Haldane (1919) derived a relationship aimed at converting recombination frequencies into genetic map units (Morgan, M) assuming a random distribution of recombination events along the chromosome (Weller et al., 2016). The genetic distance among genes is measured with centiMorgan (cM), unit that account for crossing-over: two genes are separated by 2 cM if one crossing-over event happens each 200 meiosis. Linkage Disequilibrium reveals a statistically significant association between alleles of two or more loci. The
LD level is higher in homogeneous or closed populations because of their individuals inherited loci from common ancestors.
Several measures (e.g. D′, r2 and 4N
er) have been identified in order to measure
linkage disequilibrium (Zapata, 2000; Ardie et al., 2002). If we define Ai and Bi the
i-th allele of A and B genes, respectively and wii-th f(AiBi) the frequency of haplotype
AiBi in the population, the simplest LD measure are D and D′:
𝐷 = [𝑓(𝐴1𝐵1)𝑓(𝐴2𝐵2)] − [𝑓(𝐴1𝐵2)𝑓(𝐴2𝐵1)]
D is the difference between parental haplotype frequency and the recombinant
frequency, while D′ is calculate dividing D by its maximum value. When D′ is equal to 1, meaning that two markers have not been separated by any event of recombination, there is a complete, or perfect, linkage disequilibrium; lower values of D′ indicate that this initial complete ancestral LD has been disrupted during the generations. D′ is influenced by the sample size: using a small sample LD is overestimated because of a biased D′ (McRae et al., 2002). Moreover, D′ is strongly affected by allele frequency variation (Bohmanova et al., 2010).
A better LD estimator is r2 that is the ratio between D2 and the product of the four
possible allele frequencies; it indicates the alleles correlation of the two considered loci. Furthermore, r2 allows to estimate the proportion of variance captured by the
genetic marker in LD with an eventual causative mutation which cause major changes in the observable phenotype.
𝑟2 = 𝐷
2
𝑓(𝐴1) 𝑓(𝐴2) 𝑓(𝐵1) 𝑓(𝐵2)
As though to D′ = 1, also r2 equal to 1 is identified as the perfect linkage
small sample (Ardlie et al., 2002; Bohmanova et al., 2010). On the other hand, LD calculated using r2 is underestimated when calculated between two loci with a low
minor allele frequency (Espigolan et al., 2013).
Another LD measure is the population recombination parameter, 4Ner, indicating the
four times multiplication of r, recombination rate in the investigated genome region, and Ne (effective population size). Effective population size is identified with the
breeding population size, that is an idealized population that reflect effective number of males and females that can be mated rather than actual census.
LD has been largely studied in humans (Pritchard and Przeworski, 2001; Reich
et al., 2001) and in several domesticated animal species, both of economic and
affective interest: such as cattle (Porto-Neto et al., 2014; Biegelmeyer et al., 2016), buffalo (Nagarajan et al., 2009), goat (Brito et al., 2015; Mdladla et al., 2016), sheep (Kijas et al., 2012, 2014; Al-Mamum et al., 2015), pigs (Du et al., 2007; Amaral et
al., 2008; Grossi et al., 2017), chicken (Andreescu et al., 2007; Fu et al., 2015), and
horse (Corbin et al., 2010); or cat (Alhaddad et al., 2013) and dog (Boyko, 2011; Stern
et al., 2013), respectively. Studies about LD are useful to evaluate genetic diversity
among breeds, identify genome regions that have been subjected to selection and mapping quantitative trait loci (QTL) on the genome (McRae et al., 2002; McKay et
al., 2007).
In livestock, the average LD shows a typical decay with the increases of distance between loci: in Figure 3 a comparison between LD level in cattle and sheep was reported.
Figure 3. Linkage disequilibrium trend in cattle and sheep breeds with the
characteristic decay.
Kijas et al. (2014) reported that sheep shows a lower level of LD, probably due to their past domestication history, if compared to pigs or cattle.
The knowledge about linkage disequilibrium is essential for performing genome-wide association studies (GWAS), that are modern genetic tools used to establish relationships between observed phenotypes and genotypes. In order to apply successfully GWAS, SNPs and QTLs must be in linkage disequilibrium at population level (Hayes, 2013, Kijas et al., 2014). GWAS are the reference model to map candidate genes affecting trait of economic interest in livestock (Goddard and Hayes, 2009). Moreover, LD knowledge is a requirement for successfully apply genomic selection methodology. 200 400 600 800 1000 0 .0 0 0. 0 5 0. 10 0 .1 5 0. 2 0 0 .2 5 0. 30 Distance Li nk ag e di se qu ili br iu m ( r 2)
Cattle − Sardo Bruna Sheep − Sardinian White
d. Runs of homozygosity
Single Nucleotide polymorphism beadchips can be also used to identify runs of homozygosity (ROH), that are genome segments without heterozygosis in the diploid state (Figure 4). This region is a long string containing only couples of identical alleles (Gibson et al., 2006). The most important ROH feature is the length, that can be measured in base pairs (bp) or consecutive homozygote SNPs.
Figure 4. Example of runs of homozygosity (ROH) (Marras, PhD thesis).
Runs of homozygosity gained a huge interest in animal science: Peripolli et al. (2017) gathered several researches about this topic in a useful review. Interesting ROH applications are the study of inbreeding (Marras et al., 2015), population structure and demographic (Curik et al., 2014) and selective pressure (Kim et al., 2013). Moreover, ROHs allow to simply compute genomic inbreeding coefficients (i.e. FROH) through
the ratio between genome length covered by runs of homozygosity on the total genome length. This index is used to calculate individual inbreeding and its correlation with pedigree-based inbreeding (Kim et al., 2015; Marras et al., 2015). Inbreeding arose when mating between parents sharing one or more ancestors occur (Curik et al., 2014): this occurrence is more frequent in small, close and isolated populations where also with a random choice of parents there is the possibility of mating between relatives. In
particular, inbreeding is defined as the probability that two alleles (or genes) are identical by descent (IBD), meaning that they were inherited from the same ancestral haplotype (Falconer and Mackay, 1996). Alleles are identified as IBD when compared to the base population where alleles are independent. Inbreeding is a typical characteristic of selected population, where mating between relatives occurred more frequently. A higher inbreeding level could lead to a negative phenomenon kwon as
inbreeding depression, with some negative effects on animal fitness. When an
individual inherits from the two related parents the same DNA segment, in that genome region it can be harbor a ROH. The ROH length is a good index to establish how far in the time the mating between relatives (i.e. inbreeding) occurred (Curik et
al., 2014). Long ROHs suggest recent inbreeding, while small ROH ancient
inbreeding: as time passes, some events (e.g. recombination, crossing-over) have more opportunity to cut the IBD region in more smaller segments. Long ROH segments and recombination rate are, indeed, inversely correlated (Bosse et al., 2012).
Objective of the Thesis
This work is structured into a general introduction, four chapters of experimental contributions and general conclusions. The first Chapter contains the general introduction, aiming to provide a synopsis about genetic application in animal science. Two main topics were debated in this thesis, modern genomic tools applied in animal breeding and animal biodiversity.
The first two experimental contributions (Chapters 2 and 3) concerned animal breeding programs, particularly the first and the last step: variance components and breeding values estimation, respectively. The contribution about variance components estimation was the result of my abroad period at the Animal Breeding and Genetics Group of the University of Georgia (USA). The third chapter dealt with the estimation of heritability and genomic breeding values for milk fatty acid profile.
Regarding the animal biodiversity, two researches were carried out analyzing both cattle and sheep breeds farmed in Italy. Several statistical approaches were used in order to identify selection signatures that can be distinguish among different breeds or productive aptitude within the same species.
Third contribution (Chapter 4) analyzed genetic diversity among five cattle breeds: two purebreds and three crossbreeds raised in Sardinia, the second biggest island of Mediterranean Sea. In the Chapter 5, in order to highlight genome regions that can differentiate livestock production, selection signatures were investigated among different productive aptitudes in the Italian ovine stock.
Finally, the general conclusions reported in Chapter 6 offered a short overview of the main results obtained during the PhD period.
References
1000 Genomes Project Consortium (2012) An integrated map of genetic variation from 1,092 human genomes. Nature, 491(7422), 56.
Abdel-Mawgood A. L. (2012). DNA based techniques for studying genetic diversity. In Genetic Diversity in Microorganisms. InTech.
Aguilar I., Misztal I., Johnson D. L., Legarra A., Tsuruta S., Lawlor T. J. (2010) Hot topic: a unified approach to utilize phenotypic, full pedigree, and genomic information for genetic evaluation of Holstein final score. Journal of dDairy Science, 93, 743–752.
Al-Mamun H. A., Clark S., Kwan P., & Gondro C. (2015) Genome-wide linkage disequilibrium and genetic diversity in five populations of Australian domestic sheep. Genetics Selection Evolution, 47(1), 90.
Alexandratos N., & Bruinsma J. (2012) World agriculture towards 2030/2050: the 2012 revision (Vol. 12, No. 3). FAO, Rome: ESA Working paper.
Alford A. R., Hegarty R. S., Parnell P. F., Cacho O. J., Herd R. M., & Griffith G. R. (2006) The impact of breeding to reduce residual feed intake on enteric methane emissions from the Australian beef industry. Australian Journal of Experimental Agriculture, 46(7), 813-820.
Alhaddad H., Khan R., Grahn R. A., Gandolfi B., Mullikin J. C., Cole S. A., et al. (2013) Extent of linkage disequilibrium in the domestic cat, Felis silvestris catus, and its breeds. PLoS One, 8(1), e53537.
Allendorf F. W., Hohenlohe P. A., & Luikart G. (2010) Genomics and the future of conservation genetics. Nature Reviews Genetics, 11(10), 697-709.
Altmann A., Weber P., Bader D., Preuß M., Binder E. B., & Müller-Myhsok B. (2012) A beginners guide to SNP calling from high-throughput DNA-sequencing data. Human Genetics, 131(10), 1541-1554.
Amaral A. J., Megens H. J., Crooijmans R. P., Heuven H. C., & Groenen M. A. (2008) Linkage disequilibrium decay and haplotype block structure in the pig. Genetics, 179(1), 569-579.
Andreescu C., Avendano S., Brown S. R., Hassen A., Lamont S. J., & Dekkers J. C. (2007) Linkage disequilibrium in related breeding lines of chickens. Genetics, 177(4), 2161-2169.
Ardlie K. G., Kruglyak L., & Seielstad M. (2002) Patterns of linkage disequilibrium in the human genome. Nature Reviews Genetics, 3, 299–309.
Barillet F., Andreoletti O., Palhiere I., Aguerre X., Arranz J. M., Minery S., et al. (2002) Breeding for scrapie resistance using PrP genotyping in the French dairy sheep breeds. In Proceedings of the 7th World Congress on Genetics Applied to Livestock Production (Vol. 31, pp. 683-6).
Becker D., Tetens J., Brunner A., Bürstel D., Ganter M., Kijas J., et al. (2010) Microphthalmia in Texel sheep is associated with a missense mutation in the paired-like homeodomain 3 (PITX3) gene. PLoS One, 5(1), e8689.
Bennewitz J., Reinsch N., Reinhardt F., Liu Z., & Kalm E. (2004) Top down preselection using marker assisted estimates of breeding values in dairy cattle. Journal of Animal Breeding and Genetics, 121(5), 307-318.
Biegelmeyer P., Gulias-Gomes C. C., Caetano A. R., Steibel J. P., & Cardoso F. F. (2016) Linkage disequilibrium, persistence of phase and effective population size estimates in Hereford and Braford cattle. BMC Genetics, 17(1), 32.
Bohmanova J., Sargolzaei M., & Schenkel F. S. (2010) Characteristics of linkage disequilibrium in North American Holsteins. BMC Genomics, 11(1), 421.
Boichard D., Fritz S., Rossignol M. N., Boscher M. Y., Malafosse A., & Colleau J. J. (2002) Implementation of marker-assisted selection in French dairy cattle. In Proceedings of the 7th world congress on genetics applied to livestock production (pp. 18-23).
Boichard D., Fritz S., Rossignol M. N., Guillaume F., Colleau J. J., & Druet T. (2006) Implementation of marker-assisted selection: practical lessons from dairy cattle. Proceedings of 8th World Congress on Genetics Applied to Livestock Production, Commun, 22-11.
Bosse M., Megens H. J., Madsen O., Paudel Y., Frantz L. A., Schook L. B., Crooijmans R. P., & Groenen M. A. (2012) Regions of homozygosity in the porcine genome: consequence of demography and the recombination landscape. PLoS Genetics 8, e1003100.
Bovine HapMap Consortium. (2009) Genome-wide survey of SNP variation uncovers the genetic structure of cattle breeds. Science, 324(5926), 528-532.
Boyko A. R. (2011) The domestic dog: man's best friend in the genomic era. Genome Biology, 12(2), 216.
Brito L. F., Jafarikia M., Grossi D. A., Kijas J. W., Porto-Neto L. R., Ventura R. V.,
et al. (2015) Characterization of linkage disequilibrium, consistency of gametic
phase and admixture in Australian and Canadian goats. BMC Genetics, 16(1), 67. Bruford M. W., Bradley D. G., Luikart G. (2003) DNA markers reveal the complexity
Cecchinato A., De Marchi M., Penasa M., Casellas J., Schiavon S., & Bittante G. (2012) Genetic analysis of beef fatty acid composition predicted by near-infrared spectroscopy. Journal of Animal Science, 90(2), 429-438.
Chen L., Ekine-Dzivenu C., Vinsky M., Basarab J., Aalhus J., Dugan M. E., et al. (2015) Genome-wide association and genomic prediction of breeding values for fatty acid composition in subcutaneous adipose and longissimus lumborum muscle of beef cattle. BMC Genetics, 16(1), 135.
Chessa B., Pereira F., Arnaud F., Amorim A., Goyache F., et al. (2009) Revealing the history of sheep domestication using retrovirus integrations. Science, 324, 532– 536.
Chiaia H. L. J., Peripoli E., de Oliveira Silva R. M., Aboujaoude C., Feitosa F. L. B., de Lemos M. V. A., et al. (2017) Genomic prediction for beef fatty acid profile in Nellore cattle. Meat Science, 128, 60-67.
Ciani E., Crepaldi P., Nicoloso L., Lasagna E., Sarti F. M., Moioli B., et al. (2014) Genome‐wide analysis of Italian sheep diversity reveals a strong geographic pattern and cryptic relationships between breeds. Animal Genetics, 45(2), 256-266.
Clutton-Brock, J. (1999). A natural history of domesticated mammals. Cambridge University Press.
Colli L., Milanesi M., Talenti A., Bertolini F., Chen M., Crisà A., Daly K. G., Del Corvo M., Guldbrandtsen B., Lenstra J. A., Rosen B. D., Vajana E., Catillo G., Joost S., Nicolazzi E. L., Rochat E., Rothschild M. F., Servin B., Sonstegard T. S., Steri R., Van Tassell C. P., Ajmone-Marsan P., Crepaldi P., Stella A., & the AdaptMap Consortium (2018) Genome-wide SNP profiling of worldwide goat
populations reveals strong partitioning of diversity and highlights post-domestication migration routes. Genomic Selection Evolution, 50(1), 58.
Corbin L. J., Blott S. C., Swinburne J. E., Vaudin M., Bishop S. C., & Woolliams J. A. (2010) Linkage disequilibrium and historical effective population size in the Thoroughbred horse. Animal Genetics, 41(s2), 8-15.
Curik I., Ferenčaković M., & Sölkner J. (2014) Inbreeding and runs of homozygosity: a possible solution to an old problem. Livestock Science, 166, 26-34.
Daetwyler H. D., Capitan A., Pausch H., Stothard P., Van Binsbergen R., Brøndum, R. F., et al. (2014) Whole-genome sequencing of 234 bulls facilitates mapping of monogenic and complex traits in cattle. Nature Genetics, 46(8), 858.
Daetwyler H. D., Hickey J. M., Henshall J. M., Dominik S., Gredler B., Van Der Werf J. H. J., & Hayes B. J. (2010) Accuracy of estimated genomic breeding values for wool and meat traits in a multi-breed sheep population. Animal Production Science, 50(12), 1004-1010.
Dekkers J. C. M., & Hospital F. (2002) Multifactorial genetics: The use of molecular genetics in the improvement of agricultural populations. Nature Reviews Genetics, 3, 22-32.
Dekkers, J. C. (2004) Commercial application of marker-and gene-assisted selection in livestock: strategies and lessons. Journal of Animal Science, 82(13), 313-328. Di Lorenzo P., Ceccobelli S., Panella F., Attard G., & Lasagna E. (2015) The role of
mitochondrial DNA to determine the origin of domestic chicken. World's Poultry Science Journal, 71(2), 311-318.
Dickinson A. G., Stamp J. T., Renwick C. C., & Rennie J. C. (1968) Some factors controlling the incidence of scrapie in Cheviot sheep injected with a Cheviot-passaged scrapie agent. Journal of Comparative Pathology, 78(3), 313-321. Dimauro C., Nicoloso L., Cellesi M., Macciotta N. P. P., Ciani E., Moioli B., et al.
(2015) Selection of discriminant SNP markers for breed and geographic assignment of Italian sheep. Small Ruminant Research, 128, 27-33.
Du F. X., Clutter A. C., & Lohuis M. M. (2007) Characterizing linkage disequilibrium in pig populations. International Journal of Biological Sciences, 3(3), 166. Duchemin S. I., Colombani C., Legarra A., Baloche G., Larroque H., Astruc J. M., et
al. (2012) Genomic selection in the French Lacaune dairy sheep breed. Journal of
Dairy Science, 95(5), 2723-2733.
Espigolan R., Baldi F., Boligon A. A., Souza F. R. P., Gordo D. G. M., et al. (2013) Study of whole genome linkage disequilibrium in Nellore cattle. BMC Genomics, 14, 305.
Falconer D. S., & Mackay T. F. C. (1996) Introduction to quantitative genetics, 4. Fan B., Du Z. Q., Gorbach D. M., & Rothschild M. F. (2010). Development and
application of high-density SNP arrays in genomic studies of domestic animals. Asian-Australasian Journal of Animal Sciences, 23(7), 833-847.
FAO (2011) World Livestock 2011 – Livestock in Food Security. Rome, FAO. Farnir F., Coppieters W., Arranz J. J., Berzi P., Cambisano N., Grisart B., et al. (2000)
Extensive genome-wide linkage disequilibrium in cattle. Genome Research, 10(2), 220-227.
Ferenčaković M., Hamzic E., Gredler B., Curik I. & Sölkner J. (2011) Runs of homozygosity reveal genome‐wide autozygosity in the Austrian Fleckvieh cattle. Agriculturae Conspectus Scientificus, 76, 325–8.
Fernando R. L., & Grossman M. (1989) Marker assisted selection using best linear unbiased prediction. Genetics Selection Evolution, 21(4), 467.
Finocchiaro R., Van Kaam J. B. C. H. M., Portolano B., & Misztal I. (2005) Effect of heat stress on production of Mediterranean dairy sheep. Journal of Dairy Science, 88(5), 1855-1864.
Fu W., Dekkers J. C., Lee W. R., & Abasht B. (2015) Linkage disequilibrium in crossbred and pure line chickens. Genetics Selection Evolution, 47(1), 11.
Gianola D., Gustavo A., Hill W. G., Manfredi E., & Fernando R. L. (2009) Additive genetic variability and the Bayesian alphabet. Genetics.
Gianola D., Im S., and Fernando R. L. (1988) Prediction of breeding values under Henderson’s selection model: A revisitation. Journal of Dairy Science, 71:2790-2798.
Gibson J., Newton E. M. & Collins A. (2006) Extended tracts of homozygosity in outbred human populations. Human Molecular Genetics, 15, 789–95.
Goddard M. E., & Hayes B. J. (2007). Genomic selection. Journal of Animal breeding and Genetics, 124(6), 323-330.
Goddard M. E., & Hayes B. J. (2009) Mapping genes for complex traits in domestic animals and their use in breeding programmes. Nature Reviews Genetics, 10(6), 381.
Grossi D. A., Jafarikia M., Brito L. F., Buzanskas M. E., Sargolzaei, M., & Schenkel F. S. (2017) Genetic diversity, extent of linkage disequilibrium and persistence of gametic phase in Canadian pigs. BMC Genetics, 18(1), 6.
Guillaume F., Fritz S., Boichard D., & Druet T. (2008) Correlations of marker-assisted breeding values with progeny-test breeding values for eight hundred ninety-nine French Holstein bulls. Journal of Dairy Science, 91(6), 2520-2522.
Hartl, D. L., & Clark, A. G. (2007) Principles of Population Genetics. Sinauer Associates.
Hartwell L. H., Hood L., Goldberg M. L., Reynolds A. E., Silver L. M., & Veres R. C. (2004) Genetics – from gene to genomes, Third edition, McGraw-Hill
Hayes, B. J., Pryce, J., Chamberlain, A. J., Bowman, P. J., & Goddard, M. E. (2010). Genetic architecture of complex traits and accuracy of genomic prediction: coat colour, milk-fat percentage, and type in Holstein cattle as contrasting model traits. PLoS Genetics, 6(9), e1001139.
Hayes B. (2013) Overview of statistical methods for genome-wide association studies (GWAS). In Genome-wide association studies and genomic prediction (pp. 149-169). Humana Press, Totowa, NJ.
Hayes B. J., Bowman P. J., Chamberlain A. J., & Goddard, M. E. (2009) Invited review: Genomic selection in dairy cattle: Progress and challenges. Journal of Dairy Science, 92(2), 433-443.
Hazel L. N. (1943). The genetic basis for constructing selection indexes. Genetics, 28(6), 476-490.
Hein L., Sørensen L. P., Kargo M., & Buitenhuis A. J. (2018) Genetic analysis of predicted fatty acid profiles of milk from Danish Holstein and Danish Jersey cattle populations. Journal of Dairy Science, 101(3), 2148-2157.
Henderson C. R. (1975) Best linear unbiased estimation and prediction under a selection model. Biometrics, 423-447.
Hofer A. (1998) Variance component estimation in animal breeding: a review. Journal of Animal Breeding and Genetics, 115(1‐6), 247-265.
Holsinger K. E., & Weir B. S. (2009) Genetics in geographically structured populations: defining, estimating and interpreting FST. Nature Reviews Genetics, 10(9), 639-650.
Hurtado A., Garcı́a-Pérez A. L., de Heredia I. B., Barandika J., Sanz-Parra A., Berriatua E., & Juste R. A. (2002) Genetic susceptibility to scrapie in a population of Latxa breed sheep in the Basque Country, Spain. Small Ruminant Research, 45(3), 255-259.
International Chicken Polymorphism Map Consortium (2004) A genetic variation map for chicken with 2.8 million single-nucleotide polymorphisms. Nature, 432(7018), 717.
Jensen J. (2001) Genetic evaluation of dairy cattle using test day models. Journal of Dairy Science, 84:2803–2812.
Kelleher M. M., Berry D. P., Kearney J. F., McParland S., Buckley F., & Purfield D. C. (2017) Inference of population structure of purebred dairy and beef cattle using high-density genotype data. Animal, 11(1), 15-23.
Kennedy B.W., Schaeffer L. R., and Sorensen D. A. (1988) Genetic proprieties of animal models. Journal of Dairy Science, 71:17-26.
Kijas, J. W., Townley, D., Dalrymple, B. P., Heaton, M. P., Maddox, J. F., McGrath, A., ... & Tang, D. (2009). A genome wide survey of SNP variation reveals the genetic structure of sheep breeds. PloS one, 4(3), e4668.
Kijas J. W., Lenstra J. A., Hayes B., Boitard S., Neto L. R. P., San Cristobal M., et al. (2012) Genome-wide analysis of the world's sheep breeds reveals high levels of historic mixture and strong recent selection. PLoS Biology, 10(2), e1001258. Kijas J. W., Porto‐Neto L., Dominik S., Reverter A., Bunch R., McCulloch R., et al.
(2014) Linkage disequilibrium over short physical distances measured in sheep using a high‐density SNP chip. Animal Genetics, 45(5), 754-757.
Kim E. S., Sonstegard T. S., Van Tassell C. P., Wiggans G., & Rothschild M. F. (2015) The relationship between runs of homozygosity and inbreeding in Jersey cattle under selection. PloS One, 10(7), e0129967.
Kim E.S., Cole J. B., Huson H., Wiggans G. R., Van Tassell C. P., Crooker B. A., Liu G., Da Y., & Sonstegard T. S. (2013) Effect of artificial selection on runs of homozygosity in U.S. Holstein cattle. PLoS One 8, e80813.
Lande R., & Thompson R. (1990) Efficiency of marker-assisted selection in the improvement of quantitative traits. Genetics, 124(3), 743-756.
Larson G., & Fuller D. Q. (2014) The evolution of animal domestication. Annual Review of Ecology, Evolution, and Systematics, 45, 115-136.
Laval G., Iannuccelli N., Legault C., Milan D., Groenen M. A., Giuffra E., Andersson L., Nissen P. H., Jørgensen C. B., Beeckmann P., Geldermann H., Foulley J., Chevalet C., & Olivier L. (2000). Genetic diversity of eleven European pig breeds. Genetics Selection Evolution, 32(2), 187.
Ligios C., Cancedda M. G., Madau L., Santucciu C., Maestrale C., Agrimi U., et al. (2006) PrP Sc deposition in nervous tissues without lymphoid tissue involvement is frequently found in ARQ/ARQ Sarda breed sheep preclinically affected with natural scrapie. Archives of Virology, 151(10), 2007-2020.
Macciotta N. P. P., Mele M., Cappio-Borlino A., & Secchiari P. (2005) Issues and perspectives in dairy sheep breeding. Italian Journal of Animal Science, 4(1), 5-23.
Macciotta N. P. P., Gaspa G., Steri R., Nicolazzi E. L., Dimauro C., Pieramati C., and Cappio-Borlino A. (2010) Using eigenvalues as variance priors in the prediction of genomic breeding values by principal component analysis. Journal of Dairy Science, 93:2765-2774.
Macciotta N. P. P., Biffani S., Bernabucci U., Lacetera N., Vitali A., Ajmone-Marsan P., & Nardone A. (2017) Derivation and genome-wide association study of a principal component-based measure of heat tolerance in dairy cattle. Journal of Dairy Science, 100(6), 4683-4697.
Mai, M. D., Sahana, G., Christiansen, F. B., & Guldbrandtsen, B. (2010). A genome-wide association study for milk production traits in Danish Jersey cattle using a 50K single nucleotide polymorphism chip. Journal of animal science, 88(11), 3522-3528.
Manel S., Schwartz M. K., Luikart G., & Taberlet P. (2003) Landscape genetics: combining landscape ecology and population genetics. Trends in Ecology & Evolution, 18(4), 189-197.
Marras G., Gaspa G., Sorbolini S., Dimauro C., Ajmone‐Marsan P., Valentini A., et
al. (2015) Analysis of runs of homozygosity and their relationship with inbreeding
in five cattle breeds farmed in Italy. Animal Genetics, 46(2), 110-121.
Martinez-Royo A., Alabart J. L., Sarto P., Serrano M., Lahoz B., Folch J., & Calvo, J. H. (2017) Genome-wide association studies for reproductive seasonality traits in Rasa Aragonesa sheep breed. Theriogenology, 99, 21-29.
Mastrangelo S., Di Gerlando R., Tolone M., Tortorici L., Sardina M. T., & Portolano B. (2014) Genome wide linkage disequilibrium and genetic structure in Sicilian dairy sheep breeds. BMC Genetics, 15(1), 108.
Mastrangelo, S., Ciani, E., Sardina, M. T., Sottile, G., Pilla, F., Portolano, B., & Bi. Ov. Ita Consortium. (2018). Runs of homozygosity reveal genome‐wide autozygosity in Italian sheep breeds. Animal genetics, 49(1), 71-81.
Matukumalli L. K., Lawley C. T., Schnabel R. D., Taylor J. F., Allan M. F., Heaton M. P., et al. (2009) Development and characterization of a high density SNP genotyping assay for cattle. PloS One, 4(4), e5350.
McKay S. D., Schnabel R. D., Murdoch B. M., Matukumalli L. K., Aerts J., Coppieters W., et al. (2007) Whole genome linkage disequilibrium maps in cattle. BMC Genetics, 8(1), 74.
McRae A. F., McEwan J. C., Dodds K. G., Wilson T., Crawford A. M., & Slate J. (2002) Linkage disequilibrium in domestic sheep. Genetics, 160(3), 1113-1122. Mdladla K., Dzomba E. F., Huson H. J., & Muchadeyi F. C. (2016) Population
genomic structure and linkage disequilibrium analysis of South African goat breeds using genome‐wide SNP data. Animal Genetics, 47(4), 471-482.
Mele M., Dal Zotto R., Cassandro M., Conte G., Serra A., Buccioni A., et al. (2009). Genetic parameters for conjugated linoleic acid, selected milk fatty acids, and milk fatty acid unsaturation of Italian Holstein-Friesian cows. Journal of dairy Science, 92(1), 392-400.
Meuwissen T. H. E., Hayes B. J., & Goddard M. E. (2001) Prediction of Total Genetic Value Using Genome-Wide Dense Marker Maps. Genetics, 157:1819-1829. Misztal I. (2008) Reliable computing in estimation of variance components. Journal
of Animal Breeding and Genetics, 125(6), 363–370.
Moioli B., Contarini G., Pariset L., Marchitelli C., Crisà A., Catillo G., et al. (2012) Genetic variation of C18: 1 and C18: 2 isomers in sheep milk fat. Small ruminant research, 103(2-3), 187-193.
Moser G., Tier B., Crump R. E., Khatkar M. S., & Raadsma H. W. (2009) A comparison of five methods to predict genomic breeding values of dairy bulls from genome-wide SNP markers. Genetics Selection Evolution, 41:56.
Naderi S., Rezaei H. R., Pompanon F., Blum M. G., Negrini R., Naghash H. R., et al. (2008) The goat domestication process inferred from large-scale mitochondrial DNA analysis of wild and domestic individuals. Proceedings of the National Academy of Sciences, 105(46), 17659-17664.
Nagarajan M., Kumar N., Nishanth G., Haribaskar R., Paranthaman K., Gupta J., et al. (2009) Microsatellite markers of water buffalo, Bubalus bubalis-development, characterisation and linkage disequilibrium studies. BMC Genetics, 10(1), 68. Negussie E., de Haas Y., Dehareng F., Dewhurst R. J., Dijkstra J., Gengler N., et al.
(2017) Invited review: Large-scale indirect measurements for enteric methane emissions in dairy cattle: A review of proxies and their potential for use in
management and breeding decisions. Journal of Dairy Science, 100(4), 2433-2453.
Nei M. (1977). F‐statistics and analysis of gene diversity in subdivided populations. Annals of human genetics, 41(2), 225-233.
Ostersen T., Christensen O. F., Henryon M., Nielsen B., Su G., & Madsen P. (2011) Deregressed EBV as response variable yield reliable genomic predictions for pigs. Genetics Selection Evolution, 43, 38.
Palhiere I., Brochard M., Moazami-Goudarzi K., Laloë D., Amigues Y., Bed'Hom B.,
et al. (2008) Impact of strong selection for the PrP major gene on genetic
variability of four French sheep breeds (Open Access publication). Genetics Selection Evolution, 40(6), 663.
Pareek C. S., Smoczynski R., & Tretyn A. (2011). Sequencing technologies and genome sequencing. Journal of Applied Genetics, 52(4), 413-435.
Peripolli E., Munari D. P., Silva M. V. G. B., Lima A. L. F., Irgang R., & Baldi F. (2017). Runs of homozygosity: current knowledge and applications in livestock. Animal Genetics, 48(3), 255-271.
Peñagaricano, F., Weigel, K. A., & Khatib, H. (2012). Genome‐wide association study identifies candidate markers for bull fertility in Holstein dairy cattle. Animal genetics, 43, 65-71.
Peter, C., Bruford, M., Perez, T., Dalamitra, S., Hewitt, G., Erhardt, G., & Econogene Consortium (2007). Genetic diversity and subdivision of 57 European and Middle‐Eastern sheep breeds. Animal genetics, 38(1), 37-44.
Pintus E., Sorbolini S., Albera A., Gaspa G., Dimauro C., Steri R., et al. (2014) Use of locally weighted scatterplot smoothing (LOWESS) regression to study