https://doi.org/10.5194/cp-13-1451-2017 © Author(s) 2017. This work is distributed under the Creative Commons Attribution 3.0 License.
Climate signals in a multispecies tree-ring network from central
and southern Italy and reconstruction of the late summer
temperatures since the early 1700s
Giovanni Leonelli1, Anna Coppola2, Maria Cristina Salvatore2, Carlo Baroni2,3, Giovanna Battipaglia4,5, Tiziana Gentilesca6, Francesco Ripullone6, Marco Borghetti6, Emanuele Conte7, Roberto Tognetti8, Marco Marchetti7, Fabio Lombardi9, Michele Brunetti10, Maurizio Maugeri10,11, Manuela Pelfini12, Paolo Cherubini13, Antonello Provenzale3, and Valter Maggi1,3
1Dept. of Earth and Environmental Science, Università degli Studi di Milano–Bicocca, Milan, Italy 2Dept. of Earth Sciences, Università degli Studi di Pisa, Pisa, Italy
3Istituto di Geoscienze e Georisorse, Consiglio Nazionale delle Ricerche, Pisa, Italy 4Dept. DiSTABiF, Università degli Studi della Campania “L. Vanvitelli”, Caserta, Italy 5PALECO EPHE, University of Montpellier 2, Montpellier, France
6School of Agricultural, Forestry, Food and Environmental Sciences, Università degli Studi della Basilicata,
Potenza, Italy
7Dept. of Biosciences and Territory, Università degli Studi del Molise, Campobasso, Italy
8Dept. of Agricultural, Environmental and Food Sciences, Università degli Studi del Molise, Campobasso, Italy 9Dept. of Agronomy, Università Mediterranea di Reggio Calabria, Reggio Calabria, Italy
10Istituto di Scienze dell’Atmosfera e del Clima, Consiglio Nazionale delle Ricerche, Bologna, Italy 11Dept. of Environmental Science and Policy, Università degli Studi di Milano, Milan, Italy
12Dept. of Earth Sciences, Università degli Studi di Milano, Milan, Italy
13Swiss Federal Institute for Forest, Snow and Landscape Research WSL, Birmensdorf, Switzerland
Correspondence to:Giovanni Leonelli ([email protected]) Received: 14 March 2017 – Discussion started: 17 March 2017
Revised: 25 August 2017 – Accepted: 16 September 2017 – Published: 2 November 2017
Abstract. A first assessment of the main climatic drivers
that modulate the tree-ring width (RW) and maximum late-wood density (MXD) along the Italian Peninsula and north-eastern Sicily was performed using 27 forest sites, which in-clude conifers (RW and MXD) and broadleaves (only RW). Tree-ring data were compared using the correlation analysis of the monthly and seasonal variables of temperature, pre-cipitation and standardized prepre-cipitation index (SPI, used to characterize meteorological droughts) against each species-specific site chronology and against the highly sensitive to climate (HSTC) chronologies (based on selected indexed in-dividual series). We find that climate signals in conifer MXD are stronger and more stable over time than those in conifer and broadleaf RW. In particular, conifer MXD variability is directly influenced by the late summer (August, September) temperature and is inversely influenced by the summer
pre-cipitation and droughts (SPI at a timescale of 3 months). The MXD sensitivity to August–September (AS) tempera-ture and to summer drought is mainly driven by the latitu-dinal gradient of summer precipitation amounts, with sites in the northern Apennines showing stronger climate signals than sites in the south. Conifer RW is influenced by the temperature and drought of the previous summer, whereas broadleaf RW is more influenced by summer precipitation and drought of the current growing season. The reconstruc-tion of the late summer temperatures for the Italian Penin-sula for the past 300 years, based on the HSTC chronology of conifer MXD, shows a stable model performance that un-derlines periods of climatic cooling (and likely also wetter conditions) in 1699, 1740, 1814, 1914 and 1938, and follows well the variability of the instrumental record and of other tree-ring-based reconstructions in the region. Considering a
20-year low-pass-filtered series, the reconstructed tempera-ture record consistently deviates < 1◦C from the
instrumen-tal record. This divergence may also be due to the precipita-tion patterns and drought stresses that influence the tree-ring MXD at our study sites. The reconstructed late summer tem-perature variability is also linked to summer drought con-ditions and it is valid for the west–east oriented region in-cluding Sardinia, Sicily, the Italian Peninsula and the western Balkan area along the Adriatic coast.
1 Introduction
Climate reconstructions for periods before instrumental records rely on proxy data from natural archives and on the ability to date them. Among the available proxies, tree rings are one of the most used archives for reconstructing past cli-mates with annual resolution in continental areas and they often come from the temperature-limited environments with high latitudes and altitudes (e.g., Briffa et al., 2004; Ruther-ford et al., 2005). Tree-ring data can be used at regional to global scales (IPCC, 2013) and long chronologies covering millennia, going back as far as the early Holocene, are avail-able (for Europe: Becker, 1993; Friedrich et al., 2004; Nico-lussi et al., 2009).
The reconstruction of past climate variability and the anal-ysis of its effects on forest ecosystems are crucial elements for understanding climatic processes and for predicting what responses should be expected in ecosystems under the ongo-ing climatic and global changes. In particular, the Mediter-ranean region is a prominent climate change hot spot (Giorgi, 2006; Turco et al., 2015), and by the end of this century, it will likely experience a regional warming higher than the global mean (up to +5◦C in summer) and a reduction of the average summer precipitation (up to −30 %; Somot et al., 2007; IPCC, 2013). As a consequence of the poleward expan-sion of the subtropical dry zones (e.g., Fu et al., 2006), sub-tropical environments under climate change are already fac-ing strong hydroclimatic changes due to lower precipitation and human exploitation (e.g., in southwestern North Amer-ica; Seager et al., 2007; Seager and Vecchi, 2010). Moreover, in these environments (including the Mediterranean region), soil moisture will likely drop, resulting in a contraction of temperate drylands by approximately a third (converting into subtropical drylands), and longer periods of drought in deep soil layers are expected (Schlaepfer et al., 2017). The in-crease in drought conditions during the growing season is already negatively impacting tree growth, especially at xeric sites in the southwestern and eastern Mediterranean (e.g., Galván et al., 2014). At the ecosystem level, in the near fu-ture, the responses to climate changes will impact the var-ious forest species in a different way, depending on their physiological ability to acclimate and adapt to the new en-vironmental conditions (e.g., Battipaglia et al., 2009; Ripul-lone et al., 2009), and on their capacity to grow, accumulate
biomass and contribute as sinks in the terrestrial carbon cy-cle. Natural summer fires in the Mediterranean area are also expected to increase in frequency over the coming decades as a response to increasingly frequent drought conditions, as-suming a lack of additional fire management and prevention measures (Turco et al., 2017).
1.1 Tree-ring response to climate
Climate–growth relationships have been studied for several species in the Mediterranean region, with different objec-tives: forest productivity (e.g., Biondi, 1999; Boisvenue and Running, 2006; Nicault et al., 2008; Piovesan et al., 2008; Babst et al., 2013), tree ecophysiology, wood formation and related dating issues (Cherubini et al., 2003; Battipaglia et al., 2014), sustainability of forest management (e.g., Boy-dak and Dogru, 1997; Barbati et al., 2007; Marchetti et al., 2010; Castagneri et al., 2014), provision of ecosystem ser-vices (e.g., Schröter et al., 2005) such as carbon sequestra-tion (e.g., Scarascia-Mugnozza and Matteucci, 2014; Cal-fapietra et al., 2015; Borghetti et al., 2017), effective bio-diversity conservation (e.g., Todaro et al., 2007; Battipaglia et al., 2009) and climate reconstruction (see next section), which have led to a variety of associations between climate variables and growth responses in conifers and broadleaves from different environments and ecosystems. Mainly consid-ering the species of this study, we report the main findings on the climate–growth responses found in this region.
Conifers.Studies on silver fir (Abies alba Mill.) growth in the Italian Peninsula reveal high sensitivity to the climate of the previous summer, August−1 in particular, and show
positive correlations with precipitation and negative correla-tions with temperature (Carrer et al., 2010; Rita et al., 2014). Moreover, tree growth in this region is moderately nega-tively correlated with the temperature of the current sum-mer (unlike that in stands located in the European Alps; Car-rer et al., 2010), namely, high temperatures in July and Au-gust negatively affect tree growth. A dendroclimatic network of pines (Pinus nigra J. F. Arnold and P. sylvestris L.) in east-central Spain shows that drought (namely, the standard-ized precipitation–evapotranspiration index – SPEI; Vicente-Serrano et al., 2010) is the main climatic driver of tree-ring growth (Martin-Benito et al., 2013). In a P. uncinata net-work from the Pyrenees, an increasing influence of summer droughts (SPEI) on tree-ring widths (RW) during the 20th century as well as the control of May temperatures on maxi-mum latewood density (MXD) is found (Galván et al., 2015). However, in the abovementioned analyses, the possible influ-ences of the summer climate variables from the year prior to the growth were not considered. Elevation, and partic-ularly the related moisture regime, in the eastern Mediter-ranean region is the main driver of tree-ring growth patterns in a multispecies conifer network comprised of P. nigra, P. sylvestrisand P. pinea L. specimens (Touchan et al., 2016). A dipole pattern in tree-ring growth variability is reported
for Mediterranean pines ranging from Spain to Turkey, with higher sensitivity to summer drought in the east than in the west, and with higher sensitivity to early summer tempera-ture in the west (Seim et al., 2015). Strong correlations be-tween autumn-to-summer precipitation and tree-ring growth and between summer drought and tree-ring growth have been reported for sites (mainly of conifers) in northern Africa– western Mediterranean, with trees in Morocco also respond-ing to the North Atlantic Oscillation index (Touchan et al., 2017).
Broadleaves. In the western Mediterranean (northern Mo-rocco, Algeria, Tunisia, Italy and southern France), decid-uous oaks, including Quercus robur L., reveal a direct re-sponse of tree-ring growth to summer precipitation and an inverse response to summer temperature (Tessier et al., 1994). Beech (Fagus sylvatica L.) is particularly sensitive to soil moisture and air humidity; in past decades, long-term drought conditions have been shown to be the main factor causing a growth decline in the old-growth stands in the Apennines (Piovesan et al., 2008). Beech shows different re-sponses to climate at high- vs. low-altitude sites (Piovesan et al., 2005), with the latter being positively affected by high May temperatures. Despite an expected higher drought sensitivity stress close to the southern limit of the distri-bution area, a late 20th century tree-ring growth increase in beech has been reported in Albania (Tegel et al., 2014), thus underlining the different climate–growth responses in the Mediterranean region. Beech, indeed, presents complex climate growth-responses and also appears to be a less re-sponsive species in the Mediterranean area when compared to conifers such as P. sylvestris, P. nigra, P. uncinata or A. alba (as found in southeastern France; Lebourgeois et al., 2012).
1.2 Tree-ring-based climate reconstructions
One of the most powerful tools in terrestrial paleoclima-tology is obtaining date information about the past climate and past environmental conditions in a region by analyz-ing the tree ranalyz-ings. However, in the Mediterranean region, the low temporal stability of the recorded climatic signals (e.g., Lebourgeois et al., 2012; Castagneri et al., 2014), the scarcity of long chronologies and the high variability of climatic and ecological conditions (Cherubini et al., 2003) often make this analysis difficult. Ring widths are among the most used vari-ables for climate reconstruction but they usually show higher temporal instability in their relationship with climate than that of maximum latewood density (for the Pyrenees, see Büntgen et al., 2010).
The potential to analyze relatively long chronologies in the Mediterranean region has allowed for the reconstruc-tion of the past climate (mainly precipitareconstruc-tion and droughts). Several reconstructions of May–June precipitation have been performed, mainly over the last 300–400 years, in a region including northern Greece, Turkey and Georgia: in
north-ern Aegean–northnorth-ern Anatolia a tree-ring network of oaks was used for reconstructing precipitation variability from 1089 (Griggs et al., 2007); in the Anatolian Peninsula a mixed conifer–broadleaf tree-ring network (mainly P. nigra, P. sylvestrisand oaks; Akkemik et al., 2008), a P. nigra work (Köse et al., 2011) and a multi-species conifer net-work (mainly P. nigra, P. sylvestris and Abies nordmanniana (Steven) Spach; Köse et al., 2013) were used. In the west-ern Mediterranean, in central Spain, higher frequency of ex-ceptionally dry summers has been detected to exist since the beginning of the 20th century using a mixed tree-ring net-work of Pinus sylvestris and P. nigra ssp. salzmannii cover-ing the past four centuries (Ruiz-Labourdette et al., 2014), whereas a 800-year temperature reconstruction from south-eastern Spain using a site of P. nigra underlined predom-inantly higher summer temperatures during the transition between the Medieval Climate Anomaly and the Little Ice Age (Dorado Liñán et al., 2015). A recent reconstruction of spring–late summer temperature from the Pyrenees by means of a P. uncinata MXD network dating back to 1186 (Büntgen et al., 2017) underlines warm conditions around 1200 and 1400 and after 1850.
Reconstructions of past droughts and wet periods over the Mediterranean region have been created using climatic in-dices such as the standardized precipitation index (SPI; Mc-Kee et al., 1995) in Spain (modeling 12-month July SPI using several species of the Pinus genus; Tejedor et al., 2016), and in Romania (modeling 3-month August standardized SPI us-ing P. nigra; Levaniˇc et al., 2013), which allows for the iden-tification of common large-scale synoptic patterns. Droughts have been reconstructed using the Palmer drought severity index (PDSI; Palmer, 1965). Using actual and estimated mul-tispecies tree-ring data, Nicalut et al. (2008) found that the drought episodes at the end of the 20th century are simi-lar to those in the 16th and 17th centuries for the western Mediterranean, whereas in the eastern parts of the region, the droughts seem to be the strongest recorded in the past 500 years.
Early summer temperature has been reconstructed for 400 years in Albania, from a P. nigra tree-ring network, find-ing stable climate–growth relationships over time and a spa-tial extent of the reconstruction spanning over the Balkans and southern Italy (Levaniˇc et al., 2015). Currently, two summer temperature reconstructions close to the study area and based on maximum latewood density (MXD) chronolo-gies are available: (1) a reconstruction of AS temperatures published by Trouet (2014) covering the period 1675–1980 and centered on the northeastern Mediterranean–Balkan re-gion includes sites from the Italian Peninsula (used in this paper), the Balkan area, Greece and sites from the central and eastern European Alps to central Romania and Bul-garia, the latter areas being characterized by continental cli-mates, and (2) a reconstruction of JAS temperatures pub-lished by Klesse et al. (2015), covering the period 1521–2010 and based on a chronology from Mt. Olympus (Greece). As
separate climate (temperature) reconstructions for the north-eastern Mediterranean–Balkan region including Italy have been published to date, the goal of this study was to collect dendrochronological data from Italian research groups and screen the ITRDB for suitable data for climate reconstruc-tions. We therefore investigate RW and MXD climate sig-nals across Italy. After carefully testing the climatic sigsig-nals recorded in the tree-ring RW and MXD from different sites and different species, the reconstruction that is proposed in this study is the first one including only forest sites from the Italian Peninsula.
Overall, the main objectives of this paper are as follows: i. To identify the most important climatic drivers
mod-ulating tree-ring width (RW) and tree-ring maximum latewood density (MXD) variability in forest sites from central and southern Italy. To our knowledge, this is the first attempt performed in Italy with the clear ob-jective to find common response patterns in conifer and broadleaf species using a multispecies tree-ring network and site-specific historical climatic records.
ii. To estimate the temporal stability of the climate–growth and climate–density relationships.
iii. To perform a climatic reconstruction based only on trees highly sensitive to climate(HSTC).
iv. To estimate the spatial coherence of the obtained recon-struction in the region.
2 Data and methods
2.1 Study area and study sites
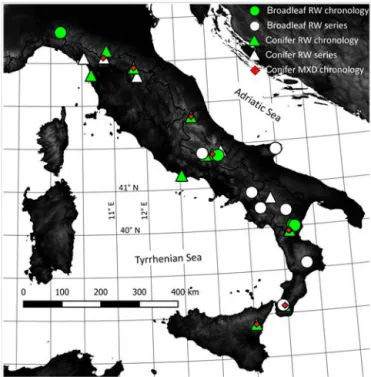
The study region includes the whole Italian Peninsula and eastern Sicily and covers a latitudinal range from 37 to 44◦430N (Fig. 1). The peninsula is roughly oriented NW– SE and its longitudinal axis is characterized by the Apen-nines that reach their maximum altitude at their center (Corno Grande, 2912 m a.s.l., Gran Sasso Massif); a higher altitude is reached in eastern Sicily by the Etna Volcano (3350 m a.s.l.). The study region is surrounded by the Tyrrhe-nian and Adriatic Seas and is characterized by a typical Mediterranean climate, with high temperatures and low pre-cipitation during the summer (from June to September), and by a Mediterranean-temperate regime at the higher altitudes of the Apennines (Fig. 2). Considering the climatic means at all the study sites (at a mean elevation of 1225 ± 520 m a.s.l.) over the period 1880–2014, the temperatures over the study region range from 0.2◦C (January) to 17.6◦C (in July and in August) and only 11 % of the total annual precipitation falls during the summer (from June to August: 155 mm), whereas 34 % falls during winter (from December−1 to February:
493 mm). Autumn is the second wettest season (31 % of total annual precipitation) and spring is the third wettest (24 % of total annual precipitation; Fig. 2).
Figure 1.Distribution of the tree-ring sites from central and
south-ern Italy available to the NEXTDATA project and used in this study. Sites were subdivided by the type of tree (conifer or broadleaf), pa-rameter (RW or MXD) and data used (site chronology or only tree-ring series).
Figure 2.Monthly mean temperatures and precipitation over the
period of 1880–2014 for all sites considered in this study. For both temperature and precipitation, the error bars indicate 1 standard de-viation; for precipitation, the seasonal percentages of precipitation with respect to the mean annual value (i.e., 1433 mm) are reported.
The total forest cover in Italy, excluding the regions of the European Alps, is approximately 5.8 million hectares (Corpo Forestale dello Stato, 2005), 28 % of the considered surface. Forests characterize the landscape of the inner portion of the Apennine range, at middle to high elevations, and an
addi-tional 1.4 million hectares are covered by woodlands and shrublands, which are the Mediterranean “macchia” that bor-der the forests at low elevations and in areas relatively close to the sea. Overall, broadleaf species are much more abun-dant in the study region than conifer species, accounting for approximately three-fourths of the forest cover (Dafis, 1997). The study sites are distributed along the whole latitudi-nal range of the Italian Peninsula and tree-ring proxies in-clude both RW and MXD series collected within the NEXT-DATA project, from Italian universities, and from the ITRDB (www.ncdc.noaa.gov site consulted on September 2015; see Table 1 for full bibliographic references). The data set is based on 27 forest sites composed of several species (conifers at 16 sites, and broadleaves at 11 sites), from which tree-ring series of conifers (RW and MXD) and of broadleaves (RW) were prepared (Fig. 1, Table 1).
2.2 Climate variables
The availability of long and reliable time series of me-teorological variables, possibly from stations located very close to forest sites, is crucial for estimating the climate– growth relationships. However, global or regional climato-logical data sets frequently lack local resolution, especially in remote sites. We, therefore, reconstructed synthetic records of monthly temperature and precipitation series to be rep-resentative of the sampled sites using the anomaly method (New et al., 2000; Mitchell and Jones, 2005), as described in Brunetti et al. (2012). Specifically, we reconstructed in-dependently climatological normals following the procedure described in Brunetti et al. (2014) and Crespi et al. (2017) by estimating a local temperature (precipitation)–elevation re-lationship, and exploiting a very high density data set from time series that are at least 30 years long. We also estimated the deviations from the normals by means of a weighted aver-age of neighboring series, by exploiting the great amount of very long and high quality temperature and precipitation se-ries available for Italy over the past 200–250 years (obtained from an improved version of Brunetti et al., 2006). Finally, by the superposition of the two fields, we obtained temporal series in absolute values for each sampling site. The climate series start in different years due to data availability; how-ever, most of the series start around the mid-19th century. Finally, in order to characterize meteorological drought con-ditions, we calculated the monthly SPI at timescales of 1, 2, 3, 6, 9 and 12 months for all sites, based on the monthly values of precipitation, using the SPI_SL_6 code of the Na-tional Drought Mitigation Center at the University of Ne-braska (http://drought.unl.edu).
2.3 Chronology construction, climate sensitivity and climate reconstructions
Raw data. We examined all individual series of RW and MXD for correct dating using visual and statistical cross-dating. In particular, we used statistical techniques to remove potential dating errors by comparing each individual series from one site against the mean site chronology, which was constructed excluding the analyzed individual series. Using the COFECHA software (www.ldeo.columbia.edu), the in-dividual series were moved forward and backward 10 years from their initial positions, and similarity indices were cal-culated over a 50-year time window, thus highlighting the potential dating errors.
Site chronologies.We used the regional curve standardiza-tion approach (RCS; Briffa et al., 1992; Briffa and Melvin, 2011; Esper et al., 2003) both with the RW and MXD se-ries to preserve the low-frequency variability in the site chronologies. We used the ARSTAN software (ver. 44 h3, www.ldeo.columbia.edu) and did not consider the pith offset estimates between the first measured ring and the actual first year of growth (Esper et al., 2009; Leonelli et al., 2016). The regional curve (RC) for the mean chronology, which was ob-tained after the series alignment to the first measured ring, was smoothed using a cubic spline with a width of 10 % of the chronology length (Büntgen et al., 2006). We computed ratios of raw measurements vs. the values of growth pre-dicted by the RC for all years of the individual series, and the resulting indexed series were averaged by a biweight robust mean to obtain the site chronologies of RW and of MXD. We constructed the RW and MXD site chronologies only for sites with at least 10 individual series fulfilling the following conditions: (i) the individual series length was > 100 years; (ii) the individual series correlation with the respective site chronology had r > 0.3; (iii) the mean inter-series correla-tion (MIC) had r > 0.3; and (iv) the expressed populacorrela-tion sig-nal (EPS; Wigley et al., 1984; Briffa and Jones, 1990) was > 0.7. We used only the individual series fulfilling these con-ditions to construct the site chronologies. However, we ac-cepted some exceptions in order to maximize the number of sites and chronologies available for analysis (see exceptions in Table 1).
Climate sensitivity.We assessed species-specific climate sensitivity for the constructed RW and MXD site chronolo-gies over the common period of 1880–1980 using correla-tion analysis and the site-specific monthly variables of tem-perature, precipitation and standardized precipitation index, from March of the year prior to growth to September of the year of growth. We computed correlations using the DEN-DROCLIM software (Biondi and Waikul, 2004), applying a bootstrap with 1000 iterations, and the obtained results were analyzed by grouping together conifer and broadleaf species. Testing for climate–growth relationships at the site level. To assess the influence of environmental settings on climate– growth relationships, for the conifer MXD site
chronolo-T ab le 1. References for all the dendrochronological data used in this research, information on site locations, types of parameter used at each site and the tree species. Sites are ordered along a decreasing latitudinal gradient, after dif ferentiating between conifers and broadlea v es (horizontal line). Database information and site location T ype of tree-ring parameter Data set name Database Origi nal contrib utor Bibliographic reference Location name Latitude N Longitude E Ele v ation R W chr . R W series MXD chr . Species source (m a.s.l.) ITRDBIT AL017 ITRDB Ori (2015) https://www .ncdc.noaa.go v/paleo/study/4079 Monte Cantiere 44 ◦ 16 0 48 00 10 ◦ 48 0 00 00 800 x Pinus sp. ITRDBIT AL009 ITRDB Schwe ingruber (2015a) https://www .ncdc.noaa.go v/paleo/study/4301 Abetone 44 ◦ 07 0 12 00 10 ◦ 42 0 00 00 1400 x x Abies alba ITRDBIT AL004 ITRDB Biondi (2015b) https://www .ncdc.noaa.go v/paleo/study/2753 Campolino 44 ◦ 06 0 45 00 10 ◦ 39 0 44 00 1650 x Picea abies ITRDBIT AL008 ITRDB Schwei ngruber (2015f) https://www .ncdc.noaa.go v/paleo/study/4540 Mount F alterona 43 ◦ 52 0 12 00 11 ◦ 40 0 12 00 1450 x x Abies alba ITRDBIT AL003 ITRDB Biondi (2015d) https://www .ncdc.noaa.go v/paleo/study/2760 Pineta San Rossore 43 ◦ 43 0 12 00 10 ◦ 18 0 00 00 5 x Pinus pinea ITRDBIT AL022 ITRDB Beck er (2015) https://www .ncdc.noaa.go v/paleo/study/2706 Pratomagno Bibbi-ena – Appennini 43 ◦ 40 0 12 00 11 ◦ 46 0 12 00 1050 x Abies sp. ITRDBIT AL012 ITRDB Schwei ngruber (2015c) https://www .ncdc.noaa.go v/paleo/study/4374 Ceppo Bosque di Martense 42 ◦ 40 0 48 00 13 ◦ 25 0 48 00 1700 x x Abies alba Abies-Abeti-Soprani UNIMOL Colle Canalicc hio-Abeti Soprani 41 ◦ 51 0 40 00 14 ◦ 17 0 51 00 1350 x Abies alba ITRDBIT AL016 ITRDB Schwei ngruber (2015e) https://www .ncdc.noaa.go v/paleo/study/4536 Monte Mattone 41 ◦ 46 0 48 00 14 ◦ 01 0 48 00 1550 x x Pinus nigr a ITRDBIT AL001 ITRDB Biondi (2015a) https://www .ncdc.noaa.go v/paleo/study/2752 Camosciara Mt. Amaro 41 ◦ 46 0 12 00 13 ◦ 49 0 12 00 1550 x Pinus nigr a ITRDBIT AL002 ITRDB Biondi (2015c) https://www .ncdc.noaa.go v/paleo/study/2759 P arco del Circeo 41 ◦ 19 0 48 00 13 ◦ 03 0 02 00 5 x Pinus pinea AAIB A UNIB AS Ruoti (PZ) 40 ◦ 42 0 04 00 15 ◦ 43 0 43 00 925 x Abies alba ITRDBIT AL011 ITRDB Schwei ngruber (2015g) https://www .ncdc.noaa.go v/paleo/study/4541 Mount Pollino 39 ◦ 54 0 00 00 16 ◦ 12 0 00 00 1720 x x Abies alba ITRDBIT AL015 ITRDB Schwe ingruber (2015h) https://www .ncdc.noaa.go v/paleo/study/4644 Sierra de Crispo 39 ◦ 54 0 00 00 16 ◦ 13 0 48 00 2000 x x Pinus leucodermis ITRDBIT AL010 ITRDB Schwe ingruber (2015d) https://www .ncdc.noaa.go v/paleo/study/4420 Gambarie As-promonte 38 ◦ 10 0 12 00 15 ◦ 55 0 12 00 1850 x x Abies alba ITRDBIT AL013 ITRDB Schwe ingruber (2015b) https://www .ncdc.noaa.go v/paleo/study/4304 Etna Linguaglossa 37 ◦ 46 0 48 00 15 ◦ 03 0 00 00 1800 x x Pinus nigr a ITRDBIT AL019 ITRDB Nola (2015) https://www .ncdc.noaa.go v/paleo/study/4042 Corte Brugnatella 44 ◦ 43 0 12 00 09 ◦ 19 0 12 00 900 x Quer cus rob ur F agus-P arco-Abruzzo UNIMOL V al Cerv ara 41 ◦ 49 0 00 00 13 ◦ 43 0 00 00 1780 x F a gus sylvatica F agus-Gar g ano UNIMOL P arco Naziona le del Gar g ano Ris-erv a P av ari 41 ◦ 49 0 00 00 16 ◦ 00 0 00 00 775 x F a gus sylvatica F agus-Montedimezzo UNIMOL Rise v a M aB Unesco Collemeluccio-Montedimezzo 41 ◦ 45 0 00 00 14 ◦ 12 0 00 00 1100 x F a gus sylvatica Cervialto-F ASY UNIN A2 Monti Picentini 40 ◦ 50 0 23 00 15 ◦ 10 0 03 00 800 x F a gus sylvatica F agus-Cilento UNIMOL P arco Naziona le del Cilento Ottati 40 ◦ 28 0 00 00 15 ◦ 24 0 00 00 1130 x F a gus sylvatica QCIBG UNIB AS Gor goglione (MT) 40 ◦ 23 0 09 00 16 ◦ 10 0 04 00 820 x Quer cus cerris QFIMP1 UNIB AS San P aolo Alba nese (PZ) 40 ◦ 01 0 20 00 16 ◦ 20 0 26 00 1050 x Quer cus fr ainetto QFIMP2 UNIB AS Oriolo (CS) 40 ◦ 00 0 10 00 16 ◦ 23 0 29 00 960 x Quer cus fr ainetto F agus-Sila UNIMOL P arco Sila 39 ◦ 08 0 00 00 16 ◦ 40 0 00 00 1680 x F a gus sylvatica F agus-P arco-Aspromonte UNIMOL Aspromonte 38 ◦ 11 0 00 00 15 ◦ 52 0 00 00 1560 x F a gus sylvatica 1235 mean ele v ation 15 sites 12 sites 8 sites
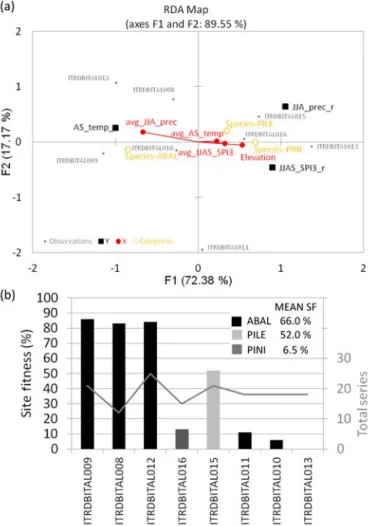
gies (i.e., the chronologies holding the strongest climatic signal; see Results), we performed a redundancy analysis (RDA) selecting the bootstrapped correlation coefficients of climate–growth relationships (Fig. 3) as response variables and the environmental variables as explanatory variables (ge-ographical characteristics and climatic averages over the pe-riod 1880–1980). In order to attenuate co-variation within the environmental variables, we ran a principal component analysis (PCA) before the RDA and the following variables were finally chosen: elevation (co-varying with longitude: our sites are placed at higher elevation at increasing longi-tude; Table 1); average AS temperature; average JJA precipi-tation (co-varying with latitude: higher latitude means higher precipitation amounts); average JJAS SPI_3 (at timescale of 3 months, i.e., the timescale resulting most significant; see Results). Moreover, for each of the MXD site chronologies, we calculated the site fitness (SF; Leonelli et al., 2016), representative of the percentage of selected HSTC series of conifer MXD with respect to the total of series available at each site.
We used the results of the climate sensitivity analysis to detect the driving climate variables (DCVs; of tempera-ture, precipitation and SPI) for each of the three groups of chronologies: MXD conifer, RW conifer and RW broadleaf. Specifically, for each group of chronologies and for each cli-mate variable, we first identified the months with significant correlations at most sites (> 50 %) and with mean correlation values of |r| > 0.25 (black-filled squares in Fig. 3). Starting from the monthly climatic averages of the sites presenting significant correlations with these selected months, we con-structed regional climate series by z scoring the monthly se-ries of each site and calculating regional mean departures; the series of each site were then completed over the maxi-mum period covered by data and reconverted in original units (based on regional mean departures and their specific means and standard deviations), and finally averaged between sites. We calculated the DCVs as means of 2–4 consecutive months of the regional series, except for August−1temperature vs.
conifer RW (according to what was obtained in the site-level analysis of Fig. 3).
HSTC chronologies.Based on the available RW and MXD indexed individual series from all of the sites, we constructed six HSTC chronologies, as in Leonelli et al. (2016). How-ever, given the smaller number of data sets available in this study and the shortness of the time series, a modified version of the method was applied. Specifically, we tested all of the RW (conifer and broadleaf) and MXD (only conifer) indexed individual series against each of the above-defined six DCVs, and we used only the individual tree-ring indexed series with correlation values of |r| > 0.25 in both of the 100-year subpe-riods of the climatic data set (1781–1880 and 1881–1980) for building each of the six HSTC chronologies (which was done by simply averaging together the selected indexed series). We constructed the six HSTC chronologies starting from all of the indexed individual series of conifer MXD (148 series),
of conifer RW (245) and of broadleaf RW (140), which were previously obtained, while constructing the site chronologies (indexed individual series from sites not meeting the fixed quality standards for a site chronology were included at the beginning of the selection).
Climate sensitivity through time. To test the stability of the climate signals recorded in the HSTC chronologies, we conducted a moving correlation analysis between the six HSTC chronologies and their respective DCV, computing bootstrapped correlation coefficients with DENDROCLIM over 60-year time windows that were moved 1 year per it-eration over the longest available periods.
Climate reconstruction.We used only the HSTC chronol-ogy showing the highest absolute values of correlation and the most stable signal over time (i.e., the conifer MXD for late summer temperature; see Results) for the climate re-construction. To extend this HSTC chronology as far back in time as possible, we also added the oldest available in-dividual MXD indexed series with correlations of |r| > 0.25 with this chronology and which had a minimum length of 100 years. For constructing the chronology for climate re-construction, we applied an arithmetic mean to the indexed series, after having normalized all individual series over the common period 1879–1962. Moreover, to account for the changing sample size through time, a variance stabilization of the resulting chronology was performed using Briffa’s RBAR-weighted method (Osborn et al., 1997). In order to improve the HSTC chronology over the early period show-ing an EPS < ∼ 0.8 (i.e., before 1713 in the first version of the HSTC chronology), we considered the yearly difference of the indexed normalized series from the mean and dis-carded the early portion of the series exceeding the thresh-old of 2.5 standard deviations in a given year (one series was truncated at 1713, whereas the other nine fell within a com-mon variability). Finally, we normalized all series and re-calculated the final version of the HSTC chronology used for the temperature reconstruction as described above. We cali-brated and verified linear regression and scaling models (Es-per et al., 2005) over the 100-year (Es-periods 1781–1880 and 1881–1980, respectively, and then the same was done over the inverted periods, in order to estimate model performances and stability. We computed reduction of error (RE; Fritts, 1976) and coefficient of efficiency (CE; Briffa et al., 1988) statistics to assess the quality of the reconstructions. We then used the reconstructed series of late summer temperatures over the period 1901–1980 to build a spatial correlation map with the KNMI Climate Explorer (https://climexp.knmi.nl/; Trouet and van Oldenborgh, 2013), using the 0.5◦ grid of
August–September average temperature and of AS average precipitation (CRU TS 4.0, Climatic Research Unit, Univer-sity of East Anglia Harris et al., 2014). We used this inde-pendent data set instead of the Italian one, as our primary goal was to analyze how far from the Italian Peninsula the reconstructed climatology is still representative.
T ab le 2. Main characteristics of the chronologies used in this research, separating R W (comprised of both broadleaf and conifer species) and MXD (only conifer species). F or each site and parameter , the total number of series av ailable and the number of series sho wing a correlation v alue 0.2 < r < 0.3 with the respe cti v e master chronology is reported. V alues in bold are those that do not exceed the fix ed thresholds of MIC > 0.3, EPS > 0.7 and a number of series > 10, determining the exclusion of the chronology from further analyses. Sites ordered as in T able 1. R W series characteristics MXD series characteristics on the maximum period av ailable Data set name Start End T ime MIC a EPS b no. series no. series 0.2 < r Start End T ime MIC1 EPS2 no. series no. series 0.2 < r date date span < 0.3 vs. master date date span ITRDBIT AL017 1856 1989 134 0.43 0.76 14 0 – – – – – – – ITRDBIT AL009 [1846] [1980] [135] [0.73] [0.66 ] 13 0 1846 1980 135 0.76 0.86 21 0 ITRDBIT AL004 [1836] [1988] [153] [0.51] [0.49 ] 11 0 – – – – – – – ITRDBIT AL008 1827 1980 154 0.62 0.70 12 0 1827 1980 154 0.66 0.87 12 0 ITRDBIT AL003 1 ; 2 1861 1988 128 0.51 0.72 9 0 – – – – – – – ITRDBIT AL022 3 [1539] [1972] [434] [0.45] [0.67 ] 6 1 – – – – – – – ITRDBIT AL012 1654 1980 327 0.57 0.85 26 0 1654 1980 327 0.59 0.91 25 0 Abies-Abeti-Soprani 1 [1838] [2005] [168] [0.53] [0.50 ] 11 0 – – – – – – – ITRDBIT AL016 1844 1980 137 0.54 0.84 17 0 1844 1980 137 0.43 0.75 15 0 ITRDBIT AL001 1750 1987 238 0.52 0.77 16 0 – – – – – – – ITRDBIT AL002 1 1878 1988 111 0.51 0.72 16 0 – – – – – – – AAIB A 1 [1866] [2007] [142] [0.51] [0.55 ] 13 0 – – – – – – – ITRDBIT AL011 1800 1980 181 0.58 0.85 20 0 1800 1980 181 0.54 0.84 18 0 ITRDBIT AL015 1415 1980 566 0.58 0.95 22 0 1441 1980 540 0.50 0.76 21 0 ITRDBIT AL010 1790 1980 191 0.53 0.76 19 0 1790 1980 191 0.50 0.85 18 0 ITRDBIT AL013 1773 1980 208 0.57 0.88 20 0 1795 1980 186 0.44 0.78 18 0 ITRDBIT AL019 1779 1989 211 0.54 0.82 16 0 – – – – – – – F agus-P arco-Abruzzo [1716] [2008] [293] [0.36] [0.73] 3 0 – – – – – – – F agus-Gar g ano [1821] [2009] [189] [0.23 ] [0.42 ] 3 3 – – – – – – – F agus-Montedimezzo 1844 2005 162 0.67 0.85 15 0 – – – – – – – Cervialto-F ASY [1828] [2003] [176] [0.39] [0.52 ] 10 0 – – – – – – – F agus-Cilento [1837] [2007] [171] [0.41] [0.26 ] 7 1 – – – – – – – QCIBG 1 ; 3 [1897] [2013] [117] [0.60] [0.66 ] 9 0 – – – – – – – QFIMP1 1851 2013 163 0.50 0.78 34 0 – – – – – – – QFIMP2 1854 2013 160 0.55 0.79 34 0 – – – – – – – F agus-Sila [1854] [2009] [156] [0.30] [0.21 ] 4 3 – – – – – – – F agus-P arco-Aspromonte [1874] [2009] [136] [0.27 ] [-0.42 ] 5 2 – – – – – – – T O T AL 1785 4 1989 4 205 4 0.55 4 0.80 4 385 10 1750 1980 231 0.55 0.83 148 0 mean mean mean mean r mean EPS sum (all sites) sum (all sites) mean mean mean mean r mean EPS sum sum (all sites) a Mean inter -series correlation of ra w series, calculated using the maximum period av ailable at each site. b Expressed population signal of inde x ed series in the common period of 1880–1980. 1 Series up to 80 years included. 2 Chronology b uilt with fe wer than 10 series (good EPS). 3 Common period with later start date or earlier end date. 4 Sites without chronology [....] are not included in the computation.
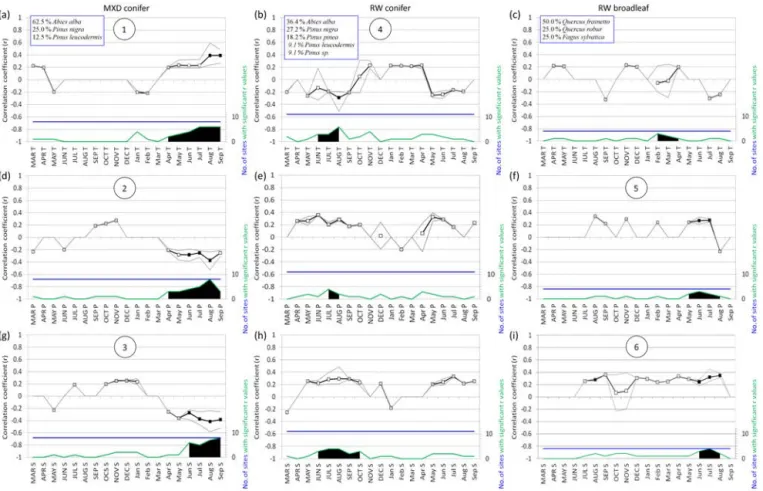
Figure 3.Bootstrapped correlation analysis performed over the common period of 1880–1980, considering chronologies of conifer MXD (left column; a, d, g), of conifer RW (center; b, e, h) and of broadleaf RW (right; c, f, i) vs. monthly temperature (a, b, c), precipitation (d, e, f) and SPI_3 (g, h, i) from March of the year prior to growth to September of the year of growth. In (a), (b), (c) the percentages of the species composing the pool for each site used for the analysis is reported. Means of statistically significant (p < 0.05) correlation coefficient values (r) are depicted with squares, whereas maximum and minimum significant r values are indicated with grey lines; the blue lines depict the total number of sites in each comparison and the green lines indicate the total number of sites with statistically significant r values. Black-filled squares are given for those variables that show significant correlation values for at least 50 % of the total sites and have |r| >0.25; where both conditions occur, a circled number in the plot is given and the comparisons are selected for the following moving correlation analysis (Fig. 5). In each plot the climate variables with the highest number of sites with significant r values and nearby variables showing up to one-half of this number are depicted with a black area.
3 Results
Site chronologies.We obtained 15 RW site chronologies (11 from conifers and 4 from broadleaves) and 8 MXD site chronologies (from conifers) and we used them to estimate climate sensitivity at the site level and to detect the most important climatic drivers over the study region (for species percentages, see boxes in Fig. 3a, b and c). We performed the construction of the HSTC chronologies (for the analy-sis of the temporal stability of climate signals and for cli-mate reconstruction) using also the individual series from the 12 sites (5 from conifers and 7 from broadleaves; see Ta-ble 1, bold values in TaTa-ble 2 and Sect. 2) for which the site chronologies did not meet the quality standards. The max-imum time span of tree-ring data covers the period from 1415 (ITRDBITAL015) to 2013 (QFIMP1 and QFIMP2).
However, the mean chronology length is 215 ± 130 years for conifers and 175 ± 25 years for broadleaves (values rounded to the nearest 5 years; Table 2). Over the common period con-sidered (1880–1980 for all MXD and RW chronologies), the mean series intercorrelation and expressed population signal are approximately 0.5 and 0.8, respectively.
Tree-ring sensitivity to climate.The site-specific sensitiv-ity analysis performed over the common period of 1880– 1980 revealed that MXD in conifers records stronger cli-matic signals than RW in either conifers or broadleaves, in terms of the average correlation coefficient, the number of months showing statistically significant values (p < 0.05) and the fraction of chronologies (over the maximum number available) responding to the same climatic variable (Fig. 3). In particular, all conifer MXD chronologies were found to be positively influenced by late summer temperatures
(Au-gust and September), whereas precipitation from June to August is negatively correlated with most of them (Fig. 3a and b). In terms of SPI, the highest correlations (for both MXD and RW) were obtained for the indices calculated at the timescales of 2 and 3 months (only the SPI at 3 months, SPI_3, is reported in the Results), while longer timescales showed fewer significant correlation values. Most conifer MXD were found to be negatively correlated with SPI_3 from June to September, highlighting that low index values, i.e., drought periods, are associated with high MXD in the tree rings, and vice versa (Fig. 3c).
For conifer RW, significant correlation coefficients, i.e., those exceeding the mean value of |r| > 0.25 for more than 50 % of the available chronologies, were obtained only for the August temperatures of the year prior to growth (a neg-ative correlation; Fig. 3b). In the other months, correlations are generally low and sometimes show opposite signs for the same climatic variable. However, a slightly stronger influ-ence from the climatic variables for the summer months prior to growth can be noted (black areas in Fig. 3a, d and g).
Broadleaf RW were found to be positively influenced by high precipitation and low drought occurrences (high SPI_3 values) during the summer months (June and July precipita-tion and June to August SPI_3; Fig. 3f and i), whereas the temperature did not show a significant influence (Fig. 3c).
Influence of environmental settings on climate–growth re-lationships and site fitness.We found that the strength of the AS signal correlated positively with latitude (mean precip-itation) and negatively with elevation (longitude; Fig. 4a). Summer precipitation amounts and elevation correlated neg-atively in our data set of MXD, revealing the dominance of the latitudinal gradient of larger precipitation in northern ar-eas over the expected altitudinal gradient of higher precipi-tation at higher altitudes: sites in northern areas, even if at lower altitudes, receive more summer precipitation than sites in southern regions at higher altitude. The RDA analysis re-vealed that both parameters were on opposing sides of the first two axes explaining 89.55 % of the variance of the data set: the F1 axis alone explains up to 72 % of the variance in response variables, and especially in AS temperature and JJAS SPI_3 signals. Concerning site fitness, especially sites located at higher latitudes, in particular north of 42◦N (all of Abies alba) presented values of SF > 80 %, and up to 86 % (Fig. 4b). South of 42◦N, all sites (including two sites of Abies alba) presented an SF of approximately 10 %, with the Pinus leucodermissite showing the highest SF value (52 %) and a P. nigra site the lowest (0 %).
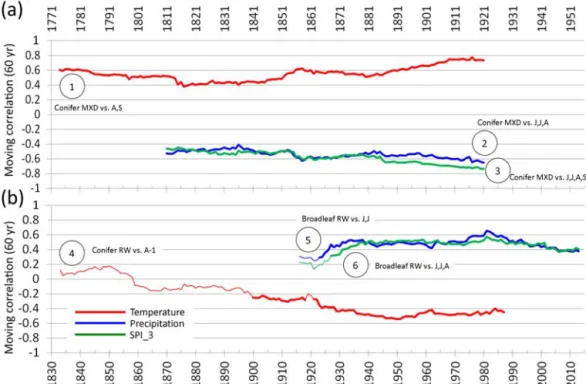
Stability of the climatic signal over time. The six com-parisons performed between the HSTC chronologies and the DCVs were deemed important to understand the influence of temporal climatic variability on conifers MXD and RW and on broadleaf RW (Fig. 5). The moving-window correla-tion analysis revealed that the HSTC conifer MXD chronol-ogy held the strongest and most stable climatic signal of late summer temperature over time, with values of correlation
co-Figure 4.Ordination biplot (RDA analysis) of climate–growth
re-lationships (response variables, Y ) and environmental settings (ex-planatory variables X: elevation and climatic averages over the pe-riod 1880–1980) (a). Site fitness evaluated on single indexed series included in the MXD HSTC chronology (SF; Leonelli et al., 2016) and total series per site (grey line) (b). Sites are ordered with de-creasing latitude along the x axis. Mean SF values for each species are also reported. ABAL stands for Abies alba; PILE stands for Pi-nus leucodermis; PINI stands for PiPi-nus nigra.
efficient ranging from approximately 0.4 to nearly 0.8 in the more recent periods analyzed (curve 1 in Fig. 5). In the other two HSTC chronologies based on conifer MXD (curve 2 and 3 in Fig. 5), starting from the time window 1881–1940 up to recent periods, we always found higher absolute values for SPI_3 than for precipitation, with values of correlation reach-ing approximately −0.7 and −0.6, respectively, (curve 3 and 2 in Fig. 5). For the conifer RW, a strong change in the tem-perature signal of August prior to growth was found (curve 4 in Fig. 5), with correlation values shifting from positive (and statistically non-significant) in the early period of analysis to negative (approximately −0.5) in the middle to late anal-ysis period. The two HSTC chronologies of broadleaf RW showed nearly the same correlation values and similar pat-terns with both the June and July precipitation and the June
Figure 5.Bootstrapped moving correlation analysis with a 60-year time window, performed over the maximum period available for the HSTC chronologies and their respective climate variables (temperature, precipitation and SPI_3) selected in the previous analysis (circled numbers as in Fig. 3). The statistically significant values (p < 0.05) of r are depicted by bold lines.
to August SPI_3, with values at approximately +0.5 (curve 5 and 6 in Fig. 5).
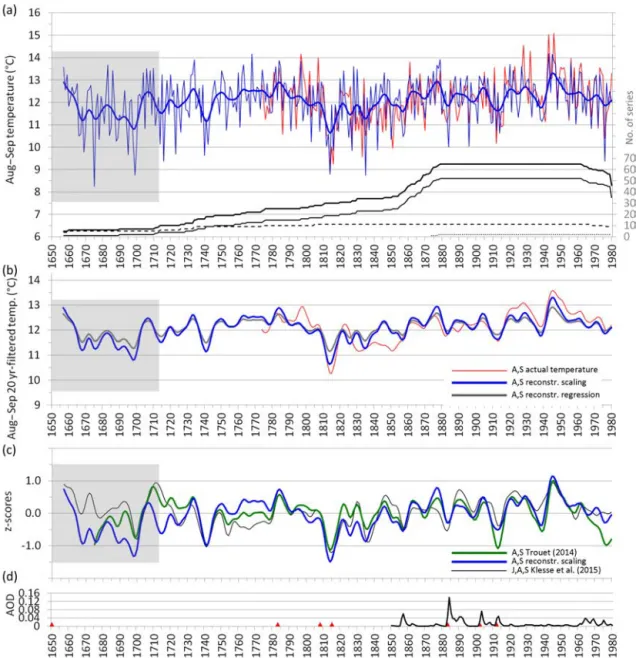
Climate reconstruction. The reconstruction of the late summer temperature for the Italian Peninsula was, therefore, based on the HSTC chronology of conifer MXD, while the conifer RW chronology was disregarded due to its low sig-nal stability over time. The reconstructed series based on the scaling approach starts in 1657 and has a minimum sample replication of ten trees from 1713 (Fig. 6a); it reproduces well the variability of the instrumental record and under-lines the periods of climatic cooling (and likely also wetter conditions) in the years 1699, 1740, 1814, 1914 and 1938. The low-pass-filtered series emphasize the mid-length fluc-tuations and show evidence of periods of temperature under-estimations (centered around 1799, 1925 and 1952) and of overestimations (around 1846; Fig. 6b); however, the differ-ences from the instrumental record were always found to be within 1◦C for both scaling and regression approaches. The
two models tended to have higher values when they were cal-ibrated over the period 1781–1880 and lower values when they were calibrated over the period 1881–1980 (Table 3). The CE statistics showed similar patterns of RE and its val-ues were always positive for both the regression and the scal-ing model.
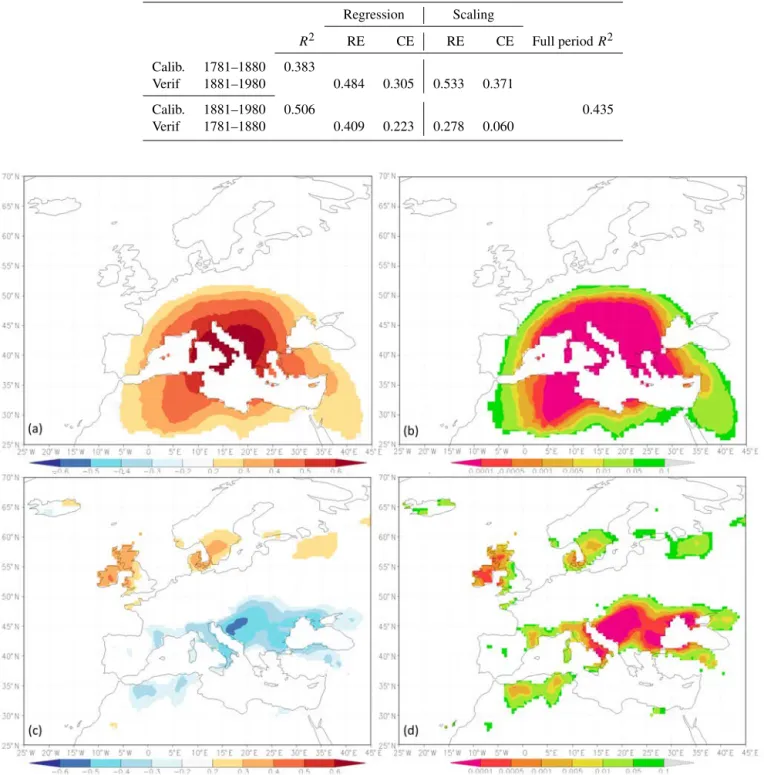
Spatial coherence of the reconstruction. The spatial co-herence of the late summer temperature reconstruction of the Italian Peninsula performed over the Mediterranean region indicated that, for the period of 1901–1980 (defined by the
beginning of the CRU TS 4.0 climate series and the end of the MXD series), the reconstructed temperature series matched very well the temperature variability in Italy south of the Po Plane, Sardinia and Sicily and the western Balkan area (r > 0.6). Correlations above 0.4 were still found through-out the Alpine arc, the central Balkans, western Anatolia, as well as in northwestern Maghreb (Fig. 7a, b). In detail, the reconstructed temperature highly correlated westward up to Sicily and Sardinia, and eastward to the western Balkan area along the Adriatic Sea up to northern Greece, whereas r values were already lower than 0.5 in a wide arc includ-ing northern Tunisia, southern France, the inner range of the European Alps, Turkey and southern Anatolia. The recon-structed AS temperature series significantly correlated also with mean AS precipitation, especially in a wide belt be-tween 35◦and 50◦N centered over Croatia (negative corre-lations, below −0.6) and the Balkan region up to the Black Sea. For Italy, correlations above 0.4 were found in the south-ern portion of the peninsula, whereas weaker correlations were found westward up to the eastern Pyrenees and north-ern Maghreb. Positive correlations, above 0.3, were found in a belt in northern Europe at approximately 55◦N, centered over Ireland, Scotland and Wales, and up to Denmark and the southern Scandinavian Peninsula (Fig. 7c, d).
Figure 6.Reconstruction of late summer (August and September) temperature using the conifer MXD chronology with the scaling approach for the period 1650–1980 (a). The bold black line indicates the total number of series (composed by a number of Abies alba (thin black line),
Pinus leucodermis(dashed line) and P. nigra (dotted line) specimens). The low-pass-filtered series with a 20-year Gaussian smoother for
both the reconstructions based on scaling and regression are also depicted (b). The reconstructions were truncated when there were fewer than 5 trees, and the grey areas in the graphs depict the period where the conifer MXD chronology shows an EPS < 0.79 (prior to 1714, fewer than 10 trees. EPS > 0.85 from 1734). A comparison of the reconstructed late summer temperature (this paper) with the ones of Trouet (2014) and Klesse et al. (2015) using z scores series (calculated over the common period 1714–1980 with EPS > 0.8 in all the original chronologies), filtered with a 20-year Gaussian low-pass filter (c). At the bottom the annual mean of stratospheric aerosol optical depth (AOD) at 550 nm for the Northern Hemisphere is reported (d); data set available at https://data.giss.nasa.gov/modelforce/strataer/; site accessed 30 May 2017; the red triangles mark major volcanic eruptions (volcanic explosivity index ≥ 6): in chronological order Kolumbo-Santorini, Grímsvötn, source unknown, Mount Tambora, Krakatau, Santa María and Novarupta.
4 Discussion
The climate signals recorded in the multispecies and multi-proxy tree-ring network from the Italian Peninsula revealed a general coherence with other climate–growth analyses per-formed in Mediterranean environments. As found in the
Pyrenees for a conifer tree-ring network (Büntgen et al., 2010), we found generally strong and coherent signals in MXD, independent of species. In particular, in our record, the late summer temperature was well recorded in MXD chronologies, and the correlations with climate were stable over time. The MXD chronologies were mainly related to
Table 3.Reconstruction statistics computed for both regressions and scaling over the inverted subperiods of calibration and verification. RE stands for reduction of error; CE stands for coefficient of efficiency.
Regression Scaling R2 RE CE RE CE Full period R2 Calib. 1781–1880 0.383 Verif 1881–1980 0.484 0.305 0.533 0.371 Calib. 1881–1980 0.506 0.435 Verif 1781–1880 0.409 0.223 0.278 0.060
Figure 7.Spatial correlation pattern of the reconstructed late summer temperature (using the MXD chronology from the Italian Peninsula)
versus the 0.5◦grid CRU TS 4.0 August–September mean temperature (a, b) and mean precipitation (c, d), over the period of 1901–1980.
Left side (a, c) Pearson’s correlation coefficients; right side (b, d) the associated p values.
temperature; however, we found clear signals of the influence of summer precipitation and drought. In the Mediterranean area, especially during summer, high temperature is often as-sociated with low precipitation and drought; therefore, when
interpreting the temperature reconstructions based on tree-ring MXD in the Mediterranean area, the associated influ-ence of precipitation and droughts on MXD should also be taken into account. The SPI, which was used here to
repre-sent drought conditions, was found to have higher correla-tions with both MXD and RW for the index calculated at the timescales of 2 and of 3 months, whereas lower correlations were found at lower (1-month) and higher (6-, 9- and 12-month) timescales. Thus, trees respond to the drought signal at this timescale, which reflects soil moisture droughts in the root zone (the SPI_3 is also the index used for modeling agri-cultural droughts; see, e.g., WMO, 2012). Conversely, trees apparently do not respond strongly to the signal of hydro-logical droughts at the catchment level (SPI at timescales of above 6 months).
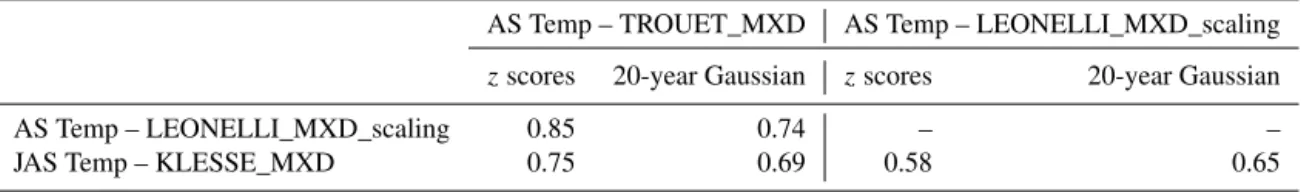
The reconstructed series of the late summer temperatures for the Italian Peninsula were shown to have a strong coher-ence with the instrumental record and with both the recon-struction of AS temperature proposed by Trouet (2014) for the northeastern Mediterranean–Balkan region, and of JAS temperature proposed by Klesse et al. (2015; Fig. 6c and Ta-ble 4). The three reconstructions are highly consistent, and the reconstruction of Trouet (2014) also includes the sites used in this paper. However, there are some differences be-tween the Trouet (2014) reconstruction and the one presented here: our reconstructed AS temperature in the Italian Penin-sula tends to generally show less marked negative fluctua-tions over time than the reconstruction from the Balkan area. While common periods of climatic cooling were recorded in both areas in 1741 and 1814, similar events were seen in 1913 and in 1977 only in the Balkan area. Interestingly, the periods of the larger differences between the reconstructed AS temperature and the instrumental record (around 1799, 1846, 1925 and 1952) are also those with strong coherence between the two reconstructions, suggesting a regional con-sistency in the responses to climate, possibly facilitated by similar precipitation patterns in the two regions during late summer. We also compared all these tree-ring-based tem-perature reconstructions (of AS and JAS) with the summer (JJA) temperature gridded Luterbacher et al. (2004) data set (based on proxy, documentary and instrumental data), for the grid points containing our MXD sites and over the common period covered by instrumental data from Italy used in the present work, i.e., from 1763 (Supplement S1). Both the in-strumental data for Italy and the proxy-based reconstructions showed good coherence with Luterbacher et al. (2004) at the decadal scale, however in the 1790–1810 period they showed opposite trends (with generally lower temperatures than in Luterbacher et al., 2004) and more marked negative fluctua-tions in the 1810s.
Contrary to what was found in our reconstruction and in the northeastern Mediterranean, another late summer temper-ature reconstruction from Corsica, based on tree-ring stable carbon isotopes (Szymczak et al., 2012), shows periods of high temperatures at the end of 1600 and beginning of 1700 and a very slight cooling during the 1810s, probably owing to the effect of the surrounding seas.
An important factor influencing the tree-ring MXD is vol-canism, especially with regards to highly explosive eruptions
that can change the intensity of the incoming solar radiation and that are able to change circulation patterns and cool the climate at the hemispheric to global scale (e.g., Briffa et al., 1998). The largest explosive eruptions (volcanic explosivity index ≥ 6; Siebert et al., 2011) correspond to local minimum densities in the tree rings (Fig. 6c and d), and some of them are well known to be associated with years of famine and low crop yields. The year 1699 and the proceeding decades are known for being years of recurrent explosive eruptions in Iceland and Indonesia (Le Roy Ladurie, 2004), inducing great famines around Europe and North America (Mitchi-son, 2002). The 1809 eruption of unknown source (Guevara-Murua et al., 2014) and the 1815 eruption of Mount Tamb-ora induced a decade of very low summer temperature and high precipitation (Luterbacher and Pfister, 2015). This was the coldest decade of the Little Ice Age (Lamb, 1995), cor-responding also to glacier advance phases in the Alps that reached their first maximum extent of the Holocene (the sec-ond and last, was around 1850; e.g., Matthews and Briffa, 2005). Eruptions of Mount Krakatoa in 1883 and of No-varupta (Aleutian Range) in 1912 correspond to local minima in the MXD. But a straightforward relationship between min-imum values of MXD densities and large eruption is lack-ing: some differences of the regional scale with respect to the global scale may occur owing to local circulation pat-terns and/or the presence of seas, as it is the case of the 1783 Grímsvötn Volcano eruption (Iceland), which corre-lates with unexpected high MXD densities in tree rings from the Mediterranean area (Fig. 6) but not at the global scale (see Fig. 1 in Briffa et al., 1998), or the local minimums of MXD density of 1740 and 1938 found in this paper that are not linked to any particular large eruption.
The Apennines and the European Alps often show sim-ilar annual changes in precipitation amounts. However, in some periods, they show opposite decadal trends, such as af-ter 1830, when precipitation was increasing in northern Italy but decreasing in the south, and after 2000, when the op-posite behavior was observed (Brunetti et al., 2006). In the Italian Peninsula, the summer (JJA) and the autumn (SON) precipitation in 1835–1845 showed local minimum values in the instrumental record, likely inducing higher densities in the tree-ring latewood and, therefore, overestimations in model temperature values (Fig. 6b). Moreover, uncertainties between the instrumental records and MXD may rise given that trees do not respond linearly to high temperatures, result-ing in a divergence between climatological and MXD records (e.g., for the Alps and Europe; Battipaglia et al., 2010). As found in this study, MXD is influenced by both late sum-mer temperature and sumsum-mer precipitation and drought. In the Mediterranean, these variables are usually negatively cor-related. Therefore, in some periods, a given value of MXD could have been caused either by temperature and less by drought or vice versa. Of the considered explanatory envi-ronmental variables, it is especially the latitudinal regime of summer precipitation that modulates the MXD
sensitiv-Table 4.Intercorrelation between reconstructed temperature series of late summer (AS; Trouet, 2014; Leonelli et al., this study) and of summer (JAS; Klesse et al., 2015) based on tree-ring MXD in the study region. The correlation coefficients were calculated over the common period 1714–1980, for both z scores and 20-year filtered series.
AS Temp – TROUET_MXD AS Temp – LEONELLI_MXD_scaling
zscores 20-year Gaussian zscores 20-year Gaussian
AS Temp – LEONELLI_MXD_scaling 0.85 0.74 – –
JAS Temp – KLESSE_MXD 0.75 0.69 0.58 0.65
ity to AS temperature and to summer drought (Fig. 4a): sites in northern Italy (more mesic and at lower elevation) show stronger climate signals than sites in the southern areas (more xeric and at higher elevation). In addition to the stronger AS temperature influence on MXD in the northern chronologies, the effect of summer precipitation/drought becomes equally stronger at the southern sites. MXD sites from southern Italy present a markedly lower SF than sites from central-northern Apennines. Considering the responses related to the type of species that in our data set the influence of AS temperature on MXD in A. alba is more affected by summer precipitation amounts than in P. leucodermis and P. nigra. On the other hand, the influence of summer drought on MXD in pines is more affected by elevation.
Climatic signals recorded in RW tree-ring chronologies of conifers and broadleaves showed fewer clear common pat-terns in their correlations with climate variables than conifer MXD, although some climatic signals, which were valuable for climate reconstructions and for understanding climate im-pacts on tree-ring growth, were detected. In our records, the summer drought signal was clearly recorded at all broadleaf sites (Fig. 3i), with moist periods (low recurrence of drought, i.e., high SPI_3 values) positively affecting tree-ring growth. The drought signal (as well as the precipitation signal) was fairly stable over time (curve 6 and 5 in Fig. 5), suggest-ing the possibility for climate drought (and precipitation) re-constructions in the Italian Peninsula with the availability of longer dendrochronological series. Differently from Levaniˇc et al. (2015), we did not find a stable signal in conifer RW as-sociated with the temperature signal, even though our corre-lations are related only to August−1temperatures (curve 4 in
Fig. 5). The signal of previous August temperatures recorded in conifer chronologies (Fig. 3b) is too variable through time to allow for a reconstruction (Fig. 5). Here, the change in sen-sitivity is probably related to the negative effect of droughts in summer and autumn (June to October) prior to growth (see SPI_3 correlations; Fig. 3h). The question of the temporal stability of climate–growth relationships is sometimes under-estimated in climate reconstructions, even though changes of climate signals over time have been identified in the Mediter-ranean region (Lebourgeois et al., 2012; Castagneri et al., 2014) and in the European Alps (Leonelli et al., 2009; Cop-pola et al., 2012).
Tree-ring growth may be affected also by large-scale climate variability, such as the North Atlantic Oscillation (NAO), the prominent mode of atmospheric circulation in the North Atlantic that affects temperature and precipita-tion patterns in Europe (D’Arrigo et al., 1993; Cook et al., 2002). In the eastern Mediterranean region centered over Bulgaria, Trouet et al. (2012) found a teleconnection, driven by summer NAO, between summer climate conditions in the British Isles and a summer temperature reconstruction based on MXD of Pinus heldreichii. For Greece and the re-gion eastward, a prominent dipole pattern of summer NAO over Europe was also found (Klesse et al., 2015). With our MXD chronology we find a comparable dipole pattern in late summer precipitation, but not in temperature. In Italy a ma-jor effect on tree-ring growth was found for winter NAO, which correlates negatively with winter precipitation, which in turn determines soil moisture during the growing season (Piovesan and Schirone, 2000). Temporal instabilities of tree growth with climatic variables may be linked to several envi-ronmental and physiological factors that may influence tree growth processes and tree-ring sensitivities to climate, such as the still-debated fertilization effect due to increasing CO2
concentration in the atmosphere (e.g., Brienen et al., 2012). On the other hand, biomass production and tree growth in Mediterranean forests seem to be linked to nutrient availabil-ity and environmental constraints rather than to the avail-ability of CO2 (e.g., Jacoby and D’Arrigo, 1997; Körner,
2003; Palacio et al., 2013). Local low-energy geomorpholog-ical processes such as sheetfloods (e.g., Pelfini et al., 2006) may impact tree-ring growth as well as the presence of an active volcano and its direct influence on local climate and atmospheric conditions (such as the Vesuvius Volcano, Bat-tipaglia et al., 2007; or the Etna Volcano, Seiler et al., 2017), or air/soil pollution linked to SO2, NO2 or O3 depositions
and dust depositions from industrial plants or mines (in cen-tral Europe; Elling et al., 2009, Kern et al., 2009; Sensula et al., 2015): all these environmental factors may lower the tree-ring sensitivity to climate. Emissions from car traffic may also alter the tree-ring stable isotope signals and the related climatic signals (Saurer et al., 2004; Leonelli et al., 2012). The species-specific physiological responses of tree growth to climate variability may be nonlinear when high summer temperatures and low soil moisture exceed specific physio-logical thresholds, and can interrupt tree-ring growth during
the growing season in Mediterranean climates (Cherubini et al., 2003). In terms of ecological factors, the recurrent at-tacks of defoliator insects (e.g., the pine processionary moth; Hódar et al., 2003), the occurrence of forest fires (e.g., San-Miguel-Ayanz et al., 2013) or herbivory grazing and land abandonment (Herrero et al., 2011; Camarero and Gutiérrez, 2004) may influence vegetation dynamics and tree growth in Mediterranean forests, thus potentially introducing non-climatic effects into the chronologies.
Our reconstruction of the late summer temperature based on conifer MXD shows a clear stable climatic signal over time, and we could define the spatial coherence of the tem-perature reconstruction, thus allowing for the determination of the regions that could be included to extend the recon-struction further back in time. The late summer temperature reconstruction of Trouet (2014) is more appropriate for the region around the southern and inner Balkans; our recon-struction is the first fully coherent late summer temperature reconstruction for Mediterranean Italy, extending in a west– east direction from Sardinia and Sicily to the western Balkan area. As evidenced by the site-level analysis, MXD depends also on precipitation and drought (Fig. 3b and c), especially in southern sites: our late summer temperature reconstruc-tion also negatively correlates with late summer precipita-tion, more in southern than in the central and northern Italian Peninsula, in the whole Balkan region up to the Black Sea and especially in a region centered over Croatia. By contrast, it is positively correlated with precipitation in Ireland, Scot-land and southern Scandinavia. This spatial approach allows for the definition of areas responding to climatic forcing in homogenous ways, which may also help predict the forest response to future climate change in the Mediterranean re-gion.
5 Conclusion
The climate sensitivity analysis of a multispecies RW and MXD tree-ring network from the Italian Peninsula reveals that conifer MXD chronologies record a strong and stable signal of late summer temperatures and, to a lesser extent, of summer precipitation and drought. In contrast, the signals recorded by both conifer and broadleaf RW chronologies are less stable over time but are still linked to the summer cli-mates of the year prior to growth (conifer) and the year of growth (broadleaves). The MXD sensitivity to AS tempera-ture and to summer drought is mainly driven by the latitu-dinal gradient of summer precipitation amounts, with sites in northern areas (above 42◦N, all silver fir sites, at lower altitudes) showing stronger climate signals than sites in the south (below 42◦N, mainly P. leucodermis and silver fir sites at higher altitudes).
The reconstruction of the late summer temperatures over the 300 years up to 1980, based on the conifer MXD chronologies, shows a strong coherence with the
recon-struction performed by Trouet (2014) for the northeastern Mediterranean–Balkan region and by Klesse et al. (2015) for Greece and region to the east. With respect to the former re-construction, however, the temperatures reconstructed in our study show less marked negative fluctuations during the last century, likely because all of our sites are located along the Italian Peninsula and are relatively close to the sea. Accord-ing to our reconstruction, 1699, 1740, 1814, 1914 and 1938 were years of particularly low late summer temperatures over the study region (with some of them linked to large vol-canic eruptions affecting climate at the global scale), whereas the highest temperature was found in 1945. The late sum-mer temperature reconstruction proposed here is representa-tive of a wide area covering the Italian Peninsula, Sardinia, Sicily and the Balkan area close to the Adriatic Sea. These areas could be considered to further enhance the regional re-construction discussed here. Moreover, this rere-construction is correlated also with late summer precipitation in the central Mediterranean and the Balkan region, thus further helping to better assess climate change impacts on forests in homoge-nous areas within the Mediterranean climate change hot spot.
Data availability. Data used in this study are available in
Supple-ment S2.
The Supplement related to this article is available online at https://doi.org/10.5194/cp-13-1451-2017-supplement.
Competing interests. The authors declare that they have no
con-flict of interest.
Acknowledgements. This study was funded by the project of
strategic interest NEXTDATA (PNR National Research Programme 2011–2013; project coordinator Antonello Provenzale CNR-IGG, WP leader Valter Maggi UNIMIB and CNR-IGG), and by the following PRIN 2010–2011 projects (MIUR – Italian Ministry of Education, Universities and Research): grant nos. 2010AYK-TAB_006 (national leader C. Baroni) and B21J12000560001 “CARBOTREES”.
This study is also linked to activities conducted within the following COST Actions (European Cooperation in Science and Technology), financially supported by the EU Framework Programme for Research and Innovation HORIZON 2020: FP1106 “STReESS” (Studying Tree Responses to extreme Events: a SynthesiS), and CA15226 CLIMO (Climate-Smart Forestry in Mountain Regions). We thank several researchers who uploaded their raw data onto the ITRDB as well as the two anonymous reviewers and Jürg Luterbacher for their useful comments and suggestions.
Edited by: Jürg Luterbacher