nisolone produced a weak signal at a slightly different retention time. At the evaluated concentration of 5000 g/L, prednisolone produced a signal equivalent to 20 g/L cortisol, representing a 0.4% interference. Fenofi-brate generated parent ions at m/z 361 and 363 in an abundance ratio of 3:1, a distinctive pattern related to the presence of chlorine in the chemical composition. In MS/MS mode, fenofibrate produced a m/z 3633121 tran-sition that interfered with the quantitative trantran-sition of cortisol, but it did not produce the m/z 363397 transition. Thus, switching to the secondary transition for quantifi-cation eliminated interference from this drug. In addition, the elution time of the drug was⬃30 s longer than that of cortisol.
Taylor et al. (1 ) noted isotopic exchange between the deuterated IS and hydrogen-containing vapors in an APCI ion source. Unlike the observations of Taylor et al., we have not observed isotopic exchange with our APCI interface. The reason for this difference is unclear, but it may be related to ion source conditions. The good agree-ment obtained between our method and the comparison LC-MS/MS method suggests that isotopic exchange did not affect the proposed method.
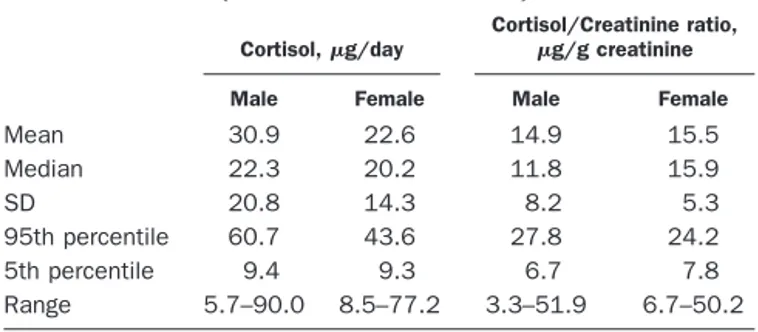
Apparently healthy adult volunteers (25 males and 25 females; age range, 19 –53 years) collected 24-h urine samples without preservative. The volunteers were asked to keep samples under refrigeration during the collection. Statistical results for this study are presented in Table 1.
To evaluate agreement between the established refer-ence interval with UFC values in the population, we
evaluated results for 2089 random 24-h urine specimens analyzed with the proposed method (Fig. 1). The mean (SD) value for log-transformed UFC excretion in 24 h was 1.26 (0.24) logg/24 h (minimum and maximum, 0.3 and 3.84 logg/24 h, respectively), and skewness and kurto-sis for the distribution were 1.51 and 5.57, respectively.
The stability of cortisol in urine was evaluated in the presence of acetic (15 mmol/L), boric (15 mmol/L), and hydrochloric (30 mmol/L) acid. Two samples without added acid were stored and analyzed under the same conditions as the samples stored with the acids. Samples were stored at room temperature, 4 °C, and⫺20 °C and analyzed every 4 –7 days during 1 month of storage. Cortisol concentrations in samples stored with the acids were higher by ⬃30% than in samples stored without acid, possibly as a result of partial hydrolysis of sulfate and glucuronide conjugates.
In conclusion, the rapid LC-MS/MS method for UFC analysis appears to be free from interference and agrees closely with a HPLC-MS/MS method that uses sample extraction. The method has been demonstrated reliable in a high-volume clinical laboratory environment.
References
1. Taylor RL, Machacek D, Singh RJ. Validation of a high-throughput liquid chromatography–tandem mass spectrometry method for urinary cortisol and cortisone. Clin Chem 2002;48:1511–9.
2. Nassar AEF, Varshney N, Getek T, Cheng L. Quantitative analysis of hydro-cortisone in human urine using a high-performance liquid chromatography-tandem mass spectrometric-atmospheric-pressure chemical ionization method. J Chromatogr Sci 2001;39:59 – 64.
3. Huang CM, Zweig M. Evaluation of radioimmunoassay of urinary cortisol without extraction. Clin Chem 1989;35:125– 6.
4. Whitley RJ, Meikle AW, Watts NB. Endocrinology. In: Burtis CA, Ashwood ER, eds. Tietz textbook of clinical chemistry, 2nd ed. Philadelphia: WB Saunders, 1994:1801.
Pediatric Concentrations of S100B Protein in Blood: Age- and Sex-related Changes, Diego Gazzolo,1 Fabrizio
Michetti,2* Matteo Bruschettini,1 Nora Marchese,3 Mario
Lituania,1 Salvatore Mangraviti,3Enrico Pedrazzi,4and
Pier-luigi Bruschettini1 (1Department of Pediatrics, 3Clinical Chemistry Laboratory, Giannina Gaslini Children’s Uni-versity Hospital, I-16147 Genoa, Italy;2Institute of Anat-omy and Cell Biology, Catholic University, I-00168 Rome, Italy;4Clinical Chemistry Laboratory, Acqui Terme Hos-pital, I-15011 Acqui Terme, Italy; * address correspon-dence to this author at: Institute of Anatomy and Cell Biology, Catholic University, Largo Francesco Vito, 1, I-00168 Rome, Italy; fax 39-06-30154813, e-mail fabrizio. [email protected])
The term S100 refers to members of a multigenic family of calcium-modulated proteins, mostly of low molecular mass (⬃10 000 Da), first identified as a protein fraction detectable in the brain and called S100 because of its solubility in a solution of 100 g/L ammonium sulfate (1 ). The protein seems to be most abundant in glial cells, Fig. 1. Cortisol distribution in patient samples (n⫽ 2089).
Table 1. UFC in 50 apparently healthy adult volunteers (25 men and 25 women).
Cortisol,g/day
Cortisol/Creatinine ratio, g/g creatinine
Male Female Male Female
Mean 30.9 22.6 14.9 15.5 Median 22.3 20.2 11.8 15.9 SD 20.8 14.3 8.2 5.3 95th percentile 60.7 43.6 27.8 24.2 5th percentile 9.4 9.3 6.7 7.8 Range 5.7–90.0 8.5–77.2 3.3–51.9 6.7–50.2
although its presence in neuronal subpopulations has also been reported (2, 3 ).
The biological role of this protein within the cell pop-ulations that contain it has not been completely eluci-dated. The possibility of an extracellular biological role for S100B, which, secreted by astrocytes as a cytokine, may have a neurotrophic effect during both development and nerve regeneration at physiologic (nmol/L) concentra-tions, appears particularly interesting (4 –7 ). Recent stud-ies conducted in perinatal medicine that showed a corre-lation between S100B protein measured in several biological fluids (i.e., amniotic fluid, cord blood, and urine) and gestational age (8 –10 ) appear consistent with a neurotrophic role for the protein.
The present study offers a reference curve for S100B protein in peripheral blood from the postnatal period to 15 years of age in healthy pediatric patients.
Between April 1997 and July 2000, we routinely col-lected blood samples for S100B measurement from healthy children admitted to our Institute for routine day-hospital investigations. All of the children were de-livered at term without perinatal complications, and their clinical history, from birth to the time of blood sampling, was negative for neurologic abnormalities and comorbidi-ties. We recruited a total of 1004 healthy children (males, n ⫽ 482; females, n ⫽ 522) whose ages ranged from 1 month to 15 years of age (mean, 8 years).
On admission to the study, all of the patients were checked against routine clinical and laboratory indices, and height growth velocity was assessed according to the normograms for our population (11 ).
Exclusion criteria included multiple pregnancies; intra-uterine growth retardation; gestational hypertension, di-abetes, or infections; fetal malformations; chromosomal abnormalities; perinatal asphyxia or dystocia; obesity; pediatric infections or neuromuscular diseases; endocrine diseases; and congenital heart disease.
The Ethics Committee of the Giannina Gaslini Chil-dren’s Hospital, Genoa University, approved the study protocol, and the parents of the children who were examined gave informed consent.
For sampling, blood (1.5 mL) was drawn from the antecubital vein. Heparin-treated blood samples were immediately centrifuged at 900g for 10 min, and the supernatants were stored at ⫺70 °C until measurement. The S100B protein concentration was measured in all samples by a commercially available immunoluminomet-ric assay (Lia-mat Sangtec 100; AB Sangtec Medical). This assay is specific for the-subunit of the protein, which is known to be predominant (80 –96%) in the human brain
(12, 13 ). Each measurement was performed in duplicate
according to the manufacturer’s recommendations, and the averages were reported. The lower limit of detection of the assay was 0.02 g/L. The intraassay imprecision (CV) was⬍5%, and the interassay CV was ⬍10%.
S100B concentrations are expressed as the median and interquartile ranges. Statistical analysis was performed by comparing the groups by use of the Kruskal–Wallis one-way ANOVA and Mann–Whitney U-test when the
data did not follow a gaussian distribution. The correla-tion between the blood concentracorrela-tions of S100B and age at sampling was assessed by linear regression analysis. Reference curves for S100B values and age at sampling for all of the cases admitted to the study were assessed by use of a polynomial regression analysis. A P value⬍0.05 was considered significant.
All of the patients admitted to the study were in healthy clinical condition, and no overt neurologic injury was observed on discharge from the hospital. Routine clinical analytes recorded at sampling were within the appropri-ate reference intervals.
S100B protein concentrations in blood were measurable in all of the cases examined. We found that the concen-trations of the protein in children 0 –15 years of age presented a pattern consisting of a decrease from 0 to 7 years followed by an increase from 7 to 13 years and, finally, by a second decrease in S100B from 14 to 15 years of age. The median and interquartile range for S100B at 0 –1 year of age (median, 0.95g/L; 25th–75th percentiles, 0.44 –2.55 g/L) were substantially higher than those from 2 to 7 years of age (median, 0.73 g/L; 25th–75th percentiles, 0.44 –1.06g/L; P ⬍0.01 for all). The largest difference was recorded at 4 years (median, 0.63 g/L; 25th–75th percentiles, 0.36 –1.06 g/L, respectively). S100B concentrations at 0 –1 year were also higher than those found at 11–12 years of age (median, 0.45 g/L; 25th–75th percentiles, 0.39 – 45 g/L, respectively; P ⬍0.01) and significantly lower than those measured at 9 –11 years (median, 1.65 g/L; 25th–75th percentiles, 0.91–1.74g/L) and at 13–14 years of age (median, 1.23 g/L; 25th–75th percentiles, 1.12–2.01 g/L; P ⬍0.01). Moreover, blood S100B concentrations at 9 –11 and 13–14 years were significantly higher than those measured at 2–7 and 11–12 years (P⬍0.01 for all).
We found no significant differences in S100B concen-trations between 0 and 1 year, and between 14 and 15 years of age (median, 0.78 g/L; 25th–75th percentiles, 0.5– 0.87g/L respectively; P ⬎0.05; Fig. 1). The highest individual concentrations were observed in the first year of life and between and 9 and 10 years of age.
The S100B blood concentrations at different ages after correction for sex are shown in Table 1. Blood S100B concentrations in pediatric patients, monitored from birth to 15 years of age, were significantly higher in females (P ⬍0.05). Median concentrations of the protein in females were higher in the first 3 years of life and statistically significant only at 2–3 years of age (P ⬍0.05). These differences were also found at 6 –7 years and from 13 to 15 years of age (P⬍0.05 for all).
We found a negative correlation between blood S100B protein concentrations and gestational age both for all the cases admitted to the study (r ⫽ ⫺0.29; P ⬍0.001) and when the data were corrected for sex (male, r⫽ ⫺0.21; female, r ⫽ ⫺0.32; P ⬍0.001 for both). We also found significant correlations between blood S100B concentra-tions and height growth velocity values, both in all of the cases monitored (r ⫽ 0.33) and when the data were
corrected for sex (male, r⫽ 0.30; female, r ⫽ 0.34; P ⬍0.001 for all).
The reference curve was finally assessed by use of a polynomial regression analysis and showed a significant correlation between S100B and age at sampling both for all the cases studied (r⫽ ⫺0.49) and when the data were
corrected for sex (male, r ⫽ ⫺0.51; female, r ⫽ ⫺0.57, respectively; P⬍0.001 for all; Fig. 1).
The present data provide a reference curve indicating S100B concentrations in peripheral blood at different ages in the two genders. All of the patients showed measurable S100B concentrations in peripheral blood, in agreement with recent observations (14 –16 ).
It is interesting that blood S100B concentrations were correlated with age at sampling and showed significant gender differences in pediatric patients. The presence of S100B in pediatric patients, albeit in a smaller number of cases (85 vs 1004 in our study), was also reported by Portela et al. (16 ). Their data are essentially consistent with the present findings, although there are significant differences in the median concentrations of the protein. These discrepancies could be largely a result of the limited number of cases studied (n⫽ 44 vs n ⫽ 1004), as well as the reduced frequency of monitoring time points. These limitations may also be responsible for the lack of gender differences (16 ). The correlation between blood S100B concentrations and gestational age at sampling is in agreement with previous studies at prenatal, perinatal, and adult ages (7–10, 16, 17 ).
Our observation of higher S100B concentrations in children during the first year of age and in adolescence than at other ages is intriguing. One explanation for this phenomenon during the first year of age could involve a possible difference in the permeability of the blood– brain barrier and cerebral circulation, although this issue is still a matter of debate. Notwithstanding this, some involve-ment of the functional role of the protein should also be considered. Among the numerous functions attributed to this protein, all of which are still a matter of debate, the possibility that S100B acts as a cytokine with neurotrophic effects at physiologic concentrations appears to be inter-esting and relevant to the present study. Seen in this light, the progressive decrease in blood S100B concentrations after 2 years of age could reflect a reduced release of the trophic factor at a more advanced stage of brain matura-tion. The progressive increase in concentrations of the protein in peripheral blood from 7 years onward, with a peak at 12–13 years, is in agreement with that shown by earlier anthropometric studies (11 ). The correlation be-tween height growth velocity values, an index suggestive of nerve elongation, and blood protein patterns at differ-ent monitoring ages is consistdiffer-ent with the possibility of a neurotrophic role of S100B in the pediatric period, as previously demonstrated in the perinatal period. In this respect, it has been extensively reported that the two periods under consideration (i.e., the first year of life and adolescence) are those in which height growth velocity is at its peak, with a standard index of growth of⬃15 and 9 cm per year, respectively (11 ). Additional support for this hypothesis is offered by the presence of S100B in periph-eral nerves and by its stimulating action on neurite outgrowth (5, 6, 18, 19 ).
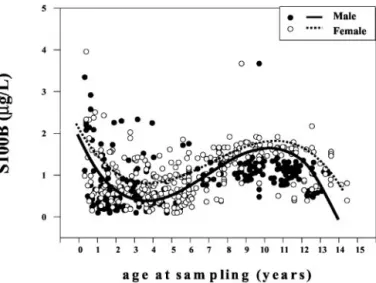
The present findings, pointing to a role of S100B as a trophic cytokine, suggest the possibility of reciprocal modulation of the protein and growth hormones: future Fig. 1. Correlation between individual S100B protein concentrations in
peripheral blood (g/L) and age at sampling (months) in male (F) and female (E) pediatric patients.
The filtered curve was obtained by use of a third-degree polynomial regression analysis. There was a significant negative correlation between age at sampling and blood S100B concentrations in both males (r⫽ ⫺0.51; P ⬍0.001; solid line) and females (r⫽ ⫺0.59; P ⬍0.001; dashed line).
Table 1. S100B blood concentrations (g/L) in healthy male and female pediatric patients at different ages of
sampling expressed in yearsa
Age at sampling, years (M/F) Males (nⴝ 482) Females (nⴝ 522) Pb Median 25th 75th Median 25th 75th 0–1 (43/42) 0.81 0.44 1.93 0.95 0.45 2.24 0.27 1–2 (46/40) 0.72 0.32 1.33 0.77 0.49 1.37 0.35 2–3 (52/48) 0.62 0.39 0.97 0.76 0.59 1.61 <0.05 3–4 (52/47) 0.70 0.32 1.27 0.66 0.37 0.89 0.70 4–5 (41/53) 0.61 0.31 1.00 0.74 0.44 1.10 0.29 5–6 (34/48) 0.68 0.32 1.24 0.56 0.36 1.10 0.59 6–7 (37/49) 0.60 0.43 0.96 0.86 0.65 1.17 <0.05 7–8 (28/39) 0.90 0.65 0.96 0.90 0.39 0.96 0.77 8–9 (35/52) 1.37 1.34 4.56 1.41 1.03 4.60 0.95 9–10 (41/32) 1.44 0.91 1.75 1.67 1.44 2.03 0.45 10–12 (24/18) 1.45 0.81 2.63 1.74 0.97 2.10 0.71 11–12 (16/16) 0.42 0.39 0.45 0.45 0.41 0.48 0.38 12–13 (10/8) 1.23 1.2 2.00 1.25 0.96 2.21 0.66 13–14 (17/18) 1.13 0.99 1.89 1.35 1.16 2.23 <0.05 14–15 (6/12) 0.66 0.45 0.72 0.91 0.52 0.97 <0.05 Total 1–15 (482/522) 0.80 0.44 1.49 0.95 0.58 1.62 <0.05 aData are shown as median and interquartile ranges.
bBold font indicates statistical significance.
studies using clinical and/or experimental approaches will address this hypothesis, regarding which little infor-mation is currently available. Similarly, we have no useful information at present regarding possible interactions between S100B and sex hormones, which could also be hypothesized on the basis of the gender differences found in S100B concentrations. More generally, the growing body of evidence that indicates a biological role of S100B as a cytokine points to the usefulness of future studies on possible interactions between this protein and individual hormonal patterns.
The most probable origin of S100B in peripheral blood, as previously reported in several studies, is nervous tissue, although we cannot exclude the possibility that it may also be released from other sites of concentration, such as adipose tissue (20 ). However, data on the pres-ence of the protein in adipose tissue at the ages studied here are not conclusive.
Finally, the different peaks of protein concentration in the two sexes could, in common with other clinical and anthropometric studies (i.e., height/weight growth refer-ence curves), suggest the possibility that brain maturation in the pediatric period differs in males and females, as it does in the intrauterine and adult periods (9, 21 ). In this respect it could be relevant that genetically modulated overexpression of S100B has been reported to affect the behavior of female mice without causing any appreciable effects in males in experimental models (22 ).
In conclusion, the reference curve for S100B protein in peripheral blood in healthy pediatric patients constitutes a useful tool to evaluate pathologic alterations of the protein during this period and also suggests an approach for future investigations into the suggested neurotrophic role of the protein, which could potentially be related to the process of maturation, including hormone concentra-tions.
References
1. Moore BW. A soluble protein characteristic of the nervous system. Biochem Biophys Res Commun 1965;19:739 – 44.
2. Rickmann M, Wolff JR. S100 protein expression in a subpopulation of neurons of rat brain Neuroscience 1995;67:977–91.
3. Yang Q, Hamberger A, Hyden H, Wang S, Stigbrand T, Haglid K. S100 has a neuronal localization in the rat hindbrain revealed by an antigen retrieval method. Brain Res 1995;696:49 – 61.
4. Haglid KG, Yang Q, Hamberger A, Bergman S, Widerberg A, Danielsen N. S100 stimulates neurite outgrowth in the rat sciatic nerve grafted with acellular muscle transplants. Brain Res 1997;753:196 –201.
5. Heizmann CW. Ca2⫹-binding S100 proteins in the central nervous system. Neurochem Res 1999;24:1097–100.
6. Donato R. S100: a multigenic family of calcium-modulated proteins of the EF-hand type with intracellular and extracellular functional roles. Int J Bio-chem Cell Biol 2001;33:637– 68.
7. Michetti F, Gazzolo D. S100B protein in biological fluids: a tool for perinatal medicine. Clin Chem 2002;48:2097–104.
8. Gazzolo D, Bruschettini M, Corvino V, Sarli R, Lituania M, Bruschettini PL, et al. S100B protein concentrations in amniotic fluid are correlated with gestational age and with cerebral ultrasound scanning parameter results in healthy fetuses. Clin Chem 2001;47:954 – 6.
9. Gazzolo D, Vinesi P, Marinoni E, Di Iorio R, Marras M, Lituania M, et al. S100B protein concentrations in cord blood: correlations with gestational age in term and preterm deliveries. Clin Chem 2000;46:998 –1000. 10. Gazzolo D, Bruschettini M, Lituania M, Serra G, Gandullia E, Michetti F.
S100B protein levels in urine are correlated with gestational age in healthy preterm and term newborns. Clin Chem 2001;47:1132–3.
11. Tanner JM, Whitehouse RH. Clinical longitudinal standards for height,
weight, height velocity, weight velocity, and stages of puberty. Arch Dis Child 1976;51:170 –9.
12. Jensen R, Marshak DR, Anderson C, Lukas TJ, Watterson DM. Character-ization of human brain S100 protein fraction: amino acid sequence of S100. J Neurochem 1985;45:700–5.
13. Baudier J, Glasser N, Haglid K, Gerard D. Purification, characterization and ion binding properties of human brain S100b protein. Biochim Biophys Acta 1984;790:164 –73.
14. Gazzolo D, Vinesi P, Bartocci M, Geloso MC, Bonacci W, Serra G, et al. Elevated S100 blood levels as early indicators of intraventricular hemor-rhage in preterm infants. Correlation with cerebral Doppler velocimetry. J Neurol Sci 1999;170:32–5.
15. Gazzolo D, Di Iorio R, Marinoni E, Masetti P, Serra G, Giovannini L, et al. S100B protein is increased in asphyxiated term infants developing intraven-tricular hemorrhage. Crit Care Med 2002;30:1–5.
16. Portela VC, Tort ABL, Schaf DV, Ribeiro L, Nora DB, Wulz R, et al. The serum S100B concentration is age dependent. Clin Chem 2002;48:950 –2. 17. Amer-Whalin I, Herbst A, Lindoff C, Thorngren-Jerneck K, Marsal K, Alling C.
Brain specific NSE, and S-100 proteins in umbilical blood after normal delivery. Clin Chim Acta 2001;304:57– 63.
18. Marshak DR. S100B as a neurotrophic factor. Prog Brain Res 1990;86: 168 – 81.
19. Selinfreud RH, Berger SW, Pledger WJ, van Eldik LJ. Neurotrophic protein S100B stimulates glial cell proliferation. Proc Natl Acad Sci U S A 1991; 28:3554 – 8.
20. Michetti F, Dell’Anna E, Tiberio G, Cocchia D. Immunochemical and immu-nocytochemical study of S100 protein in rat adipocytes. Brain Res 1983; 262:352– 6.
21. Nygaard Ø, Langbakk B, Romner B. Age- and sex-related changes of S100 protein concentrations in cerebrospinal fluid and serum in patients with no previous history of neurological disorders. Clin Chem 1997;43:541–3. 22. Gerlai R, Roder J. Female specific hyperactivity in S100 transgenic mice
does not habituate in open-field. Behav Brain Res 1993;59:119 –24.
Quantitative Spectrophotometric Microplate Assay for Angiotensin-converting Enzyme in Cerebrospinal Fluid,
J. Alan Erickson,1* Roxann Cousin,2 James T. Wu,1,3 and
Edward R. Ashwood1,3 (1ARUP Institute for Clinical and Experimental Pathology, LLC, Salt Lake City, UT 84108; 2ARUP Laboratories, Special Chemistry Section, Salt Lake City, UT 84108;3Department of Pathology, Univer-sity of Utah Health Sciences Center, Salt Lake City, UT 84132; * address correspondence to this author at: ARUP Laboratories, 500 Chipeta Way, Salt Lake City, UT 84108; fax 801-584-5109, e-mail [email protected])
Angiotensin-converting enzyme (ACE; EC 3.4.15.1) cata-lyzes the formation of angiotensin II by cleaving the C-terminal histidylleucine dipeptide from angiotensin I
(1 ). Indications are that ACE is affiliated with an
auton-omous renin-angiotensin system of the brain that partic-ipates in physiologic processes inside the brain (2, 3 ). In addition, studies suggest that changes in ACE concentra-tions in brain tissue, caused by various neurologic disor-ders, are reflected by alterations in ACE activity in cere-brospinal fluid (CSF) (4 ). For example, increased ACE concentrations in CSF are associated with neurosarcoid-osis (4 –7 ), with affected patients generally having activi-ties approximately twofold or more higher than those of healthy individuals (4, 6, 7 ). Increased CSF ACE has also been implicated in neurologic diseases, such as bacterial and viral meningitis and Behcet disease (4 –7 ). Decreased concentrations have been reported in patients with Alz-heimer disease, Parkinson disease, and progressive su-pranuclear palsy (8, 9 ).