Augmented Virtuality for Coastal Management:
A Holistic Use of In Situ and Remote Sensing for
Large Scale Definition of Coastal Dynamics
Sandro Bartolini1, Alessandro Mecocci1, Alessandro Pozzebon1,*ID, Claudia Zoppetti1,
Duccio Bertoni2ID, Giovanni Sarti2, Andrea Caiti3,4, Riccardo Costanzi3,4 ID, Filippo Catani5 ID, Andrea Ciampalini2,5ID and Sandro Moretti5
1 Department of Information Engineering and Mathematical Sciences, University of Siena, Via Roma 56, 53100 Siena, Italy; [email protected] (S.B.); [email protected] (A.M.); [email protected] (C.Z.) 2 Department of Earth Sciences, University of Pisa, Via Santa Maria 53, 56126 Pisa, Italy;
[email protected] (D.B.); [email protected] (G.S.); [email protected] (A.Ci.)
3 Department of Information Engineering, University of Pisa, Via Girolamo Caruso 16, 56122 Pisa, Italy; [email protected] (A.Ca.); [email protected] (R.C.)
4 Research Center “E.Piaggio”, ISME—Interuniversity Research Center on Integrated Systems for the Marine Environment, Largo Lucio Lazzarino 1, 56122 Pisa, Italy
5 Department of Earth Sciences, University of Florence, Via Giorgio La Pira 4, 50121 Firenze, Italy; [email protected] (F.C.); [email protected] (S.M.)
* Correspondence: [email protected]; Tel.: +39-349-424-5468 Received: 10 January 2018; Accepted: 7 March 2018; Published: 11 March 2018
Abstract:In this paper, the authors describe the architecture of a multidisciplinary data acquisition and visualization platform devoted to the management of coastal environments. The platform integrates heterogeneous data acquisition sub-systems that can be roughly divided into two main categories: remote sensing systems and in situ sensing systems. Remote sensing solutions that are going to be implemented include aerial and underwater data acquisition while in situ sensing solutions include the use of Radio Frequency IDentification (RFID) tracers, Wireless Sensor Networks and imaging techniques. All the data collected by these subsystems are stored, integrated and fused on a single platform that is also in charge of data visualization and analysis. This last task is carried out according to the paradigm of Augmented Virtuality that foresees the augmentation of a virtually reconstructed environment with data collected in the real world. The described solution proposes a novel holistic approach where different disciplines concur, with different data acquisition techniques, to a large scale definition of coastal dynamics, in order to better describe and face the coastal erosion phenomenon. The overall framework has been conceived by the so-called Team COSTE, a joint research team between the Universities of Pisa, Siena and Florence.
Keywords:coastal monitoring; remote sensing; in situ sensing; augmented virtuality; AUV; drones; RFID; Wireless Sensor Networks; 3D imaging
1. Introduction
The preservation of coastal areas is a major challenge that any administration has to deal with in the new millennium. Coastal areas are paramount for several reasons, spanning from economic factors to naturalistic aspects. For instance, the economy of many littoral territories is based on tourism (e.g., beach resorts, restoration, leisure activities) or port activities (e.g., commerce, industries, tourism); environmental features, such as dunes, sea fauna and flora, also draw the attention of dedicated tourism, not to mention the importance of the naturalistic value. Coastal erosion has been a worldwide issue since the Eighties [1], affecting more than 70% of sandy coasts, and this percentage has never
decreased. It is a complex process, characterized by the interaction of a variety of different factors: for instance, it can be either more or less intense locally along the very same beach. In general terms, the erosion processes are triggered by a significant decrease in river bedload transport rates: the sediments do not reach the sea and the littoral currents, once responsible for the longshore distribution of the river sediments to feed the adjacent beaches, begin to entrain the grains that already constitute the beaches [2]. The sediments would shift according to the direction of the littoral drift, but they would not be replaced. Progressively, the updrift sector of the beach would be eroded, whereas the downdrift sector might experience accretion unless the sediments are lost offshore. The factors that may induce river bedload reduction include changes in land use, the proliferation of hard embankments covering the river banks and dams hampering the sediment movement towards the coast, the extensive quarrying of the riverbed, and also the protection of mountain slopes from hydrological processes, which reduce soil erosion and the production of loose sediments [3]. Not only human-related activities along the river catchment contribute to worsening the erosion processes, at least at the local scale: for instance, port structures such as piers or seawalls interrupt the natural longshore distribution of sediments, leading to updrift accretion and downdrift erosion at either sides of the structure. Sometimes breakwaters and groynes that were built to protect the beach might end up intensifying the erosive drive as well as port structures. Erosion effects are also magnified by progressive sea level rise [4,5]. This factor has opened up relevant debates about the chance to either protect specific sectors of the coast or let the system free to evolve without anthropic interventions in accordance with the “managed retreat” concept [6]. While the former is more appropriate to sites where human settlements are well-established, the latter is increasingly applied to natural coastal areas. Managed retreat is not an option in densely populated countries, where low-lying beaches, often connected to large deltaic complexes, are subjected to multi-hazard threats determined by climatic change, whose most critical effect on coastlines is sea-level rise. As a matter of fact, worldwide many studies already addressed this issue, which might potentially become a serious social concern, analyzing the coastal vulnerability by means of ad hoc indices [7–9] or remote sensing techniques [10,11].
In the past decades, coastal erosion issues were often addressed with the realization of hard protection structures (e.g., groynes, breakwaters, seawalls) to counteract the erosion effect. The so-called “hard approach” [12] was not intended to solve, nor to reduce, the primary factors responsible for the erosion processes, but rather to fix an apparent equilibrium state of a specific sector of the coast by confining the sediments within the very same sector. While this approach may work locally despite the unpleasant visual impact of the structures that leads to a deterioration of the landscape, sometimes it does not take into full account the consequences on the adjacent sectors of the coast. The transmission of the erosion effects downdrift is a major shortcoming of these protection schemes, which basically need in-depth investigations prior to the construction and frequent monitoring afterwards. Based on the double-edged efficacy of this approach, projects requiring the utilization of hard structures potentially affecting local morphodynamics were preferably discarded and replaced by operations intended to artificially restore the suffering sectors of coast. Beach feeding activities, or replenishments, generally constitute the so-called “soft approach” [12]. As replenishments involve the input of additional sediment volumes into a starving system, often softer approaches are favorably accepted by decision-makers and the communities. Nonetheless, they are far from being considered the ultimate solution. As a matter of fact, beach feeding does not come cheap and needs frequent integrations because sediments would keep on being displaced according to the direction of the littoral drift; in addition, strong attention must be paid to textural and morphometric parameters of the filling sediments, as compatibility with the native sediments should be maintained as far as possible to extend the durability of the intervention and to avoid environmental issues; finally, they are still intended to fix a local problem rather than act on the primary causes.
Therefore, the concept that needs to permeate any layer, from the decision-makers to the stakeholders, from the private citizens to the scientists, is to start thinking of the coastal system at a larger scale, from the drainage basin to the sea along an imaginary cross-shore transect, and also in
terms of physiographic unit along the coast. A wise and effective coastal management depends on a strong and influential governance that might be able to cross the administrative limits, thus allowing for considering the erosion issue in terms of littoral cells and no more just locally.
The first step is to accept a paradigm shift: the evolution of the coastal environment is not just affected by the processes acting along the shoreline, but also on the drainage basin and along river courses. The transversal scale (the well-known “source-to-sink” approach) needs to be taken into full consideration because a paramount question still without a clear answer is how much sediment is delivered by rivers to the coast, and, as a consequence, how much of this sediment is further displaced offshore to a depth where no process is able to bring it back to the beach—two questions in need of urgent response because no evaluation of sediment budget can ever be made without quantitative answers to these burning questions. Nonetheless, the longitudinal scale must be addressed in terms of physiographic unit: too often, the beaches have been managed locally, without considering the consequences that these kinds of interventions may have on adjacent coastal sectors. A wise plan to counteract the erosion effects and to a further extent to manage the coastlines includes a proper redistribution of the sand, which must not depend on the administrative limits of municipalities. It is imperative that the redistribution of sediments from accreting areas to retreating areas via either by-passing or back-passing has to be managed without any interference due to city limits. In all this, the collaboration between any social layer should be particularly stressed: sharing knowledge and setting up actions involving universities, local governments, stakeholders, professionals, schools, and the communities as a whole must be the focal point to make conscious decisions in accordance with the precautionary approach and to efficiently counteract the erosion issue along any coast.
In this context, this paper presents a novel conceptual approach aimed at addressing the problem of coastal erosion within the scale and the framework described before. This approach is based on the concept of multidisciplinarity and holism, where different scientific fields, from earth sciences to marine sciences and engineering make available in a cooperative way their expertise as well as their techniques and technologies. Similarly, the concept of shared knowledge is presented, describing the information interchange between academics, administrations and citizens that can be established through the proposed Augmented Virtuality paradigm: the presented platform is open toward the inputs received by different actors but is at the same time a showcase, available and browsable by everyone, in a full bi-directional data exchange. In order to present such a complex ecosystem, the paper addresses the concept of multidisciplinarity as a whole, exploring the possible techniques and technologies to be integrated and focusing on the description of the conceptual architecture of the Augmented Virtuality platform.
This paper is structured as follows: Section2focuses on the importance of the holistic approach for coastal management, describing how cooperation between different disciplines is crucial for a 360-degree data acquisition on coastal phenomena. Sections3and4are devoted to the presentation of a base set of different techniques and instruments that are currently expected to be employed in data collection for the proposed platform: these include all the knowledge currently available in the working team. Additional techniques and instruments (for example Global Navigation Satellite System (GNSS) signal reflectometry, terrestrial Mobile Mapping, current and wave meters) have not been cited in the paper because, at the moment, they are not present among the skills of the working team, but are expected to be added in the next future according to the open and inclusive approach of the proposed solution. Regarding the description of the techniques, Section3is devoted to remote sensing techniques that are currently employed or expected to be used for remote data acquisition, while Section4focuses on in situ sensing techniques. Section5describes the proposed Augmented Virtuality visualization paradigm and the overall data acquisition and management architecture. Finally, Section6presents some concluding remarks.
2. A Holistic Approach for Coastal Management
The coastal environment is usually defined by the dunes, the beach and the nearshore. In that sense, the coastal system is just a tight strip, almost negligible relative to the width of other environments. Nonetheless, several processes acting on the coasts are strictly connected to the adjacent systems: as already pointed out, coastal erosion shows its effects along the shore, but many of its causes have to be looked for in river catchments. Likewise, the sediments that are entrained by the wave motion and distributed elsewhere by the currents might accumulate beyond the surf zone. Therefore, it is crucial for any study concerning the coastal system to take into account all the processes acting on the other environments because their effects also spread along the coast. This notion is not as common as it should be, mainly due to the complexity to deal with so many different factors coming from so many different settings and, very likely, in so many different timespans.
Similarly, coastal erosion is basically a geological process, being the result of complex interactions between coastal geomorphology and several hydrodynamic factors (e.g., waves, tides, surges). Nevertheless, a wide range of critical factors can be listed both as collateral causes and as possible mitigating solutions. For example, the chemical composition of seawater and its interaction with beach sediments, especially on artificial coarse-clastic beaches, may end up in corrosive processes that could eventually lead to a remarkable volume loss (preliminary laboratory tests performed on marble samples collected from artificial beaches along the Tuscany coast point out that mass loss due to sea water—sediment interaction is not negligible), while the presence of specific vegetation species may have a positive effect in slowing down the erosive process on dunes. This means that the cooperation between different scientific disciplines is crucial for a broader in-depth comprehension of the erosion phenomena: according to [13], a multidisciplinary approach would be then the perfect starting point to gain immediate benefits in terms of coastal management. Coastal morphodynamics, river supply processes, sedimentology, geomorphology, applied geology, hydrogeology, biology, coastal engineering, robotics, remote sensing, positioning and navigation are the most significant disciplines that contribute to this holistic approach: nevertheless, also knowledge coming from farther scientific sectors like economy, management or law may have a crucial role in tackling specific issues. The holistic approach is also paramount for the development and improvement of the techniques and technologies employed in the data collection, storage and elaboration activities. Each of the disciplines listed above contributes with its own methodologies to the creation of datasets that can be fused with the other ones to create a large amount of heterogeneous information. One of the main goals of the proposed framework is to provide each scientific field with innovative technological instruments coming from its joint work with experts coming from the Information and Communication Technologies (ICT) sector. In Sections3and4, a list of mature and innovative technological solutions, which can be applied for data collection in different scientific fields and from different points of view, is presented. These solutions allow for defining the coastal erosion phenomenon at different scales and with different approaches: each technique is then complementary to the others and concurs in defining a global overview of the morphological processes. Transversal to all the techniques is data acquisition and elaboration: each collected dataset can be either individually analyzed or fused with other datasets to obtain higher levels of abstraction. Complementary to the data acquisition process is the last brick of the proposed framework: data visualization. Information needs to be available to a wide range of users: not only scientists have to analyze the data, but also common citizens may be interested in consulting high level information. This means that knowledge in the field of interaction design and 3D imaging are also required for this final step.
The holistic approach for coastal management has already been discussed—for example in [14], but real implementations can be hardly found in marine monitoring systems. Some online coastal data navigation tools can be found in different parts of the world. Among them, it is possible to cite in the USA the Coastwide Reference Monitoring System (https://www.lacoast.gov/crms2/Home.aspx), that collects data regarding the wetlands in the state of Louisiana, and the Delaware Coastal Flood Monitoring System (http://coastal-flood.udel.edu), which provides information about flood risk in
the coastal areas of the state of Delaware. Outside the USA, it is possible to cite the Web portal of the UK Environment Agency (https://www.gov.uk/government/organisations/environment-agency), which provides datasets from different environmental domains, including coastal areas, and the Coastal Management Information System (CMIS—http://45.79.129.215/index.html) of the state of Karnataka, India, providing different interaction modalities. Anyway, all these systems are mainly Geographic Information Systems (GIS) with a very low level of interaction and a monodisciplinary approach. One interesting example is the European Multidisciplinary Seafloor and Water-column Observatory (EMSO) [15]: this European-scale infrastructure deals with the collection and analysis of heterogeneous marine data, with an approach similar to the one proposed in this paper, but in a larger scale. While this approach may be useful to manage large amount of data coming from an entire continent, the system presented in this paper has been envisioned to work at best within a definite sector of the coast, which usually should correspond to a physiographic unit. A physiographic unit is defined as a portion of a coast that has no sedimentary exchange with the adjacent sectors: sediment input only comes from river discharge or cliffs, and can only be lost offshore. In that regard, such system may represent the best option to process and interpret the data in order to provide useful suggestions to protect the coastal area and improve its management. Another interesting data management infrastructure is the Digital Coast platform, developed by the US National Oceanographic and Atmospheric Administration (NOAA) (https://coast.noaa.gov/digitalcoast/), which provides a wide range of tools to access a large quantity of heterogeneous data about seas and oceans. Nevertheless, this platform lacks a ready-to-use 3D navigation tool based on the Augmented Virtuality paradigm as the one proposed in this paper. This makes the platform very useful to scientists and experts but hardly usable by private citizens. Moreover, the Digital Coast platform lacks a crowdsourcing approach that may become crucial for the creation of large, participative datasets. Some solutions have focused on the multidisciplinary approach only in regards to the instrumentation [16] and the methodologies [17,18], without widening the scale of the monitoring infrastructure. As far as we know, such a comprehensive approach as the one proposed in this paper has never been discussed before.
3. Remote Data Acquisition
3.1. Proximal and Distal Remote Sensing
Since the 1970s, remote sensing techniques and products have been used to monitor the evolution of coastal zones. Today, remote sensing techniques represent inexpensive and fast methods to obtain a huge amount of data over wide areas and/or very specific information. Coastal studies can benefit from the use of very different sensors. Proximal and remote sensing can be used in combination in order to obtain data from different point of views. For example, the hyperspectral portable spectroradiometer, which operates at a distance of a few centimeters from the sample, has been used to retrieve information about grain size, mineralogical composition [19], surface moisture [20], and salinity [21] of coastal sediments from their spectral properties. The spectroradiometer measures reflectance in 3–10 nm bandwidths over the 350–2500 nm range. This sensor can be used both directly on the field or in laboratory under controlled conditions. Proximal sensors allow obtaining a huge amount of punctual information about physic-chemical information of the materials, which form the coastline (sand, silt, rocks). This information can be profitably used to produce thematic maps interpolating the obtained results. Considering other available ground based sensors, coastal studies can also benefit from the use of the Terrestrial Laser Scanner (TLS), which is able to produce a dense point cloud that can be used to build a 3D model of a selected area. This technique is particularly useful to monitor the stability of coastal cliffs or coastal structures (e.g., harbors, defense structures) affected by erosion [22] at the toe acquiring point clouds in different periods (e.g., before and after a storm or seasonally). In fact, this technique allows measuring ground 3D temporal displacements by comparing sequential datasets of the same scenario.
The monitoring of coastal cliffs and/or coastal slopes [23,24] can also be achieved using a Ground Based interferometer (GB-InSAR), which is a computer-controlled microwave transceiver equipped with a moving antenna capable of synthesizing a linear aperture along the azimuth direction. The system can acquire Synthetic Aperture Radar (SAR) image each around 1 min. The phase difference between images (interferogram) acquired in different moments are used to produce displacement maps. The GB-InSAR operates at a distance typically less than 3 km, thus it can be used to monitor the deformation of a relatively small area. This technique can also be used to monitor the deformation of man-made coastal structures. Moving far from the target, another useful technique is represented by the Digital Photogrammetry (DP) by means of Unmanned Aerial Vehicles (UAV). DP is a well-established technique for acquiring dense 3D geometric information from stereoscopic images acquired in sequence by a calibrated digital camera [25]. This technique can provide both very high resolution optical images (5 cm of spatial resolution) and high resolution Digital Elevation Models (0.05 m/pix) of a study area [26]. Multiple acquisitions over time can be used to monitor the morphological evolution of the area of interest over time.
The above-mentioned sensors and technologies need specific acquisition campaigns and allow acquiring information on relatively small areas. In order to carry out a complete study by means of a holistic approach, which includes not only a wide sector of coast but also the inland sector, we need for sensors to be able to cover very wide areas. Airborne and satellite remote sensing imagery can help to retrieve data over wider areas with respect to ground-based sensors. Optical and SAR sensors are commonly used to study and monitor the landscape evolution [25,27,28]. Optical imagery represents low cost and/or freely-available products extensively used to monitor the coastal environment [19,27,29–34]. Space-borne multispectral sensors (e.g., Landsat 8 and Sentinel-2) are considered powerful tools for the identification and mapping of coastal geomorphological features and changes. Despite their lower spatial resolution (e.g., 30 m for Landsat and 10 m for Sentinel-2), they can be profitably used instead of high-cost, Very High Resolution (VHR) airborne or commercial satellite imagery. The main advantage of multispectral imagery is given by the acquisition through different spectral bands of the electromagnetic spectrum and the capability to perform multi-temporal analysis. The former advantage is commonly used to map chemical and physical characteristics of sediments and rocks, to evaluate water turbidity [35,36], identify currents [19], and detect pollutants or algal bloom [37]. The multi-temporal analysis helps to measure major changes in coastline [38–40].
At the same time, SAR images can be used to obtain information on the coastal environment. SAR is an active sensor that uses microwaves which are based on the same technology of the GB-InSAR described above but mounted on satellite. Microwaves are transmitted from the sensor, backscattered from targets located at the ground and received again by the sensor. The received signal is then transformed into a grey-scale image. The main advantage of these kinds of sensors with respect to the optical ones is represented by the possibility to acquire images in all-weather conditions and also during the night. Today, the most important sensor is represented by the new mission Sentinel-1 composed by two satellites that acquire images each six days.
The single SAR image can be used to automatically extract the coastline, thus, by using a set of images acquired in different periods, it is possible to monitor the coastline evolution [41,42]. Each SAR image is composed of pixels characterized by a value of amplitude and phase. The latter can be used to measure ground displacement using at least two SAR images [43,44]. The multi-temporal interferometric techniques (MIT) are based on the analysis of a stack of coregistered SAR imagery [45] processed by means of different algorithms (e.g., Permanent Scatterers Interferometry, PSInSAR [46–48]). These techniques allow measuring the deformation of coherent radar targets (Permanent Scatterers, PS) along the Line of Sight (LOS) of the sensor, with millimetric accuracy and with respect to a stable point. MIT techniques can be applied from regional to local scale detecting ground deformation occurred during a specific time interval detecting coastal subsidence [28,49] and slope instability of high coasts [50]. The PSI technique can fail in the case of wide sandy beaches because of the high backscattering of the radar signal due to the terrain roughness. The problem can
be partially solved using the SqueeSAR technique [39], which allows the measurement of ground deformation by using point-wise coherent scatterers (PS) and partially coherent Distributed Scatterers (DS). Coastal subsidence can be detected not only along the coastline but also several kilometers inland, especially in the case of coastal plains where sediments compaction can provoke regional subsidence. Benchmarks or local permanent references are needed for an accurate georeferencing of point clouds obtained through both the TLS system and drone survey. Reference points are also useful for PSI analysis. Despite the limited number of measurable points that can be acquired in the same period with respect to PSI and TLS systems, Global Navigation Satellite System (GNSS) positioning (based on Network or traditional Real Time Kinematic) is the most accurate positioning technique [51]. In order to improve the spatial accuracy of the TLS, drone and PSI measurements, the GNSS positioning will be used to establish control points.
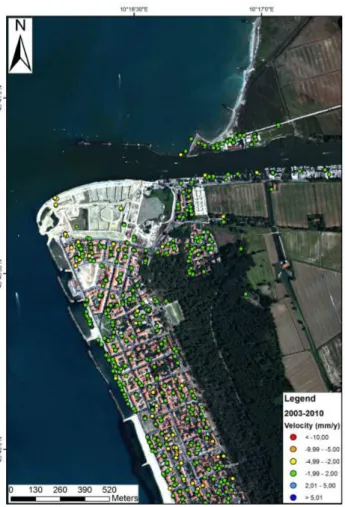
The aforementioned techniques can be fruitfully integrated to characterize the coastal environment and its evolution at different scales, from local to regional, and in time reconstructing changes of the coastal morphology and of the environmental characteristics (vegetation, pollution, turbidity, etc.). Results produced using proximal and distal remote sensing techniques will be represented by thematic maps as the one shown in Figure1(i.e., grain size, mineralogy, ground deformation, elevation) and maps of coastal evolution (i.e., change in the coastline, land cover changes). These maps will feed the Coastal Management (CosMan) system representing a sort of zero reference epoch at the beginning of the project and its temporal evolution over time.
Figure 1.Ground deformation velocity map obtained using Envisat Synthetic Aperture Radar (SAR) data (period 2003–2010) on a true color image in RGB mode (8,5,2) of the study area acquired using the airborne multispectral sensor Daedalus.
3.2. Underwater Remote Sensing Techniques
The possibility of exploiting advanced remote sensing technologies plays a fundamental role also for the collection of data from the submerged part of the coastal area. Information about the morphology of the sea bottom within the target area and about its modification during the time is precious to understand the dynamics of the analyzed coastal system. Underwater Robots, in particular Autonomous Underwater Vehicles (AUVs), represent the ideal tool to perform the necessary tasks of this activity limiting or totally avoiding the presence of human operators in the water, with immediate positive consequences in terms of safety.
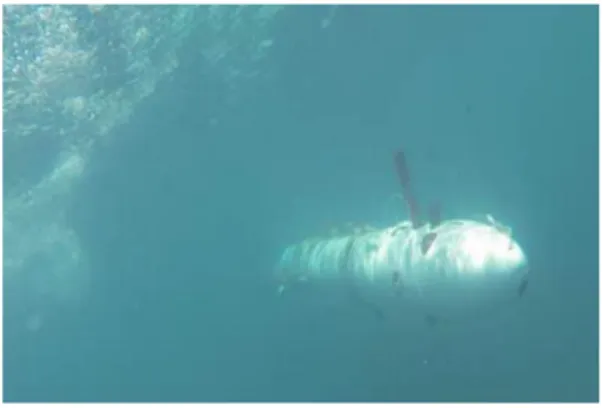
Different examples of bathymetric surveys carried out by means of commercial AUVs are reported in the literature, including several shallow water applications. They are based both on small size AUVs (e.g., REMUS 100 [52,53]) and large size ones (e.g., HUGIN in [54]). At the same time, AUV technology became mature and reliable enough in the last years to guarantee advantageous operational costs and associated mission time, turning to be the convenient choice for a wide range of different applications. AUV technology is then expected to be extensively and systematically employed for activities of sea bottom mapping and monitoring. DII (Department of Information Engineering) of the University of Pisa (UNIPI) collaborated in recent years in projects that, among their goals, had the development of AUVs. The main result in this sense is the outcome of the regional (Tuscany) project THESAURUS
(http://thesaurus.isti.cnr.it/): a dyad of 300 m rated AUV prototypes—respectively named TifOne
(Figure2) and TifTwo (Tifone class)—were produced, for underwater archaeology applications, in the framework of a collaboration between the University of Pisa and the Department of Industrial Engineering of the University of Florence (DIEF-UNIFI)—both of them ISME (http://www.isme.unige. it/) nodes. AUVs in general, and Tifone class AUVs in particular, are thought to be vector vehicles for the transportation on the target area of the desired payload sensors [55].
Figure 2.TifOne Autonomous Underwater Vehicle (AUV) performing a survey mission.
From the maneuverability point of view, AUVs like Tifone class ones can manage to navigate very close to the shore thanks to their redundant actuation along the different degrees of freedom.
AUVs are then expected to periodically cover the submerged area of the target coastal system with acoustic sensors suitable of providing a set of information including, according to the necessity, bathymetry, morphology or stratigraphy. Through the analysis of the data collected by means of the AUVs and their integration with all the information from all the different sensor systems adopted and described in this work, it will be possible to understand the local dynamics of volume shifts under nominal conditions and, potentially, as a consequence of extraordinary phenomena. Acoustic devices that could provide significant information about the dynamics of the coastal system and that could be integrated on AUVs as payload sensors are:
• Side Scan Sonar (SSS):this sensor allows for covering wide areas in a brief amount of time, the information that can be extracted from SSS data is a rough bathymetry in addition to the morphology of the sea bottom;
• Bathymetric Multi Beam EchoSounder (MBES):this sensor provides a detailed (measurements of the seabed elevation are determined with a down to centimeter resolution) representation of the sea bottom profile suitable for 3D reconstruction as e.g., Digital Elevation Model (DEM); • Sub Bottom Profiler (SBP):this sensor is a low frequency sonar that emits acoustic waves capable
of penetrating the sea bottom and of interpreting the echo coming from the first meters to discriminate the nature of the different stratigraphic layers.
All the named sensors are commercially available in versions suitable for their integration on a limited size vehicle (as e.g., AUVs). After their acquisition, payload data are integrated with the navigation state estimation for an absolute georeferencing: this is one of the most critical aspects of the processing chain. The resulting geographical position of the payload measurements are affected by an error that can be even up to few tens of meters according to the quality of the available sensor set for georeferencing. This is mainly due to the impossibility of using the GNSS when the vehicle is underwater. Alternative solutions have to be adopted. This problem is strongly studied within the scientific community and recently led to related reference surveys (e.g., [56,57]). A considerable effort in last years was dedicated by the authors to the problem of AUV localization and, consequently, payload data georeferencing, mainly working on two complementary lines:
• Estimation based on proprioceptive data:methods, mainly based on the Kalman filter approach, for the fusion of proprioceptive sensor (e.g., DVL—Doppler Velocity Log, AHRS—Attitude and Heading Reference Systems) signals and dynamic evolution knowledge, have been investigated and experimentally validated [58].
• Estimation aided by acoustic systems: strategies based on measurements of relative distance and/or direction of the AUV with respect to a set of a priori known or unknown acoustic nodes [59]. This includes also cooperative localization strategies based on relative measurements between different AUVs and on communication of synthetic navigation data [60].
Navigation systems exploiting both of the approaches could reach very low errors on the estimated position: down to few meters of error with respect to the GNSS signal assumed as ground truth [61]. 4. In Situ Sensing
In situ sensing techniques to be applied can be summarized based on three main categories: • RFID and tracking technologies,
• Wireless Sensor Networks, • Video Monitoring.
Nevertheless, possible additional technological assets are expected to be integrated in the next future.
4.1. RFID and Tracking Technologies
The tracking of sediments is of key importance to define coastal and fluvial dynamics. Different techniques have been studied in the last decades to study the movement of both sand [62,63] and pebbles [64,65]. While sand movements cannot be studied tracking every single grain, punctual tracing can be achieved on coarse-grained beaches. Regarding sand beaches, the most common tracing technique is based on the use of fluorescent tracers [66], while some cases exist where magnetic and radioactive tracers have been employed [67]. To our knowledge, no technique currently exists based on the use of real-time ICT solutions. A wider range of solutions exists for coarse-grained beaches. In this case, while the techniques listed for sand beaches have been employed, painted tracers have also been widely used. Moreover, some solutions also exploit Radio technologies [68].
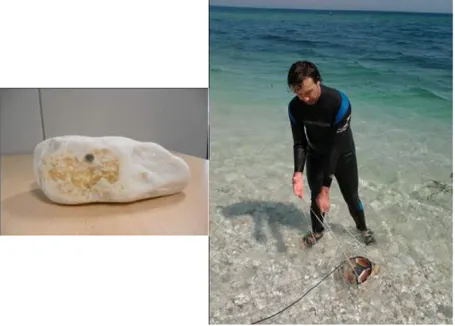
In this context, the CosMan framework is expected to integrate different tracing techniques, with a specific focus on a technique named “Smart Pebble” [69,70]. This technique is based on the use of Low Frequency RFID transponders embedded inside common pebbles collected directly on the beach under study. The pebbles are holed using a common drill, a transponder is glued on the bottom, and then the hole is sealed. Three different typologies of transponders can be used: 35 mm disc tags, 32 mm glass cylinders and 12 mm glass cylinders [71]: according to the different typology of transponders, pebbles of varying dimensions and shapes can be traced.
The tracing operations follow this procedure:
• The tagged pebble (the so-called Smart Pebble) is positioned on the beach in a specific position, according to a pre-defined scheme;
• Following the positioning, the exact position of the Smart Pebble is recorded by means of an Real Time Kinematic - Differential GPS (RTK-DGPS) instrument, whose horizontal and vertical accuracy is about 1 cm, and associated with the ID of the embedded transponder;
• After a pre-defined span of time, the Smart Pebble is localized and identified by reading the ID of the transponder through an ad hoc waterproof RFID reader that is employed as a sort of metal detector to perform a full scanning of the beach;
• The new position of the Smart Pebble is recorded;
• The Smart Pebble can be either left on site to go on with the tracking or recovered to perform morphometric analysis.
Such a technique allows the sediment tracking for both the emerged and the submerged portions of the beach: underwater pebbles are usually recovered in the nearshore at depths hardly over 2 m. The underwater operator can easily hold the pole of the instrument and record the position. Both the Smart Pebbles and the reader have been designed to be waterproof, and the operating frequency (125 kHz) allows a long range (up to 60 cm) underwater data transmission (a Smart Pebble and the reader can be seen in Figure3.). Different typologies of experiments can be set up: short term (6, 24 and 48 h) tracking experiments, long term tracking experiments (1, 2 months up to 1 year) and morphometric experiments where together with the position, also morphometric data about the pebble (weight, shape, roundness) are recorded. All the data collected by the Smart Pebble sub-system are made available to the CosMan platform as a collection of datasets: each dataset keeps the pebble ID and the x, y and t values identifying the position of the pebble at a specific time. Additional fields in the dataset are used for the morphometric data.
4.2. Wireless Sensor Networks
Wireless Sensor Networks (WSN) are widely employed for environmental monitoring: in [72] several solutions in different contexts are presented. WSNs have also been employed for the monitoring of coastal and marine environments [73,74]. Nevertheless, most of the applications focus on the analysis of water quality and are based on the use of floating devices. Several examples of Underwater Sensor Networks can also be found [75]. Indeed, only few solutions focus on the analysis of coastal dynamics.
In this framework, WSN are expected to be employed for several purposes, among them: • Analysis of coastal morphodynamics for sandy beaches;
• Analysis of bedload and suspended sediment transport; • Monitoring of marine weather and marine parameters; • Monitoring of water quality;
• Measurement of river sediment discharge into the sea.
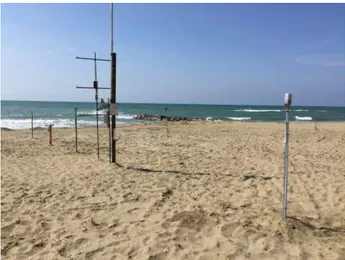
Regarding the CosMan ecosystem, three different WSN architectures are expected to be employed, according to the three different segments of the area under study: Beach WSNs, Marine WSNs and Fluvial WSNs. Regarding the Beach segment, WSNs are expected to be integrated in the CosMan architecture to analyze the beach morphodynamics [76]. The structures will integrate different kinds of Wireless Sensor Nodes, in charge of collecting different data typologies, which, if fused, allow for estimating remotely and in real time the sand transport in a sample portion of a beach. These Nodes include Sand Level Sensor Nodes in charge of measuring in real-time height variations of the sand level, in order to dynamically assess the morphological variations, Sand Collector Sensor Nodes in charge of measuring in real-time the amount of sand transported by the wind and thus to assess the dynamic behavior of the sand layer, and Environmental Sensor Nodes, collecting atmospheric data and thus allowing to correlate data about the transported sand, with information about winds and weather (see Figure4).
Figure 4.A deployed Beach Wireless Sensor Network (WSN).
The Marine WSNs are expected to be composed of a set of Sensor Nodes to be positioned in the near-shore portion of sea. Each Sensor Node is expected to include wavemeters and current meters as well as Sand Trap structures to analyze the seabed sediment transport. While the sensing devices are expected to be positioned close to the seabed, they will be linked to floating structures housing data acquisition, elaboration and transmission modules. These WSNs are also expected to integrate floating sensing vehicles in charge of analyzing water quality parameters, thus developing a network architecture composed by fixed and mobile Sensor Nodes.
The Fluvial WSNs aim at studying the sediment transport. In this case, the main issue is the calculation of the sediment transport, concerning both bed load and suspended sediments. The proposed
structures are expected to be employed for short spans of time (ranging from a few hours to some days) and will integrate two different typologies of Sensor Nodes: Suspended Sediment Sensor Nodes and Bed Load Sensor Nodes. Suspended Sediment Sensor Nodes are basically densimeters provided with network connection: these nodes are also expected to integrate Water Flow Sensors in order to calculate the effective hourly sediment transport rate. Bed Load Sensor Nodes are under study and will be based on a principle similar to the one applied to Sand Collector Sensor Nodes.
All these WSNs will be locally based on either ZigBee or LPWAN (LoRa) connection, according to the specific network requirements, and will rely on a Cloud infrastructure for remote data acquisition: this will allow the data post directly on the CosMan platform. Each dataset provided to the CosMan platform will be made available according to a standard data format including the collected numeric values, the position of the sensor node and a timestamp.
4.3. Video Monitoring
The use of video cameras for in situ coastal management has become a valuable system [77], in order to perform ship traffic and tourist flow control. Video cameras can also be used for monitoring the coastal evolution, from an in situ perspective, eventually integrated with other sensing systems dedicated to the same purpose. These systems often provide a “unified” type of data that can be processed to extract meaningful statistics related to the shoreline mutations. For example, time-exposure (or timex) images have been the primary output product of the Argus protocol: each image represents the mathematical time-mean of all acquired frames computed over a fixed interval of time. In these “pictures”, moving objects, as well as waves, are averaged so that is possible to visualize their fluctuations as bright pixels in the timex images. The peculiarity of time-exposure images is then the delineation of areas where wave breaking occurs as a white stripe. Similar to the mathematical time-mean representation, there is also the variance image, where pixels associated to moving objects have higher values in the image dynamic range.
4.3.1. Acquisition Systems
In the following, a short list of popular surveillance and monitoring system found in literature is presented (for range, resolution, frequency of acquisition and other features of these system, please refer to Table1):
• The Argus Video system ([A]—http://www.planetargus.com/). The Argus video system is the first system based on video acquisition for coastal monitoring and it is considered a standard. It has been especially implemented for the coastline change detection on a long-term basis exploiting timex images analysis [78,79].
The system typically consists of four to five cameras, with a total coverage of 180 degrees of HFOV (Horizontal Field Of View). The snapshot image, time exposure image and the variance image are usually collected every hour, with ten minutes of exposure time for the last two types of data. The accuracy of the measurements on the shoreline evolution has been assessed through comparison with DGPS (Differential Global Positioning System) results, leading to 0.35–2.4 m in cross-shore and 10–20 m in altimetry.
• The EVS Video system system ([B]—Erdman Video Systems—http://video-monitoring.com/). The EVS system is based on high resolution digital camera acquisition and a web-based fruition and manipulation of these resources: in fact, the built-in video server integrated in the system allows to access the camera parameters (pan/tilt/zoom) as well as the image database. An example (installation of Terracina) has been reported in Table1.
• The Beachkeeper video system ([C]—[80]). The image elaboration system of Beachkeeper is particularly valuable because it exploits the pre-installed webcams along the beaches, while it also consents to retrieve georeferenced and rectified images as well as the timex (mean and variance) images. Giving the variability of the composition of this system, it is hard to provide a general
performance reference because any assessment on the accuracy depends on the single sensor characteristics. An example (Pietra Ligure installation) is reported in Table1.
• The KOSTA Video system ([D]—www.kostasystem.com). KOSTA coastal video monitoring is based on a photogrammetric technique, which allows for transforming 2D image coordinates into the corresponding 3D real world coordinates [81]. This is an important feature because the 3D information provides a description of the acquired scene at a different level, introducing the possibility of performing metric measures on the data.Since 2006, three KOSTA systems have been installed (www.kostasystem.com): depending on the number of sensors, their resolution and their location, the monitored area and the quality of the video images are defined (see Table1). • The COSMOS System ([E]—[82]). The COSMOS system is based on the geometric correction of
the acquired images followed by the feature extraction (e.g., timex and variance images). Another important characteristic of this system is the fact that it is designed to work with any type of camera, providing to the final users a flexible platform in terms of installation constraints. Various sites, especially in Portugal, employ a COSMOS installation, for various purposes (coastline evolution, beach nourishment evolution, wave breaking patterns, etc.. In order to estimate the accuracy, comparison with 30 Ground Control Points (GCP) is reported.
From the above-mentioned systems [A], [B], [C], [D], [E], it results that few efforts in processing the beach data have been pushed, in terms of degree of automation and then rendering. The systems presented provide macro features of the monitored site (e.g., the automatically extracted shoreline) only in some cases, while in most cases the automatic processing they are equipped with is mainly applied for the geometric correction or for the orthorectification of the acquired data. The output visual rendering is therefore often made up of the orthorectified and georeferenced image, in order to provide the user with an overview of the monitored site. This type of output, however, has a spatial resolution that is not always optimal, varying with respect to the distance from the sensor. Moreover, if the shoreline was also provided (even superimposed on the orthorectified output), this is typically obtained from timex images, so that the temporal resolution of these systems is not very high. 4.3.2. Shoreline Change Detection for Coastal Monitoring
In general, the term “change detection” is used to refer to those automatic processing techniques that provide a map of changes in the monitored context as output. The implementation of change detection frameworks for image (or video) systems typically means that changes are to be found in the temporal sequence of the acquired data, that is, a set of images or a stream video. For the context regarding the monitoring of the evolution of the coast, therefore, we will look for the changes in time of the shoreline itself, which will be extracted from each image/video frame, such as the variation of the position with respect to a previous instant or a fixed baseline. Then, the changed pixels will compose the output map, retrieved with the same spatial and temporal resolution of the input data. Depending on the processing data domain chosen and the implemented algorithms, the change detection framework (considered for video based systems) could benefit from better spatial and temporal resolution, and then increasing the availability of data for macro indicators evaluations. Moreover, following the change detection methods applied in SAR remote sensing, some principles can also be applied to the video based systems employed for coastal monitoring [78,83].
As introduced above for the systems reported in literature, timestack analysis can be useful to represent the changes of coastal features in time, especially related to the shoreline. The difficulty in the analysis of the variability in time of this feature is the fact that, depending on the duration of the interval of observation (short or long term analysis), different and ambiguous results can be obtained. Therefore, the detection interval must be chosen properly, in order to both reject rapid oscillations of sea backwash and retrieve the instantaneous water level. This is the main reason why the video based systems in literature provide timex images, which natively filter out rapid variations in the scene. In this way, it is possible to correctly model the shoreline behavior through isodepths, as defined in [84], but it requires an appropriate sizing of the phases of acquisition of the system. Temporal series
of isodepths acquired during a tidal cycle allow to retrieve a three-dimensional representation of the beach. Timex images are also used to perform clustering on pixels in the HSV (Hue Saturation Value) domain to obtain the wet/dry segmentation and then retrieve the separating line, corresponding to the shoreline. In the last years, various techniques and composite systems of video acquisition have been employed in shoreline evolution monitoring. Terrain systems [85] are both costly and incapable of collecting data at the proper spatial and temporal resolution [86]. Alternative systems are more compact, easy to install and use fixed video imagery [87] in order to provide lower-cost continuous data at desired (spatial and temporal) resolution, but they can cover only limited areas of the beach [82]. To summarize, new video acquisition systems should be re-designed in order to improve both spatial and temporal resolution (possibly near real-time), while equipped with automatic shoreline change detection algorithms.
The recent advancements in hardware multi-processing and 3D stereo computer vision have triggered the diffusion of new Stereo devices for a range of applications. Stereo cameras acquire two overlapping images at the same instant, as the human vision system: this overlapping zone allows to measure the disparity between corresponding points in the two images. This disparity, computed in pixels, can be then rescaled in metric units to obtain the 3D map [88].
Stereo vision devices are advanced video systems, capable of recording frames as well as standard video cameras, but they continuously store (at least) two synchronized (in time) frames at each fixed instant of acquisition. The depth map, which provides 3D information on the scene, can be then obtained in real time, allowing for a constant monitoring rate. The resolution in time can be then highly improved, also allowing the application of 3D processing techniques in real time. From the depth map, the “point cloud” can be then computed, representing the formal 3D description of the objects in the scene [89]. Then, the key feature of stereo vision is that it can be used to locate an object in 3D space [90]. It can also give valuable information about that object (such as color, texture, and patterns that can be used by intelligent learning machines for classification).
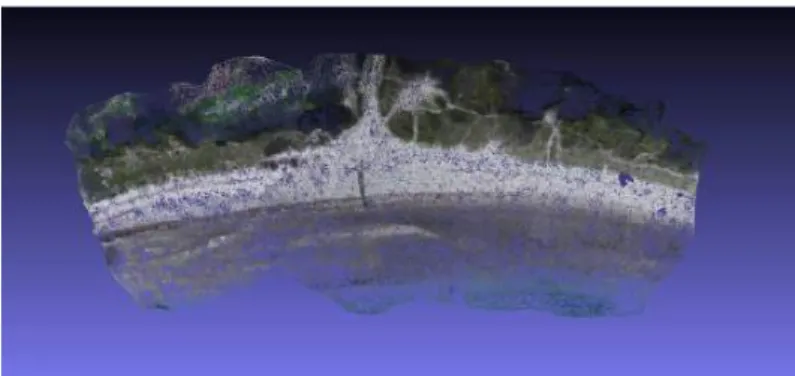
An example of point cloud is reported in Figure5. The acquisition system, as mentioned above, acquires two synchronized (in time) images and a stereo matching [90] is performed, in order to retrieve the affine transformation between the first and the second view. The stereo system is also previously calibrated “offline” with specific known targets (e.g., a chessboard or in general a target to be seen by the stereo couple with visible keypoints) to infer metric information into the stereo model function. After the stereo matching, the disparity image is obtained, which represents the displacement, expressed in pixels, of the second view from the first one. From the disparity map, the 2D point in the disparity image can be converted into 3D points through a triangulation formula.
Figure 5.Point cloud of a portion of beach obtained through the proposed video processing techniques. As reported in Table1, the CosMan video sub-system is designed to process a different type of data, the RGB stereo couple, instead of a single image/frame: this is crucial because the shoreline (and other macro-indicators) extraction can be performed directly in the 3D domain. In fact, each vision module of the CosMan system can provide the disparity/depth image. These data can be then processed to extract the desired synthetic features and confer them to the fusion level.
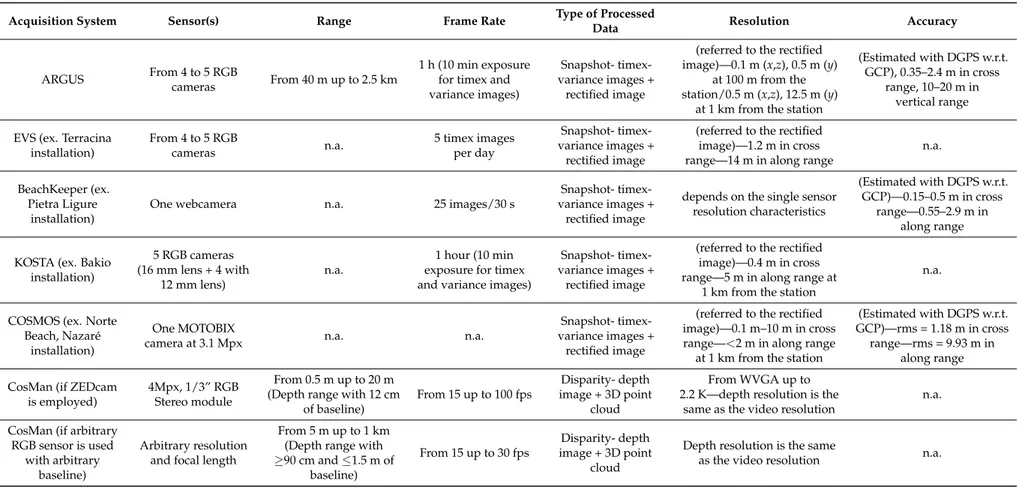
Table 1.Characteristics of the monitoring video systems. For each system, the following description is reported: (a) sensors employed (type and number, where available); (b) range (with respect to the sensor location); (c) frame rate of the system; (d) type of provided (processed) data; (e) resolution (referred to the sensor itself or other, if specified); (f) accuracy.
Acquisition System Sensor(s) Range Frame Rate Type of Processed
Data Resolution Accuracy
ARGUS From 4 to 5 RGB
cameras From 40 m up to 2.5 km
1 h (10 min exposure for timex and variance images)
Snapshot- timex-variance images +
rectified image
(referred to the rectified image)—0.1 m (x,z), 0.5 m (y)
at 100 m from the station/0.5 m (x,z), 12.5 m (y)
at 1 km from the station
(Estimated with DGPS w.r.t. GCP), 0.35–2.4 m in cross
range, 10–20 m in vertical range EVS (ex. Terracina
installation) From 4 to 5 RGB cameras n.a. 5 timex images per day Snapshot- timex-variance images + rectified image
(referred to the rectified image)—1.2 m in cross range—14 m in along range
n.a.
BeachKeeper (ex. Pietra Ligure
installation)
One webcamera n.a. 25 images/30 s
Snapshot- timex-variance images +
rectified image
depends on the single sensor resolution characteristics
(Estimated with DGPS w.r.t. GCP)—0.15–0.5 m in cross
range—0.55–2.9 m in along range KOSTA (ex. Bakio
installation) 5 RGB cameras (16 mm lens + 4 with 12 mm lens) n.a. 1 hour (10 min exposure for timex and variance images)
Snapshot- timex-variance images +
rectified image
(referred to the rectified image)—0.4 m in cross range—5 m in along range at
1 km from the station
n.a.
COSMOS (ex. Norte Beach, Nazaré
installation)
One MOTOBIX
camera at 3.1 Mpx n.a. n.a.
Snapshot- timex-variance images +
rectified image
(referred to the rectified image)—0.1 m–10 m in cross range—<2 m in along range at 1 km from the station
(Estimated with DGPS w.r.t. GCP)—rms = 1.18 m in cross
range—rms = 9.93 m in along range CosMan (if ZEDcam
is employed)
4Mpx, 1/3” RGB Stereo module
From 0.5 m up to 20 m (Depth range with 12 cm
of baseline) From 15 up to 100 fps Disparity- depth image + 3D point cloud From WVGA up to 2.2 K—depth resolution is the
same as the video resolution
n.a. CosMan (if arbitrary
RGB sensor is used with arbitrary
baseline)
Arbitrary resolution and focal length
From 5 m up to 1 km (Depth range with ≥90 cm and ≤1.5 m of baseline) From 15 up to 30 fps Disparity- depth image + 3D point cloud
Depth resolution is the same
as the video resolution n.a.
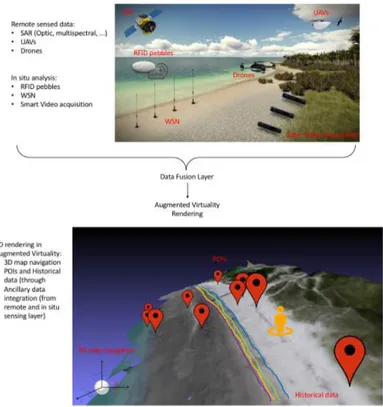
5. Data Fusion and Augmented Virtuality
5.1. Overall System Architecture
The implementation of a Coastal Management (CosMan) system through data acquisition and fusion, as well as Augmented Virtuality representation, requires a tailored ICT (Information Communication Technology) system architecture able to integrate a number of heterogeneous functionalities and technologies. Major features of the system can be summarized in the following macro-requirements:
• Ability to manage (feed (in), storing, elaboration, distribution to users and/or other systems (out) ) of heterogeneous data with high flexibility and interoperability with different systems and technologies;
• Management of data with georeferenced and time-referenced features;
• Advanced capability of data elaboration, fusion, 3D, as well as modularity of the software design in order to effectively re-use software components (i.e., I/O interface, elaboration) across specific data items, from existing libraries and effectively compose them together for fusion and related time/space elaborations.
In particular, there is profound variability in the interesting data feeds of this domain: for example in their intrinsic nature and software format, in the way they are (a) physically collected from the field (e.g., automatically, semi-supervised, supervised); (b) transmitted to the management system (e.g., directly and immediately through a telecommunication link, directly but when a link is, or is made, available). Other facets of each data feed are their timing and geo-localization, as well as the possible frequency in their sampling, when their collection and transmission can be automated. Table2exemplifies some data that we have considered as a reference for designing a flexible software architecture able to comply with their variability and with the need to analyze, fuse and elaborate them for the overall objectives of this project.
Undoubtedly, such data expose a high degree of variability and we have verified that a system able to cope with these is able to potentially manage, with zero or minimal adaptations, a wide range of other data that are typically collected on the field.
Lastly, a number of auxiliary data feeds are envisioned in this project and they do not necessarily aim to directly measure some physical properties of the coastal entities, or their evolution over time. We planned to provide some input channels to informal, and also social, data collection fluxes directly contributed by citizens to enrich the coastal status monitoring over time. Dually, some specific Augmented Virtuality views and services can be made public also to encourage the use of end-user applications and promote feeds of data through them. For example, registered people will be entitled to upload photos, comments or other environmental information (e.g., light, ambient pressure, noise) through their personal devices—smartphones and tablets and mediated by the apps developed for this platform. On top of this, also crowd positioning and movement information will be collected for seasonal, daily and even real-time insight. This support of social is very useful for two main reasons. First, the correlation between human activities (e.g., bathing facilities and related seasonal phenomena) and the coastal data evolution can be analyzed and cross-referenced with the other instrumental data for enriched insight. Secondly, a number of ancillary services to people could be enabled, and fed, by this heterogeneous and multi-layered platform; for instance, sand granulometry, weather and storm-related variations in the coastal profile collected by meteo stations, seasonal/weekly/daily crowd presence information could constitute the raw data on top of which tourism guidance applications could be built.
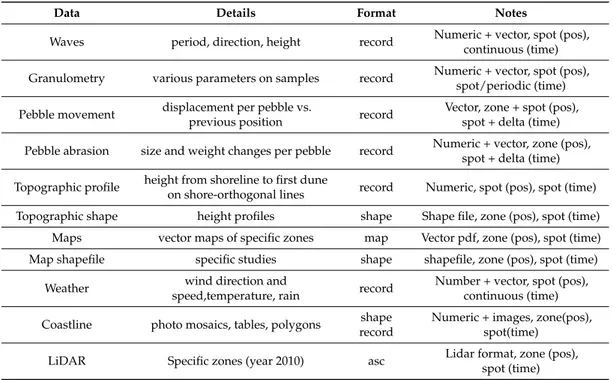
Table 2. Example of some of the coastal data to be managed in the designed Coastal Management system. A concise description of each data is given, along with its electronic format, nature of the data (e.g., numeric, vector) and spatio-temporal features.
Data Details Format Notes
Waves period, direction, height record Numeric + vector, spot (pos), continuous (time) Granulometry various parameters on samples record Numeric + vector, spot (pos),
spot/periodic (time) Pebble movement displacement per pebble vs.
previous position record
Vector, zone + spot (pos), spot + delta (time) Pebble abrasion size and weight changes per pebble record Numeric + vector, zone (pos),
spot + delta (time) Topographic profile height from shoreline to first dune
on shore-orthogonal lines record Numeric, spot (pos), spot (time) Topographic shape height profiles shape Shape file, zone (pos), spot (time)
Maps vector maps of specific zones map Vector pdf, zone (pos), spot (time) Map shapefile specific studies shape shapefile, zone (pos), spot (time)
Weather wind direction and
speed,temperature, rain record
Number + vector, spot (pos), continuous (time) Coastline photo mosaics, tables, polygons shape
record
Numeric + images, zone(pos), spot(time)
LiDAR Specific zones (year 2010) asc Lidar format, zone (pos), spot (time)
All the considered data are, directly or indirectly, georeferenced. Some data have spot positional attributes (e.g., wind direction in a certain measurement station) while other have zone positional information (e.g., maps or shapefiles relative to specific areas). Data are time-referenced too and typically they have a spot timing attribute, a time-stamp. Some data are collected in a way that makes them a continuous series of samples, usually periodic and relatively fast (minutes, hours). In these cases, data collection is typically automatic. At the opposite of the spectrum, some data are the result of manual measurements campaigns (e.g., pebble displacement/abrasion estimation) performed episodically, sometimes with a slow periodicity (days, weeks, months) or at random moments in time.
In order to cope with georeferenced and timestamped data, and with specific data formats, in an efficient and standard way, we chose to integrate a GIS (Geographical Information System) software into the overall CosMan system. Furthermore, in this way, the overall system can rely on existing, well-known, GIS functionalities without needing to re-implement them. The only concern adopting this approach is the compatibility, integrability and programmability of the GIS software module within the enterprise infrastructure of the overall CosMan system. In fact, our elaboration engine requires to seamlessly use and interact with the encompassed GIS software for implementing ad hoc algorithms.
The requirement of advanced programmability of our CosMan system derives from its complex requirements, which goes far beyond the mandatory collection and sharing of heterogeneous coastal data, which is complex in itself. On top of that, data elaboration, fusion, filtering, investigation, analytics as well as 3D elaboration and Augmented Virtuality implementation, will constitute crucial non-trivial macro-features of the overall system. Therefore, the core engine of our CosMan system needs to be programmable in languages and ecosystems that support modular development for reuse and productivity, powerful abstraction mechanisms, rich set of third party libraries, compatibility with existing code-bases and scalability in the deployment and management.
5.1.1. System Architecture
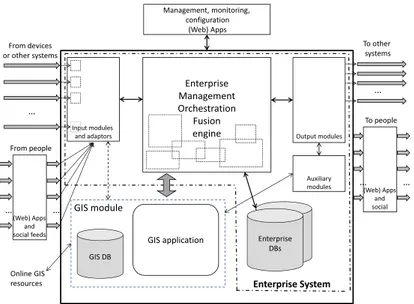
Based on the requirements and features analyzed in the previous sub-section, we have defined the reference architecture of the CosMan system, which is summarized in Figure6.
Input modules and adaptors Output modules Auxiliary modules Enterprise Management Orchestration Fusion engine Enterprise DBs GIS DB GIS application GIS module … From devices or other systems (Web) Apps and social feeds … From people … Enterprise System … To other systems (Web) Apps and social … To people … Management, monitoring, configuration (Web) Apps Online GIS resources
Figure 6. Overall architecture of the proposed Coastal Management System (CosMan) platform, highlighting the major modules and their relationships.
5.1.2. Black-Box
Specifically, from a black-box perspective, the CosMan system interfaces with three classes of users, which are defined by the kind of exchanged data: devices for data collection (input) and elaborated data consumption (output), people for informal data feed (input) and usage of the exposed services for professionals and citizens (output), and lastly towards the administrators of the system itself. First of all, the left side of the figure shows the input data fluxes. In the top-left, data from devices are indicated, for instance from measurement stations on the field or from workstations on which data were elaborated before the feeding to our system. Data are transferred towards specific webservices exposed by the CosMan system. Each data has its own webservice module, id (e.g., RESTful [91] URI (Uniform Resource Identifier) id) and available operations for data transfer and encoding. Webservices are the current most compatible, platform-agnostic interfacing between distributed interoperable systems in the web and are at the foundation of almost the totality of services that we consume nowadays in our online life [92]. Therefore, to promote flexibility and composability of our system with existing services and platforms, webservice interfacing is the most suitable choice. If we will need to support some latency-critical, real-time, streaming data fluxes for some data that we will need to manage in the future, we will probably adopt websocket technology (www.websocket.org), which is now standard within HTML5 specification, supported by almost every client platform and by our enterprise framework.
On the left-bottom side of Figure6, the input channel from specific apps and/or web apps is shown. It relies on the same and, most of all, additional webservices to support the specific data coming from user applications (e.g., pictures, comments) and the corresponding interaction protocols. The opposite left side of the diagram shows the output links of the CosMan system. Similarly to the input side, we have provided both channels towards other devices/systems (top-right) and apps directly used by people (professional and citizens). In both cases, again, webservices are the first choice technology to support the output interaction for compatibility and generality in the Web 2.0 framework [93–95]. Webservices exposed to other devices allow to seamlessly insert the CosMan system within more articulated software architectures and exploit its offered services in a composable and modular way
(Software as a Service approach or SaaS [94,96]). Therefore, the universal webservice language allows also an easy interfacing towards client applications, both native (apps) and web-based (web-apps), and third-party applications. On the top side of the diagram, the figure shows the input–output links from/to the management client applications, which allow for monitoring, managing, administering and configuring all the behaviors of the system. In addition, these links are now supported by webservices, but we also do not exclude the future support of proprietary software interconnections to address possible specific interactivity issues.
Data quality issues are managed as described in the following. First of all, social data feeds are treated as low-quality data and kept separated from the others provided by scientific-grade devices and sensors. Then, data that need manual intervention for the collection and/or insertion into the system (e.g., coarse sediment abrasion rate) are managed by client-side web-apps that allow the easy input and possible pre-filtering/pre-elaboration before acquisition into CosMan. Some data that are automatically collected but need human validation before usage and visualization (e.g., in a sensor network with possible anomalous spikes) are stored in a “pending” status and thus prevented from usage in data fusion and visualization. Data can then be validated by a human intervention and promoted to “valid” state. Finally, there are data that are collected and used automatically (e.g., from weather stations). Communication robustness in terms of delivery reliability and integrity are orthogonal to the described functionalities and are solved through well-known low-level mechanisms (e.g., buffering, sequencing, hashing).
5.1.3. White-Box
The internal of the system (white-box) exposes the macro sub-division in a GIS software (e.g., QGIS in our current prototype,www.qgis.org) and the Enterprise System, a Java Enterprise application [97]. QGIS, as other GIS softwares, can manage a huge number of georeferenced data and support a wide range of elaboration procedures on them, natively and as plugins. QGIS has Python and C++ APIs (Application Programming Interface) available, which allow for directly interacting with it from other programs in a very flexible and efficient fashion in order to extend its capabilities and exploit its functionalities. Our Java enterprise engine can directly communicate with QGIS through offloaded Python scripting as well as Java Native Interface (JNI) [98] technology towards C++ interface classes, which can exploit GIS internal API and services. Furthermore, QGIS can take advantage from auxiliary modules like MapServer (mapserver.org), indicated in the right-bottom of Figure6, to ease the publishing of spatial data and interactive mapping applications to the web.
Java Enterprise edition technologies [97] allow for supporting a rich, flexible and modular programming model and scalable deployment possibilities through application servers and, possibly, also towards cloud resources. Modularity and scalability are pursued both at application-level and at deployment-level so that the system is ready to scale in terms of (a) number and kind of data/visualizations to be managed (application scalability); and (b) number and kind of hardware resources that are needed to support the computational and storage requirements over time (deployment scalability).
JAX-RS [99] library allows for supporting restful webservices effectively, being able to easily implement hierarchies of classes and data structures as to reuse and compose code for the different data feeds (input) and offered services (output). JAXB [100] library then allows to manage data format serialization towards JSON (JavaScript Object Notation), XML as well as binary encoding compatible with webservices in a standard way, where possible, and can be extended for very peculiar data, if needed. Therefore, data I/O towards/from the system flows through webservice interfaces that are very general and able to support both structured data (e.g., values, records of values, sequences of records, etc) directly through JSON encoding as well as binary data through base64 preliminary encoding. We have verified that this is enough for our reference data. The Object-Relationship-Mapping (ORM) capabilities of the Java Enterprise platform allow easy interfacing with data storages, both relational and non-relational, through entity classes and objects. This choice promotes flexibility