UPDATING TECHNICAL COEFFICIENTS OF AN INPUT-OUTPUT
MATRIX WITH RAS – THE trIOBAL SOFTWARE
A VBA/GAMS APPLICATION TO ITALIAN ECONOMY FOR YEARS 1995 AND 2000
MARCO RAO, M.C. TOMMASINO ENEA – Unità Centrale Studi e Strategie
Sede Centrale, Roma
AGENZIA NAZIONALE PER LE NUOVE TECNOLOGIE, LʼENERGIA E LO SVILUPPO ECONOMICO SOSTENIBILE
UPDATING TECHNICAL COEFFICIENTS OF AN INPUT-OUTPUT
MATRIX WITH RAS – THE
trIOBAL SOFTWARE
A VBA/GAMS APPLICATION TO ITALIAN ECONOMY FOR YEARS 1995 AND 2000
MARCO RAO, M.C. TOMMASINO ENEA – Unità Centrale Studi e Strategie
Sede Centrale, Roma
I contenuti tecnico-scientifici dei rapporti tecnici dell'ENEA rispecchiano l'opinione degli autori e non necessariamente quella dell'Agenzia.
The technical and scientific contents of these reports express the opinion of the authors but not necessarily the opinion of ENEA.
I Rapporti tecnici sono scaricabili in formato pdf dal sito web ENEA alla pagina http://www.enea.it/it/produzione-scientifica/rapporti-tecnici
UPDATING TECHNICAL COEFFICIENTS OF AN INPUT-OUTPUT MATRIX WITH RAS – THE trIOBAL SOFTWARE
A VBA/GAMS APPLICATION TO ITALIAN ECONOMY FOR YEARS 1995 and 2000
MARCO RAO, MARIA CRISTINA TOMMASINO
Riassunto
Questo rapporto presenta un’applicazione sviluppata in Excel Visual Basic for Applications (VBA) congiuntamente ad una routine GAMS (General Algebraic Modeling System) finalizzata ad utilizzare il metodo RAS per l’aggiornamento dei coefficienti tecnici di una matrice Input-Output da un anno base ad un anno di previsione. Il metodo RAS standard è finalizzato al bilanciamento di una matrice Input-Output presumendo noti i totali di riga e colonna dei consumi intermedi e il valore della produzione per l’anno di previsione. I dati utilizzati sono relativi al sistema delle tavole Input-Output italiano per gli anni 1995 e 2000 (ISTAT, 2014). Tale applicazione costituisce un utile strumento anche per il bilanciamento di Matrici di Contabilità Sociale (SAM).
Parole chiave: Metodo RAS, tavole Input-Output, Excel Visual Basic, GAMS.
Abstract
This paper deals with a new application, namely trIOBAL, developed in Excel Visual Basic for Applications (VBA) together with a GAMS (General Algebraic Modeling System) routine to implement the RAS method finalized to update the technical coefficients of an Input-Output matrix. We follow the RAS standard procedure, that requires knowing the production vector and the row and column totals of the intersectoral tables at the forecast year. The data come from the Italian Input-Output Tables for the years 1995 and 2000 (ISTAT, 2014). This new application could be easily applied also to the Social Account Matrix (SAM).
Summary
1. Introduction ... 7
2. The Input – Output table ... 8
2.2 The structure of an intersectoral table ... 8
3. The Social Accounting Matrix ... 10
4. Updating an Input-Output table: the RAS approach ... 13
4.1 An intuitive representation of RAS method ... 17
5. An application to Italian economy for years 1995 and 2000 ... 20
5.1 Results ... 24
6. Conclusions ... 27
7
1. Introduction
“For many researchers around the world, the applications of the RAS method can say in both easy way and difficult way. In our study, we would like to bring to readers the RAS method, and in the best way to understand in balancing the Supply-Use tables or Input-Output tables in the usual procedure. This work becomes easier if there is an effective
software to do it automatically for all the balancing necessary steps in the usual way (B.
Trinh, 2013).”
In line with the suggestions reported in the previous citation a new Visual Basic /GAMS program, namely trIOBAL, is here presented, specifically developed to easily update the technical coefficients of an input output matrix using the conventional RAS method.
The second section deals with the national accounts system1 and the Leontief Input-Output
model in order to introduce the readers in the theoretical reference context. In a simple and synthetic way we discuss about the nature and the utility of this macroeconomic tools in representing the structure of a country economy in a given moment.
The following section presents the, Social Accounting Matrix (SAM) an evolution of the Input-Output table developed by the “Cambridge Group Project” in Cambridge, UK (Stone and Brown 1962).
Having highlighted the importance of Input-Output tables in reporting and analyzing the industrial structure of an economy, a formal description of the RAS method developed for balancing an Input-Output matrix is introduced in section 4.
The trIOBAL routine is described in section 5 outlining the case study, and providing some indication to evaluate the results obtained.
The final section presents the conclusion and suggestions for further research.
1 The System of National Accounts is a statistical framework that provides a comprehensive, consistent and
flexible set of macroeconomic accounts for policymaking, analysis and research purposes” (U.N, Bank, IMF, Commission, & OECD, 2009).
8
2. The Input – Output table
The System of National Accounts, is relevant to represent a given economy and to define the inter-linkages between sectors. This conceptual approach date from Quesnay and Walras and owes its formal accommodation to Leontief (Leontief, 1936).
In its very basic form, an Input–Output model is a system of linear equations, each one of which describes the distribution of a sector’s product throughout the economy. In the scheme of so-called Input-Output matrix, the sectors are conventionally represented allocating the value added composition by column input and the sales by row (Miller & Blair, 2009).
To introduce the reader to the basic concepts required, we propose an elementary explanation of the nature and mechanics of an input output table.
2.2 The structure of an intersectoral table
An Input–Output model is constructed from observed data for a particular economic area – a nation or a region. The economic activity in the area must be able to be separated into a number of segments or producing sectors.
Let’s suppose that in our simple model exist only three economic sectors: Agriculture (which produces and sells wheat and consumes cloth and job), Industry (which produces and sells cloth and consumes wheat and jobs), Households (that sells jobs and consumes wheat and cloth).
It's important to make the distinction between intermediate consumption and final
consumption: those necessary for production are defined intermediate consumptions2, the
others are final (e.g. households that consume wheat).
This simple economic system can be represented by a flows matrix. Rows report what each branch sells to all other branches (including herself); columns report what it buys from other branches
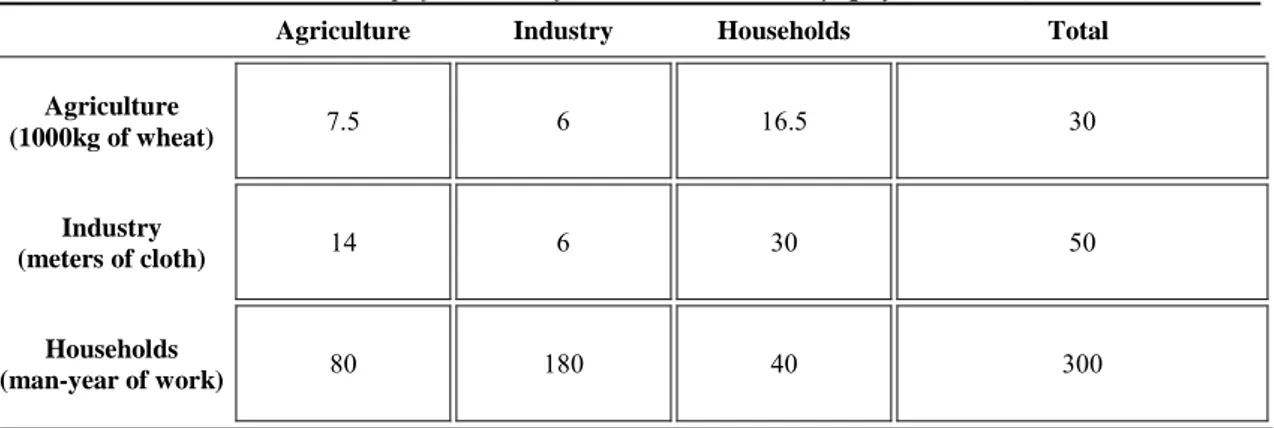
Table 1. Intersectoral table - Simplified model for a 3-sector economy (physical units).
Agriculture Industry Households Total
Agriculture (1000kg of wheat) 7.5 6 16.5 30 Industry (meters of cloth) 14 6 30 50 Households (man-year of work) 80 180 40 300
• Agriculture produces 30000 kg of wheat, of which 7.5 consumed by it (e.g. seeds), 6 by Industry and 16.5 by Households (wheat, meat, fruit, etc.).
9 • Industry produces 50 meters of cloth, of which 14 are consumed by Agriculture, 6 by itself, and 30 by families;
• Households provide a total of 300 man-years: 80 to Agriculture (farmers), 180 to Industry (workers) and 40 to themselves (Housework).
• Agriculture employs 7500 kg of wheat, 14 meters of cloth - and 80 man-years to produce 30000 kg of wheat:
• Industry employs 6000 kg of wheat, 6 meters of cloth and 180 man-years to produce 50 meters of cloth;
• Households spend their income from employment (equivalent to 300 man-years of work) to buy 16500 kg of wheat, 30 meters of cloth and 40 man-years of work. Why there are no column totals? For the reason that the values measured by column are physically inhomogeneous (kg of wheat, yards of fabric, man-years of work).
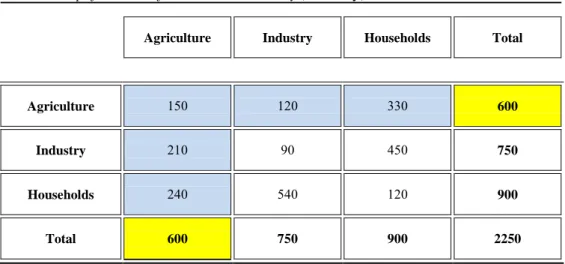
Then, there must exist a price system that ensures the effective possibility of trade between the different sectors (as well as the aggregation and comparison between the sum of rows and columns) in the case of Table 1 say that prices are: 20 euro per 1000 kg of wheat,
15 euro per one meter of cloth, 3 euro for a man-year of work.
Now you can get the following table, multiplying the quantities of Table 1 for the selected prices.
Finally, we get the following table:
Table 2. Simplified model for a 3-sector economy (currency).
Agriculture Industry Households Total
Agriculture 150 120 330 600
Industry 210 90 450 750
Households 240 540 120 900
10 The mathematics of an input-output matrix is straightforward, but the data requirements are massive since the expenditures and revenues of each branch of economic have to be represented.
Nevertheless the Input-Output methodology is an useful tool for assessing economic impacts of policies and for investigating production relations among primary factors, intersectoral flows, final demands, and transfers.
3. The Social Accounting Matrix
“Economics accounting is based on a fundamental principle of economics: for every income or receipt there is a corresponding expenditure or outlay. This principle underlies the double-entry accounting procedures that make up the macroeconomic accounts of any country. A SAM is a form of single-entry accounting. SAMs also embody the fundamental principle, but they record transactions between accounts in a square tableau or matrix
format (U.N., 1968).”
The Social Accounting Matrix (SAM) is a matrix that compiles all the monetary flows among agents and sectors from a particular economy. It is a systematic method of representing the flows of goods/services and factors and the corresponding payments in an economic system (Stone & Brown, 1962).
With a social accounting matrix we can perform other type of investigations not allowed using the I-O tables. (Miller & Blair, Foundations of Input - Output Analysis, 2009).
SAM's were originally developed at the “Cambridge Growth Project” in Cambridge, UK, which developed the first SAM in 1962 were built as a matrix representation of the National Account, and came to the World Bank with Graham Pyatt in the 1960s (Pyatt had worked for Richard Stone at the Cambridge Growth Project). Pyatt left Cambridge and “developed SAMs, mainly at the World Bank”, becoming together with Erik Thorbecke, the leading proponents and developers of SAMs. "By the early 1980s, CGE models were heavily ensconced as the approach of the World Bank for development analysis. Social Accounting Matrices (SAMs) were similarly a mainstay of Bank analysis, which had been
adopted as a presentational device by the CGE modelers" (Mitra-Kahn, 2008).
SAM is a square matrix of data (columns equal rows) in the sense that all agents (agents typically include industries, factor of production (e.g. labor and capital), household
consumers, the government and the rest-of-the-world region3) are both buyers and sellers.
Every economic agent in the economy has both a column account ad a row account. Columns represent buyers (expenditures) and rows represent sellers (receipts).
SAMs were created to identify all monetary flows from sources to recipients, within a disaggregated national account. The SAM is read from column to row, so each entry in the matrix comes from its column heading, going to the row heading. Finally columns and rows are added up, to ensure accounting consistency, and each column is added up to equal each corresponding row.
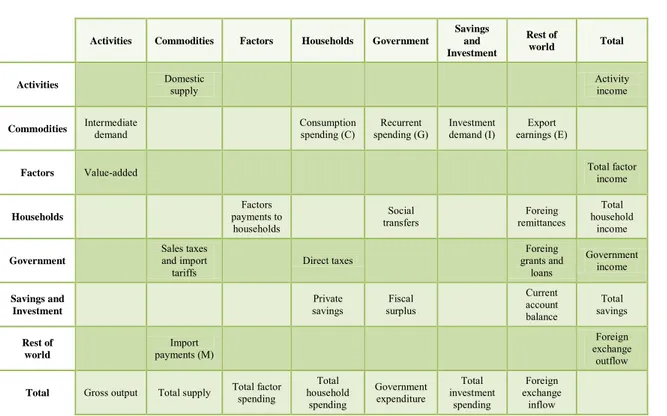
11 As shown in the following Table 3, in the SAM each cell represents a flow of funds from a source (column) to a recipient (row). It includes information from most transactions, such as the wages firms pay to households, household’s consumption of goods, and taxes and transfers administrated by the Government.
Table 3. SAM for Open Economy:
Activities Commodities Factors Households Government
Savings and Investment
Rest of
world Total
Activities Domestic supply Activity income
Commodities Intermediate demand Consumption spending (C) spending (G) Recurrent Investment demand (I) earnings (E) Export
Factors Value-added Total factor
income Households Factors payments to households Social
transfers remittances Foreing
Total household income Government Sales taxes and import
tariffs Direct taxes
Foreing grants and loans Government income Savings and Investment Private
savings surplus Fiscal
Current account balance Total savings Rest of world Import payments (M) Foreign exchange outflow
Total Gross output Total supply Total factor
spending Total household spending Government expenditure Total investment spending Foreign exchange inflow
Now let’s look to a simple example to highlights the differences between I-O and SAM accounts representation framework. (Miller & Blair, Foundations of Input - Output Analysis, 2009)
Table 4.
Input – Output representation
Nat. Res. Manuf. Services Households Total Output
Natural Resources 50 30 0 60 140 Manufacturing 60 40 40 40 180 Services 0 0 0 100 100 Value Added Labor 10 70 10 Capital 20 40 50 Total Inputs 140 180 100
12
Table 5.
SAM Framework Example Using Social Accounting Conventions Expenditures
Nat. Res. Manuf. Services Labor Capital Households Total Output Income Natural Resources 50 30 0 60 140 Manufacturing 60 40 40 40 180 Services 0 0 0 100 100 Value Added Labor 10 70 10 Capital 20 40 50 Households 90 110 Total Inputs 140 180 100 90 110 200
Source: Miller and Blair 2009.
In the SAM framework, we consider a much more detailed picture of the economy including not only the input–output table of inter-industry income and output, but also the institutional income and expenditures associated with final demand and value added sectors. The SAM framework also provides essentially a complete accounting of the circular flow of income and expenditure in an economy.
SAMs can be easily extended to include other flows in the economy, simply by adding more columns and rows, once the Standard National Account (SNA) flows have been set up. Often rows for ‘capital’ and ‘labour’ are included, and the economy can be disaggregated into any number of sectors. Each extra disaggregated source of funds must have an equal and opposite recipient. So the SAM simplifies the design of the economy being modelled.
SAMs are currently in widespread use, and many statistical bureaus, particularly in OECD countries, create both a national account and this matrix counterpart. A theoretical SAM always balances, but empirically estimated SAM’s never do in the first collation. This is due to the problem of converting national accounting data into money flows and the introduction of non-SNA data, compounded by issues of inconsistent national accounting data (which is prevalent for many developing nations, while developed nations tend to include a SAM version of the national account, generally precise to within 1% of GDP). This was noted as early as 1984 by Mansur and Whalley, and numerous techniques have been devised to ‘adjust’ SAMs, as “inconsistent data estimated with error, [is] a common experience in many countries”. The traditional method of benchmarking a SAM is based on an iterative process that adjusts each individual cell until the row and column totals became equal.
13
4. Updating an Input-Output table: the RAS approach
The RAS method is the most widely known and commonly used automatic procedure for
balancing an Input – Output matrix4: this chapter gives a formal description of such a
procedure (J. F. Francois, 1997). As expected, there is considerable literature reference on the RAS method, either as part of a more general class of mathematical procedures, both as an economic statistics method (Di Palma, 2005).
The amount of statistical information required for the construction of an input-output table is significant: calculations are complex and laborious, processing time are considerable and so national statistics institutes generally performed this kind of work only every 4-5 years. The methods and evaluation procedures are extremely variable; a series of continuous operations and harmonization are performed from time to time in a patient mosaic work, using all available statistical data.
The general methodology can be summarized in the following phases: firstly, it is necessary to evaluate the "frames" of the table, i.e. the sum of rows and columns of the intermediate flows matrix: this involves the construction, for each branch, of the goods and services equilibrium account, the production account and the value added distribution account.
This work starts from the evaluation of the supply flows, namely for each sector the
production xj and the imports mj , and then the value added Vj, the total intermediate
inputs (xj and mj) and components of final demand ( Consumption C, Investment I, Export
E); then, we proceed to determine the matrix of intermediate flows, which is processed by
line, by analyzing by row the sales of intermediate goods and services and by column the cost structure.
The RAS method requires knowledge, for each branch, of the row totals xi. and of the
column total xj. of intermediate outputs and inputs of goods and services: such information
can be determined by knowing the totals of the “frames”, namely the final demand, the intermediate consumptions and the production level. The method also requires the knowledge of a whole matrix at the base year. Generally it is possible to assess directly the majority of the flows of intermediate goods and services, as soon as the necessary data become available. In this case, the application of the RAS method is limited only to the remaining entries.
The method is based on the assumption that the evolution of technical coefficients (see note 5) over time is due to the following factors:
• the price level of the production sector, i.e. the system of relative prices;
• the degree of “absorption” for each good, or the intensity with which a given good has been replaced by (or replaces) other intermediate goods as inputs in the production processes;
• the degree of production of each good, i.e. the use of an intermediate input in the production process, as a share of the total of intermediate inputs.
4 It is curious to note that the RAS acronym is generally explained using the name of the economist sir
14 The three above mentioned factors are supposed to operate in uniform measure: the first of each row and each column, the second on each row and the third on each column of the matrix. To take account of the influence of the above factors it operates in the following way:
First of all the technical coefficients will be corrected to take in account the changes in relative prices. Each technical coefficient of the economic table refers to the year of
construction of the matrix ( ) will be multiplied by the ratio between changes (from the
reference year) of the prices of the sectors i and j 5:
1
Using matrix notation we can write:
2. ̂ ̂
where: technical coefficients matrix of the base year technical coefficients
matrix modified from price effect ̂ diagonal matrix of the price index between base year
and update year ̂ inverse matrix of the above diagonal matrix Then we must take
account of the system modification due to changes in the absorption (r) and fabrication (s) degrees of each good. To perform this, each technical coefficients modified in the previous
step, , will be multiplied for (r) and (s). In matrix notation we can write:
̂ ̂where: is the technical coefficients matrix modified from (r) and (s) effects on each
good ̂ is the diagonal matrix that take account of the variations in the sales (r), is the
diagonal matrix of the price index between base year and update year and ̂ diagonal matrix that take account of the variations in the fabrication processes (r) The updated coefficients can be writing as follow:
3. ( )
Substituting with ( ) we have:
4. ( )
5 We have:
the same ratio with the update prices is:
15 And, then the new value added coefficients:
5. [ ∑ ( )
]
The elements of (r) and (s) matrix are obtained by an iterative procedure based on a set of economic variables at the base year: X gross production, M imports of goods and services, V value added at factors cost, T indirect taxes, C public and private expenditures, I gross investment, E exports of goods and services. On the base of the above dataset, we determine the totals of purchases and sales of intermediate goods, and the marginal distributions of the table:
6. [( ) ( )]
7. [ ( )]
where: IS sales of goods and services of sector i to other sectors purchases of goods
and services of sector i from other sectors. Calculation of the above vectors starts from the
matrix (A*) multiplied by production vector with respect to constraint represented by U,
until iterative process, after a certain number of steps, give (r) and (s). Formally, at year t:
8.
9. ̂
Where the symbols are already defined and I is the identity vector.
At matrix is obtained by A* as follow:
10.
Generally : to get the second term equal to both the term are divided by and
multiplied to ; so:
11. ( ̂ ̂ )
The product ( ̂ ̂ ) is a further correction of original matrix : we can satisfy the other
condition ( ̂ ) operating:
12. ̂ ( ̂ ̂ )
Normally and to get the equality between the two expressions we divide both the
16
13. ̂( ̂ ̂ ̂ ̂ )
At this point, A can be used as correct matrix and iteration give a new vector of sales:
14.( ̂ ̂ ̂ ̂ )
then:
14. ( ̂ ̂ ̂ ̂ ̂ )
repeating 13:
15. ̂( ̂ ̂ ̂ ̂ ̂ )
To match with the z vector we have:
16. ̂( ̂ ̂ ̂ ̂ ̂ ̂ )
After (k+1) iterations, one obtain, for sales and purchases vectors, the follow relationships:
18. ( ̂ ̂ ̂ ̂ ̂ ̂ ̂
)
19. ̂( ̂ ̂ ̂ ̂ ̂ ̂ ̂ ̂ )
Fixing an opportune threshold, the iteration process will converge to a finite solution. At the last iteration, the obtained matrix will be as follow:
20. ( ̂ ̂ ̂ ̂ ) ( ̂ ̂ ̂ ̂ )
The r and s vector will be calculated by the following expressions:
21. ̂ ̂ ̂ ̂ ̂
22. ̂ ̂ ̂ ̂ ̂
The iteration process continues until the totals between rows and columns are equal with an acceptable difference margin, an adequate correspondence threshold error between the two vectors. The research on iterative proportional fitting procedures was firstly related to a probabilistic class of problem in the first half of the last century (Deming & Stephan, 1940), then extended to a several mathematical class of problem and finally demonstrated (Fienberg, 1970) .
17
4.1 An intuitive representation of RAS method
What follows is a simple calculation example that shows how a real program based on the RAS method works. In this example, we show how easily a given square matrix with the new totals assigned can be balanced. We do not follow the formal procedure previously described, which takes into account the production vector and the price adjustment.
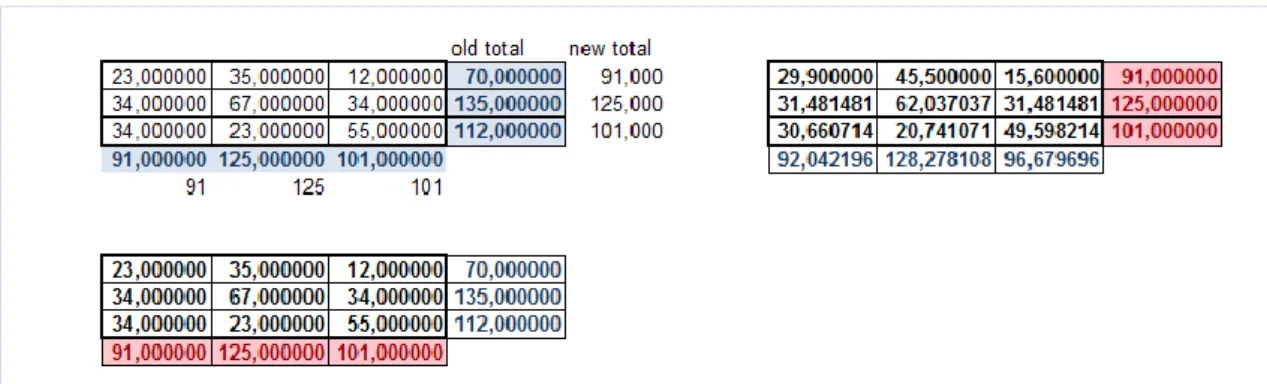
Let us recall that the RAS procedure belongs to a class of methods which is applied to only one of the possible cases (Hunsinger, 2008). Basically, the mechanical operations performed in RAS updating consists in a multiplication of the matrix cell for an index given by the ratio of new branch total and initial (not balanced) branch total. This kind of work has to be done for both rows and columns, in an iterative manner until the matrix is balanced. Let’s start from the matrix at the left top of the above figure, not balanced: we require rows to give the same total of column, so the new total of the rows is reported in the new total column.
Figure 1- A 3x3 matrix not balanced
The matrix on the top-right is obtained multiplying each cell of the first matrix with the ratio of new total and old total (so, 29.90 is equal to 23.00 * 91/70). A similar procedure is applied on the lower matrix, where every cell is equal to cell of the above matrix multiplied for the same previous calculated ratio between new and old total. The first operation consists in copying the values of the matrix balanced for the rows (the top-right matrix) in the first matrix, obtaining:
18 Figure 2 – First step of iterative balance process
Such a step works in order to obtain the required total for the rows but it doesn’t balance the columns. It is necessary a subsequent step: this time, the lower matrix will be copied on the first matrix:
Figure 3 – Second step of RAS balance process
Now columns are balanced, not yet the rows and the procedure has to be repeated:
Figure 4 – End of balance process
At the sixth iteration, the matrix is balanced. Caution is required regarding the threshold, as previously explained. The last figure shows an equivalence between the rows sum and columns sum and, intentionally, exhibits the difference for the internal cells between the
19 first matrix (in yellow) and the top-right matrix (from the fourth digit floating point onwards). We show that, at the final iteration step, the lower matrix is copied on the first one (this explains why the first and lower matrix are equal) while small differences between this one and the top-right matrix yet exist. Indeed, balancing a matrix is a matter of approximation, so it is necessary to fix a certain level of threshold to finish the process: as higher is the threshold as accurate is the correspondence of the balanced matrix with the new fixed marginal totals.
20
5. An application to Italian economy for years 1995 and
2000
Since the RAS method is the most widely known and commonly used automatic procedure for balancing an Input-Output table when not all the needed data are availables, a new procedure called trIOBAL to easely implement the RAS method and obtain satisfactory results has been developed.
In order to test the new trIOBAL procedure, it has been applied to Input Output Tables System (Istat, Il sistema delle tavole input-output, 2014) provided by the National Statistics Institute of Italy (ISTAT 2014) for 1995 (base year) and 2000 (update year). The 1995 table was updated to 2000 prices using price indices published by Istat (Istat, Numeri indici dei prezzi alla produzione dei prodotti industriali venduti sul mercato interno - Base 2000 = 100 - Metodi e Norme, n. 22, 2004).
In particular, using these data we have hypotized unknown the intersectoral flows, supposing known only the rows and columns totals and the total value of the production at the forecasted year. In this way we have applied the routine that performs the RAS method and we have compared the results of the trIOBAL procedure with the real data at the year of prevision. trIOBAL algorithm and software. The new program was developed both in VBA for Excel and GAMS.
The choice of using GAMS in developing the trIOBAL is justified by the existing literature on the methods in updating national accounts matrices (Robinson, Cattaneo, & El-Said, 2001).
The base algorithm is a modification of a GAMS model library example formulated for a toy problem from Miller and Blair (Miller R. E., 2009). This algorithm has been implemented both in VBA and GAMS.
In the GAMS code, the procedure was modified to take account the presence of zeroes in the matrix. Additionally the trIOBAL allows reading and writing the data previously generated in Excel format and subsequently prepared for the GDX transformation.
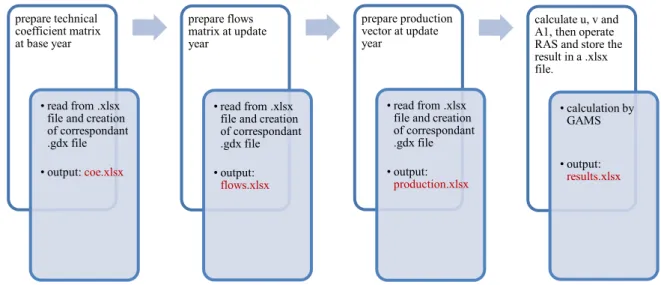
The entire procedure is handled by the VBA main procedure. In other words, a button on the “Main” sheet in the excel file call the GAMS subroutine via MSDOS and the output are imported by the main program in a selected sheet. The main algorithm operations groups are described in the following figure showing the output files of each step in red:
21 Figure 5 – trIOBAL procedure main steps
To better understand the phases of the RAS method, as written in GAMS in the trIOBAL procedure, the basic RAS operations are represented in the following figure:
Figure 6 – The basic step of RAS method in trIOBAL algorithm
The described operations correspond to the well-known canonic form of the iterative proportional fitting of the RAS method.
The first type of modification which considers the treatment of zero is here reported.
prepare technical coefficient matrix at base year
• read from .xlsx file and creation of correspondant .gdx file • output: coe.xlsx prepare flows matrix at update year • read from .xlsx file and creation of correspondant .gdx file • output: flows.xlsx prepare production vector at update year • read from .xlsx file and creation of correspondant .gdx file • output:
production.xlsx
calculate u, v and A1, then operate RAS and store the result in a .xlsx file. • calculation by GAMS • output: results.xlsx 1. set r and s 2. avoid division by zeros 3. calculating new r and s 4. comparing totals to u and v 5. continue iteration until the matrix is balanced
22
a(i) = sum (j, r(i)*a0(i,j)*x(j)*s(j)); r(i)$(a(i) <> 0) = r(i)*u(i)/a(i); r(i)$(a(i) = 0) = 0; b(j) = sum (i, r(i)*a0(i,j)*x(j)*s(j));
s(j)$(b(j) <> 0) = s(j)*v(j)/b(j); s(j)$(b(j) = 0) = 0;
The red lines report the simple conditions applied to original procedure to avoid the division by zero, that use the GAMS left dollar conditions (Rosenthal, 2014). The whole
GAMS code of the trIOBAL routine is reported in the Annex 1.6 The final outputs are
converted by GAMS in .xls file using GDXRRW COMMAND are: Figure 7 – Output of trIOBAL
6 The trIOBAL Visual Basic algorithm can be provided by request. 1. A0 (originary matrix at
Fig u re 8 – M a in in te rfa ce o f tr IO B AL p ro g r a m The a bove fi gure shows the main int erf ac e of the trI O B A L pro gra m whic h is ve ry e as y to us e. On th e top -lef t, the fir st four b utt ons ge ne ra te th e ne ce ssa ry input ( coe , flo ws and produ cti on ve cto rs ) one b y on e or in a unique solut ion (G ene ra te I nput butt on). The g re en butt on, ca lls the GA MS routine b y DO S she ll and ge ne ra te s the output ; then, the purple bu tton im port s the output in the .xls file a nd make the m ava ila ble in the “output ” she et. The “ stat ist ic” she et c ontain s som e elabo ra tions and gr aph s the diff er enc e be tw ee n esti mate d and re al m atri x. Finall y, “R un all proc edur es” butt on pe rfo rm s the e nti re ope ra tion s a bove mentioned. TR
IOBAL
To m m as in o-R ao In pu t O ut pu t B al an ce S of tw ar e 1.0 v er si on Fo r a n y cl a ri fi ca ti o n a b o u t th e p ro ce d u re a n d t h e a n a ly si s re la te d t o fo rt h co m in g p u b li ca ti o n : R a o M ., To m m a si n o M .C ., U si n g t h e R A S m et h o d t o u p d a ti n g t ec h n ic a l c o ef fi ci en ts o f a n In p u t-O u tp u t m a tr ix EN EA T ec h n ic a l P a p er E N E A U ni tà C en tra le S tu di e S tra te gi e - S er viz io A na lis i e S ce na ri te cn ic o-ec on om ic i In se rt y o u r w o rk in g p a th b el o w Lu ng ot ev ere T ha on d i R ev el , 7 6 0 0 1 9 6 R o m a ( R M ) M ar co R ao M ar ia C ris tin a To m m as in o C: \U se rs \R ao \D oc um en ts \g am sd ir \p ro jd ir te l +3 9 0 6 3 6 2 7 2 6 8 1 te l +3 9 0 6 3 6 2 7 2 8 4 2 fa x +3 9 0 6 3 6 2 7 2 8 8 5 fa x +3 9 0 6 3 6 2 7 2 8 8 5 Im por ta nd el abor at e re sul ts Ge ne ra te I nput co e fl ow s p -v ec Th is is a s imp li fi ed v e rs io n o f th e c o mp le te r o u ti n e d e ve le p ed b y au th o rs to te st th e G A M S u p d at in g p ro ce d u re h an d le d b y th e V B A c o d e . Th is v e rs io n do e s no t p e rf o rm fl o w ad ju stme n t b y p ri ce in d ic e s. R U N G A M S P R O CE D U R E R u n a ll p rocedu re s5.1 Results
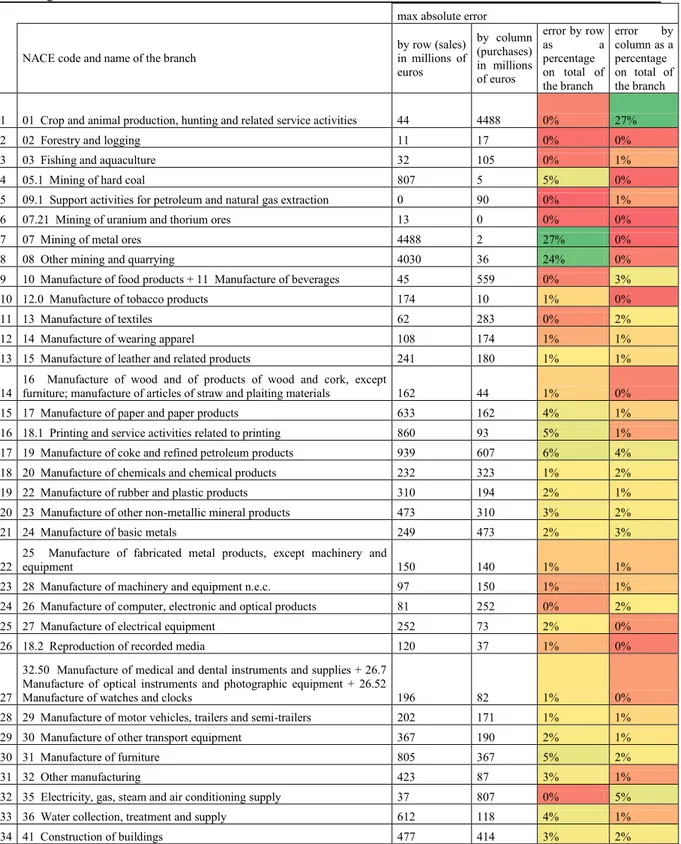
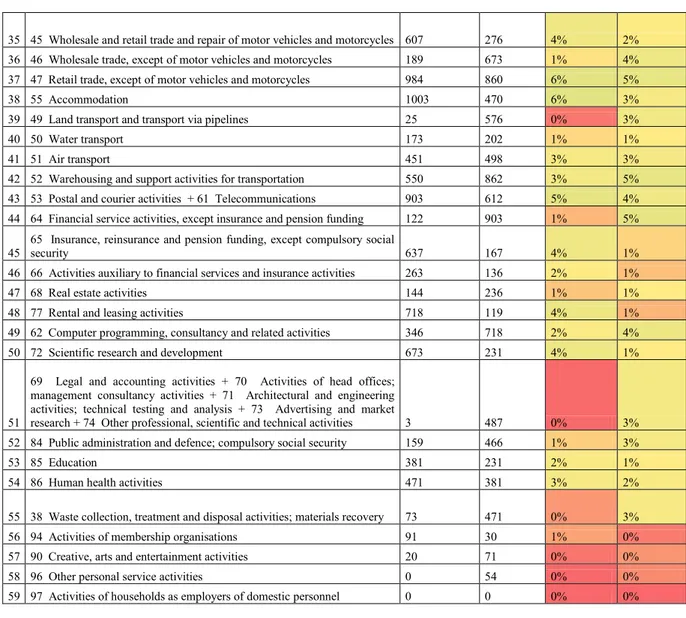
Having followed the trIOBAL procedure, the comparison between the estimated data and the real figures for the year 2000 can be summarized as follows (Table X). Especially it is shown the discrepancies for the 59 sectors included in the Italian table with the real data highlighting the good correspondence of the results with the real data.
Table 6 – Mean Absolute Error (estimated matrix at 2005 – real matrix at 2005) – millions of euros and percentage
max absolute error
NACE code and name of the branch by row (sales) in millions of euros by column (purchases) in millions of euros error by row as a percentage on total of the branch error by column as a percentage on total of the branch 1 01 Crop and animal production, hunting and related service activities 44 4488 0% 27%
2 02 Forestry and logging 11 17 0% 0%
3 03 Fishing and aquaculture 32 105 0% 1%
4 05.1 Mining of hard coal 807 5 5% 0%
5 09.1 Support activities for petroleum and natural gas extraction 0 90 0% 1% 6 07.21 Mining of uranium and thorium ores 13 0 0% 0%
7 07 Mining of metal ores 4488 2 27% 0%
8 08 Other mining and quarrying 4030 36 24% 0% 9 10 Manufacture of food products + 11 Manufacture of beverages 45 559 0% 3% 10 12.0 Manufacture of tobacco products 174 10 1% 0% 11 13 Manufacture of textiles 62 283 0% 2% 12 14 Manufacture of wearing apparel 108 174 1% 1% 13 15 Manufacture of leather and related products 241 180 1% 1% 14 16 Manufacture of wood and of products of wood and cork, except furniture; manufacture of articles of straw and plaiting materials 162 44 1% 0% 15 17 Manufacture of paper and paper products 633 162 4% 1% 16 18.1 Printing and service activities related to printing 860 93 5% 1% 17 19 Manufacture of coke and refined petroleum products 939 607 6% 4% 18 20 Manufacture of chemicals and chemical products 232 323 1% 2% 19 22 Manufacture of rubber and plastic products 310 194 2% 1% 20 23 Manufacture of other non-metallic mineral products 473 310 3% 2% 21 24 Manufacture of basic metals 249 473 2% 3% 22 25 Manufacture of fabricated metal products, except machinery and equipment 150 140 1% 1% 23 28 Manufacture of machinery and equipment n.e.c. 97 150 1% 1% 24 26 Manufacture of computer, electronic and optical products 81 252 0% 2% 25 27 Manufacture of electrical equipment 252 73 2% 0% 26 18.2 Reproduction of recorded media 120 37 1% 0%
27
32.50 Manufacture of medical and dental instruments and supplies + 26.7 Manufacture of optical instruments and photographic equipment + 26.52
Manufacture of watches and clocks 196 82 1% 0% 28 29 Manufacture of motor vehicles, trailers and semi-trailers 202 171 1% 1% 29 30 Manufacture of other transport equipment 367 190 2% 1% 30 31 Manufacture of furniture 805 367 5% 2%
31 32 Other manufacturing 423 87 3% 1%
32 35 Electricity, gas, steam and air conditioning supply 37 807 0% 5% 33 36 Water collection, treatment and supply 612 118 4% 1% 34 41 Construction of buildings 477 414 3% 2%
25
35 45 Wholesale and retail trade and repair of motor vehicles and motorcycles 607 276 4% 2% 36 46 Wholesale trade, except of motor vehicles and motorcycles 189 673 1% 4% 37 47 Retail trade, except of motor vehicles and motorcycles 984 860 6% 5%
38 55 Accommodation 1003 470 6% 3%
39 49 Land transport and transport via pipelines 25 576 0% 3%
40 50 Water transport 173 202 1% 1%
41 51 Air transport 451 498 3% 3%
42 52 Warehousing and support activities for transportation 550 862 3% 5% 43 53 Postal and courier activities + 61 Telecommunications 903 612 5% 4% 44 64 Financial service activities, except insurance and pension funding 122 903 1% 5% 45 65 Insurance, reinsurance and pension funding, except compulsory social security 637 167 4% 1% 46 66 Activities auxiliary to financial services and insurance activities 263 136 2% 1% 47 68 Real estate activities 144 236 1% 1% 48 77 Rental and leasing activities 718 119 4% 1% 49 62 Computer programming, consultancy and related activities 346 718 2% 4% 50 72 Scientific research and development 673 231 4% 1%
51
69 Legal and accounting activities + 70 Activities of head offices; management consultancy activities + 71 Architectural and engineering activities; technical testing and analysis + 73 Advertising and market
research + 74 Other professional, scientific and technical activities 3 487 0% 3% 52 84 Public administration and defence; compulsory social security 159 466 1% 3%
53 85 Education 381 231 2% 1%
54 86 Human health activities 471 381 3% 2% 55 38 Waste collection, treatment and disposal activities; materials recovery 73 471 0% 3% 56 94 Activities of membership organisations 91 30 1% 0% 57 90 Creative, arts and entertainment activities 20 71 0% 0% 58 96 Other personal service activities 0 54 0% 0% 59 97 Activities of households as employers of domestic personnel 0 0 0% 0%
It is necessary to remember that RAS method is a purely mathematical-mechanical method, without any economical signification. the strengths of this method are the simplicity of its implementation and the good degree of approximation with respect to the exact solution.
Figure 9 – Distribution of I-O flows for Mean Absolute Error on total flows of the branch
40,7% 90,7% 97,5% <1% 1-5% 5-10% Pe rc en ta g e o f M A E o f th e b ra n ch es o n t o ta l o f th e b ra n ch es
Class of MAE expressed as a percentage of total flows of the branch percentage of cells total
26 The figure x shows that 40% circa of the total Mean Absolute Error is less than 1% of the total of the branch. In absolute terms, this is equivalent to say that for 48 branches (that is circa the 40% of the 118, the total number of the branches) the MAE is less the 1% of the relative total flows as reported in the I-O table.
27
6. Conclusions
The RAS method is a common, well known procedure to update technical coefficients of input-output tables and social accounting matrix. This report presents the trIOBAL application, an easy-to-use tool developed in VBA-GAMS that combines the use of Microsoft Excel with a state-of-art optimization instrument like GAMS, in order to implement the RAS method to balance an input-output table.
The trIOBAL software can be thought as a first operative result in this line of research. The trIOBAL routine is intended for didactical use and includes only few elaborations on input and output data. This program could be easily improved in order to add some useful functionalities (like automatic retrieving and updating national accounts data) and some ex-post elaborations (statistical indices, comparison with other statistics and so on).
28 Figures
Figure 1- A 3x3 matrix not balanced ... 17
Figure 2 – First step of iterative balance process ... 18
Figure 3 – Second step of RAS balance process ... 18
Figure 4 – End of balance process ... 18
Figure 5 – trIOBAL procedure main steps ... 21
Figure 6 – The basic step of RAS method in trIOBAL algorithm ... 21
Figure 7 – Output of trIOBAL ... 22
Figure 8 – Main interface of trIOBAL program ... 23
29
Bibliography
B. Trinh, N. V. (2013). A Short Note on RAS Method –Advances in Management & Applied
Economics, vol. 3, no.4, 2013, 133-137. Scienpress Ltd.
Deming, W. E., & Stephan, F. F. (1940). On a least squares adjustment of a sampled frequency table when the expected marginal totals are known. Annals of Mathematical Statistics Vol.
11, 427-444.
Di Palma, M. (2005). Tecniche di aggiornamento di una tavola delle interdipendenze settoriali. Roma: Università degli Studi di Roma "La Sapienza".
Fienberg, S. E. (1970). An iterative procedure for estimation in contingency tables. The Annals of
Mathematical Statistics Vol. 41 No.3, 907-917.
Hunsinger, E. (2008, May). Iterative Proportional Fitting For A Two Dimensional Table. Retrieved
February 2, 2014, from http://www.demog.berkeley.edu/:
http://www.demog.berkeley.edu/~eddieh/IPFDescription/AKDOLWDIPFTWOD.pdf Istat. (2004). Numeri indici dei prezzi alla produzione dei prodotti industriali venduti sul mercato
interno - Base 2000 = 100 - Metodi e Norme, n. 22. Roma: Istat.
Istat. (2014, febbraio 2). Il sistema delle tavole input-output. Retrieved febbraio 2, 2014, from Il sistema delle tavole input-output: http://www.istat.it/it/archivio/3646
J. F. Francois, K. A. (1997). Applied Methods for Trade Policy Analysis: A Handbook, cap. 4,
94-121. USA: Cambridge University Press.
Leontief, W. W. (1936). Quantitative Input-Output Relations in the Economic System of the United States. Review of Economics and Statistics, 105-125.
Miller, R. E. (2009). Input-Output Analysis: Foundations and Extensions. New York: Cambridge University Press.
Miller, R. E., & Blair, P. D. (2009). Appendix C Historical Notes on the Development of Leontief’s Input–Output Analysis. In R. E. Miller, & P. D. Blair, Input - Output Analysis -
Foundations and Extensions - Second Edition (pp. 724-737). Cambridge: Cambridge
University Press.
Miller, R. E., & Blair, P. D. (2009). Foundations of Input - Output Analysis. In R. E. Miller, & P. D. Blair, Input - Output Analysis - Foundations and Extensions - Second Edition (pp. 10-68). Cambridge: Cambridge University Press.
Mitra-Kahn, B. H. (2008). Debunking the Myths of Computable General Equilibrium Models.
SCEPA Working Paper, 23.
Robinson, S., Cattaneo, A., & El-Said, M. (2001). Updating and Estimating a Social Accounting Matrix Using Cross Entropy Methods. Economic Systems Research, 47-64.
Rosenthal, R. E. (2014, January 30). GAMS - On Line Documentation. Retrieved January 30, 2014, from GAMS: http://www.gams.com/docs/document.htm
Stone, R., & Brown, A. (1962). A computable model for economic growth. Cambridge: Cambridge Growth Project.
U.N, Bank, W., IMF, Commission, E., & OECD. (2009). System of National Accounts 2008.
Retrieved February 2, 2014, from 2008:
http://synagonism.net/standard/economy/un.sna.2008.html U.N. (1968). A System of National Accounts. New York: United Nations.
APPENDIX 1 – GAMS CODE
$title Updating and Projecting Coefficients: The RAS Approach - An application to Italy I-O Matrix for years 1995-2000
$ontext
This code propose a variant of the original algorithm (from Miller, Blair, 2009) applied to a real case study. The additional optimization formulations have been removed and several modifications have been added to update a real input-output matrix for the Italian economy. Reference: Rao M., Tommasino M.C., Updating technical coefficients of an Input-Output matrix with RAS – The trIOBAL software
ENEA Technical Paper, forthcoming publication, 2014. $offtext
set i / 1*57 /; alias(i,j); parameter a0(i,j) coe matrix;
$if not exist coe.gdx $call 'gdxxrw i=coe.xlsx o=coe.gdx par=a0 rng=A1:BF58 rdim=1 cdim=1';
$gdxin coe.gdx $load a0 $GDXIN
parameter z1(i,j) flows matrix;
$if not exist flows.gdx $call 'gdxxrw i=flows.xlsx o=flows.gdx par=z1 rng=A1:A58 rdim=1 cdim=1';
$GDXIN flows.gdx $LOAD z1
$GDXIN
parameter x(j) observed total output;
$if not exist production.gdx $call 'gdxxrw i=production.xlsx o=production.gdx par=x rng=A1:A58 rdim=1';
$GDXIN production.gdx $LOAD x
$GDXIN
parameter
u(i) observed row totals v(j) observed column totals a1(i,j) unknown matrix A; u(i) = sum(j, z1(i,j));
v(j) = sum(i, z1(i,j)); a1(i,j) = z1(i,j)/x(j); display u, v, a1; * * --- 1: RAS updating *
31
parameters r(i) row adjustment s(j) column adjustment; r(i) = 1; s(j) = 1;
parameter oldr,olds,maxdelta; maxdelta=1; parameter a(i)
b(j); repeat oldr(i) = r(i); olds(j) = s(j);
a(i) = sum (j, r(i)*a0(i,j)*x(j)*s(j)); r(i)$(a(i) <> 0) = r(i)*u(i)/a(i); r(i)$(a(i) = 0) = 0;
b(j) = sum (i, r(i)*a0(i,j)*x(j)*s(j)); s(j)$(b(j) <> 0) = s(j)*v(j)/b(j); s(j)$(b(j) = 0) = 0;
maxdelta = max(smax(i, abs(oldr(i)-r(i))), smax(j, abs(olds(j)-s(j)))); display maxdelta;
until maxdelta < 0.005;
parameter report(*,i,j) summary report; option report:3:1:2; report('A0' ,i,j) = a0(i,j);
report('A1' ,i,j) = a1(i,j);
report('RAS',i,j) = r(i)*a0(i,j)*s(j); display report;
execute_unload "results.gdx" report; execute 'gdxxrw.exe results.gdx par=report';
Edito dall’
Servizio Comunicazione
Lungotevere Thaon di Revel, 76 - 00196 Roma
www.enea.it
Stampa: Tecnografico ENEA - CR Frascati
Pervenuto il 7.4.2014