Technical Report CoSBi 07/2007
Molecular mechanism of energy metabolism in
astrocytes: a parametric model from FDG
PET images
Paola LeccaThe Microsoft Research - University of Trento Centre for Computational and Systems Biology
[email protected] Michela Lecca Fondazione Bruno Kessler
Center for Information Technology, Trento, Italy [email protected]
This is the preliminary version of a paper that will appear in
Advances in Brain, Vision, and Artificial Intelligence, Lecture Notes in Computer Science, Springer
Molecular mechanism of energy metabolism in
astrocytes: a parametric model from FDG PET
images
Paola Lecca and Michela Lecca
Abstract
The signals detected during physiological activation of the brain with18F-deoxyglucose DG PET reflect predominantly uptake of this tracer into astrocytes. This notion provides a cellular and molecular basis for the FDG PET technique. Although in recent years the func-tional brain imaging has experienced enormous advances, the cellular and, in particular, the molecular mechanisms generating the signals detected by these techniques are not completely known. In this paper, we present a computational model that attempts to disentangle the in-tricate nature of the molecular interactions governing the brain energy metabolism. The model describes the glutamate-stimulated glucose uptake and use into astrocytes. It consists of a set of ordinary dif-ferential equations, each of which specifying the time-behavior of the main molecular species involved in the astrocytic glucose use (i. e. glutamate, glucose, Na+, β-threohydroxyaspartate) and the dynam-ical rates of glutamate, glucose and Na+ uptake. The kinetic rates constants of the model have been identified on a set of dynamic PET images. As far as we know, a mathematical and computational model of the brain energy metabolism at the molecular level has been never proposed. The relevance of such a model to the PET functional brain imaging consists in providing an in silico framework, in which to exper-iment the molecular glucose dynamics and elucidate their still elusive aspects.
1
Introduction
Positron Emission Tomography, also called PET imaging or PET scan is both a medical and research used to detect blood flow, oxygen consump-tion and energy metabolism. It consists in the acquisiconsump-tion of physiologic images based on the detection of radiation from the emission of positrons. To conduct the scan, a short-lived radioactive tracer isotope, that decays by emitting positrons, is chemically incorporated into a metabolically active molecule. Most commonly, this molecule is the fluorodeoxyglucose (FDG). Then the radioactive tracer attached to the metabolic molecule is injected into the blood circulation of the patient. After a waiting period time that the active metabolite needs to concentrate in the tissues, the patient is placed in the imaging scanner. The changing of regional blood flow in var-ious anatomic structures as a measure of the injected positron emitter can been visualized and quantified with a PET scan. FDG-PET is widely used in clinical oncology, but is also an important research tool to map brain functions, since it is capable of detecting areas of molecular biology detail even prior to anatomic change. The kinetics of the FDG tracers are similar to glucose. It passes through the brain-blood barrier and is phosphorylated intracellularly in a process analogous to the glucose. The phosphorylized FDG compound does not enter in the Krebs cycle, thence it is effectively trapped.
Despite the striking advances in PET functional brain imaging [5, 10], the molecular mechanisms that underlie the signals detected by this technique are still largely unknown. The basic physiological principle is represented by the tight coupling between neuronal activity and the associated increase in both blood flow and glucose metabolism. The development of the autora-diographic 2-deoxyglucose method by Sokoloff about 30 years ago, proved the coupling between synaptic activity and glucose use, the so-called neu-rometabolic coupling [11, 12]. Wet experimental analyses in vitro have been carried out to investigate the neurotransmitter-regulated metabolic fluxes and to determine the cellular localization of enzymes and transporters in-volved in the glucose metabolism. At the same time in vivo approaches, as microdialysis and magnetic resonance approaches have recognized in the neurotransmitter glutamate and astrocytes, a specific type of glial cells, the key elements in the coupling between the synaptic activity and the glu-cose metabolism (for a detailed review about recent and less recent studies see [6]). Nevertheless, many aspects of the molecular interactions driving the glucose uptake and consumption are still elusive. In this article we present a mathematical model of the glutamate-triggered glucose uptake and metabolism by focusing on the emerging central role of the reaction occurring within astrocyrtes. At the best of our knowledge, this work is the first to provide a computational model related to the molecular basis of the use of the glucose in astrocytes. Our model consists of a set of seven
differ-ential equations, describing the time behavior of the glutamate and glucose use into the astrocyte. The synaptically released glutamate triggers glucose flux in astrocytes. The time course model of the glucose concentration in-side that glial cell is related to the concurrency of the inhibitory action of the β-threohydroxyaspartate on the glutamate-stimulated glucose use and
the activity of the Na+/K+-ATPase. The latter stimulates glucose uptake
and glycolysis. The simulation parameters of the model, as the initial con-centration of the reactants molecules and the kinetic rate constants, have been estimated by a slice-by-slice fit of the data of 31 PET-scans, each of which consisting of 15 horizontal slices, of a brain of a normal subject. The shapes of the brain activity curves, obtained by solving the equations, show a behavioral agreement with the typical measured blood activity curves of normal subjects [14]. Moreover, the results of our model simulations are in agreement with the simulations of the Sokoloff’s model describing the kinet-ics of the compound FDG. This last fact, in particular, validates our model further on, since it is an additional confirmation that the model includes the most salient features of the molecular machinery of the astrocytic glucose metabolism. Finally, whit respect to the model presented in this paper, the Solokoloff’s model can be considered as a black box approach to the glucose metabolism kinetics, that Solokoloff indirectly obtained from the kinetics of the FDG tracer.
2
Glucose use in astrocytes
Astrocytes are sub-type of the glial cells in the brain. Following a group of recent studies, researchers have found an increasing amount of evidence that suggests that the astrocytes play a central role in brain function by affecting the activity of neurons, by taking an active part in the distribution of energy substrates from the circulation to neurons [15, 16]. The ratio between neuronal and non-neuronal cells depends on species, brain areas or developmental ages, it is a well-established fact that neurons contribute at most 50% of cerebral cortical volume [2] and that the astrocytes outnumber the neurons ten to one.
Astrocytes are stellate cells (hence their name) with multiple fine pro-cesses, some of which are in close apposition to capillary walls. The en-tire surface of intraparenchymal capillaries is covered by these specialized processes, called astrocytic end-feet. This cytoarchitectural arrangement implies that astrocytes form the first cellular barrier encountered by the glucose entering the brain parenchyma. Therefore astrocytes are a likely site of prevalent glucose uptake. The uptake of glucose in astrocyte is trig-gered by glutamate. The glutamate is the main excitatory neurotransmitter of the cerebral cortex. Activation of afferent pathways by specific modalities (e. g. visual, auditory, somatosensory) results in a spatially and temporally
defined local release of glutamate from the activated specific synapses. The action of glutamate on postsynaptic neurons terminates with the reuptake of glutamate in astrocytes [1, 3, 4].
Glutamate uptake into astrocytes is driven by the electro-chemical
gra-dient of Na+; it is an Na+-dependent mechanism with a stoichiometry of
three Na+ ions cotransported with one glutamate molecule. A consequence
of the glutamate uptake into astrocytes is the stimulation of glucose uptake and aerobic glycolysis in these cells, i. e. of glucose use [8]. Glutamate-stimulated increase in glucose uptake into astrocytes is abolished in the
ab-sence of Na+in the extracellular medium, consistently with the necessity for
an electro-chemical gradient for the ion to drive glutamate uptake. A cen-tral role in the coupling between glutamate transporter activity and glucose
uptake into the astrocytes is the activation of the Na+/K+-ATPase. The
as-trocytic Na+/K+-ATPase responds to increases in intracellular Na+
concen-tration. Well established experimental observations [9] show that glutamate
activates Na+/K+-ATPase. There is also an ample evidence from studies in
a variety of cellular systems including brain, kidney, vascular smooth
mus-cle and erythrocytes, that increases in the activity of the Na+/K+-ATPase
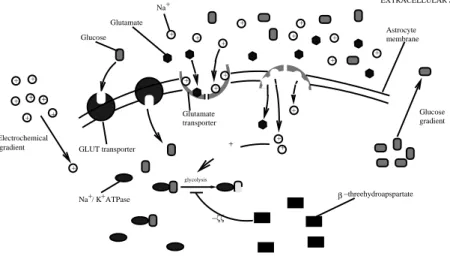
stimulates glucose uptake and glycolysis [8]. Finally, the specific gluta-mate transporter inhibitor β-threohydroxyaspartate inhibits the glutagluta-mate- glutamate-stimulate glucose use [6, 8]. Figure 1 depicts the mechanism of glucose absorption and use inside the astrocyte.
EXTRACELLULAR SPACE Glucose gradient GLUT transporter Glutamate Glucose Glutamate Na+ + + + + + + + + + + + + + + + + + + + + glycolysis + Na / K ATPase+ + β−threehydroapspartate Electrochemical gradient + + transporter + −ζζ Astrocyte membrane
Figure 1: A diagram of the reactions governing the astrocytic glycolysis.
3
The kinetic model
The rate equation of the concentration of glucose in the astrocyte (GLU COSEIN)
glutamate-stimulated glucose increase as a direct proportionally between the time derivative of glucose astrocytic concentration and the glutamate astrocytic concentration (GLU T AM ). The second term is the product of the rate of glucose uptake and its astrocytic concentration. This term expresses the proportionality between the time change of astrocytic glucose and both the
flux of incoming glucose (GLIN) and the glucose astrocytic concentration.
Finally, the third term in Eq. (1) represents the decrease of glucose in
astrocyte due to the Na+/K+-ATPase - stimulated glycolysis. Since the
as-trocytic Na+/K+-ATPase is activated by glutamate in response to increases
in intracellular Na+ concentration, the rate equation for Na+/K+-ATPase
(Eq. (3)) is given by a term proportional to the concentration of Na+ in
the astrocyte and by a negative term proportional to the amounts of
β-threohydroxyaspartate and Na+/K+-ATPase. This term models the
inhibi-tion of glutamate-stimulated glucose use performed by β-threohydroxyaspartate. In Eq. (3) the inhibition of glycolysis is modeled by a decrement term in
the rate equation of Na+/K+-ATPase. In fact a decrement of the amount
of this enzyme causes a decrement of the glycolytic events.
Glucose entering into the astrocyte (1)
dGLU COSEIN
dt = k1 GLU T AM + k2 GLIN· GLU COSEIN− k3 N A K AT P ase · GLU COSEIN
Glutamate entering into the astrocyte (2)
dGLU T AM dt = k4 GTIN· GLU T AM Na+ K+ ATPase (3) dN A K AT P ase dt = k5 N AIN − k6GT IN HIBIT · N A K AT P ase β threohydroxyaspartate (4) dGT IN HIBIT dt = −k7 N AIN· GT IN HIBIT
Rate of glucose uptake into the astrocyte (5)
dGLIN
dt = k8GLU TOP EN· GLIN
Rate of glutamate uptake into astrocyte (6)
dGTIN
dt = (k9 GLT 1 + k10 GLAST )GT IN + k11 (N AIN− N AOU T)
Na+ uptake into astrocyte (7)
dN A IN
dt = k12 GLU T AM
(8)
is the product of the glutamate amount in the cell and the flux of
incom-ing glutamate (GTIN). The fluxes of glutamate and glucose entering the
astrocyte (GLIN and GTIN, respectively) have been modeled as functions
of time. Experimentally the rate at which glucose is transported into the cell is determined by the rate at which the concentration of glucose accumu-lates inside the cell in the absence of metabolism [7]. Thence, the temporal derivatives of the glucose and glutamate fluxes are given by Eq. (5) and Eq. (6) respectively. Eq. (5) con stains a terms accounting for the number of
GLUT transporter in an open state (GLU TOP EN), i. e. transporters that
are facing the exterior of the cell and ready to receive a glucose molecule. Similarly, Eq. (6) contains a term proportional to the fraction of two types of glutamate transporters GLT 1 and GLAST and a term proportional to the
difference between the internal and external concentration of Na+ (N A
IN
and N AOU T, respectively).
Eq. (4) is the rate equation for the β-threohydroxyaspartate. The time derivative of this inhibitor is given by the product of the concentration of
β-
threohydroxy-aspartate itself and the concentration of Na+. Namely, since the inhibitory
activity of the β-threohydroxyaspartate is consequent to the increase of the
concentration of Na+, that in turn is also responsible for the activation of
the glycolytic activity of Na+/K+-ATPase.
Finally, Eq. (7) describes the time behavior of the astrocytic
concentra-tion of Na+. Its time derivative is proportional to the astrocytic
concen-tration of glutamate. This equation express the direct relationship between
glutamate and the cotransported Na+. The coupling between synaptic
glu-tamate release and its re-uptake into astrocyte is so tight that the
deter-mination of the Na+ current generated in astrocytes by the co-transport of
glutamate and Na+through the glutamate transporters provides an accurate
estimate of glutamate release from the synapses [1].
3.1 PET image processing and parameters derivation
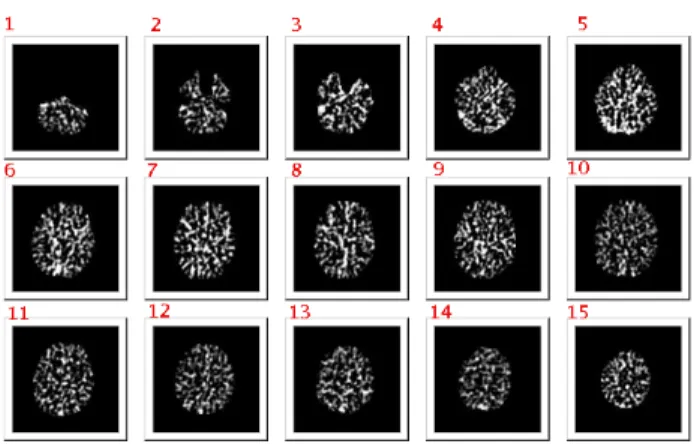
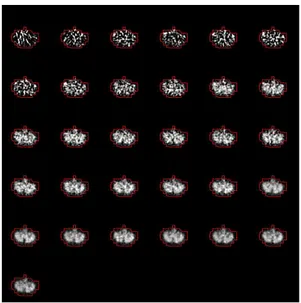
The dynamic FDG PET data used in this work have been provided by the Neurobiology Research Group, Rigshospitalet, Copenhagen. These data consist of 31 three-dimensional grey level images of the brain of a normal subject. The scans have been taken with a Scanditronix 4096 scanner on a time range of 3429 seconds. Figure 2 shows a set of brain slices of the data base used in this work.
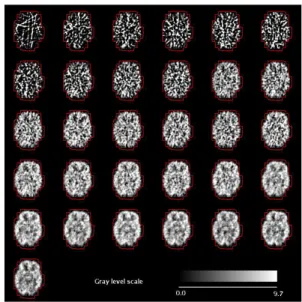
To identify the kinetic rates ks of the model we used a standard fit pro-cedure of the time-dependency of glucose concentration obtained from the PET images. For the fit we used a simple least squares cost function. Before obtaining the measured time-dependence of glucose concentration, the im-ages have been processed in order to eliminate noise and border effects and identify exclusively the region corresponding to the brain. The identification
Figure 2: A view of a set of brain slices.
of the brain region and the elimination of the noisy parts on the borders of
the skull have been performed with the following procedure. Let Ij denote
the 3D-scan taken at time tj and {I1
j, . . . , Ij15} with j = 1, . . . , 31, the set
of 15 slices of the j-th scan. For each scan Ij and for each slice Ijk (k = 1,
. . . , 15), we calculated the smallest polygon Pjk , enclosing the pixels, whose
grey-level is greater than zero (i. e. the pixels which do not belong to the background). The boundary of this polygon has been smoothed by a simple procedure of elimination of its parts having thickness larger than one pixel.
Hence, for each slice Ik
j, the region Rkj, we estimated as region effectively
corresponding to the brain, is given by the topological internal part of Pjk
and the Pk
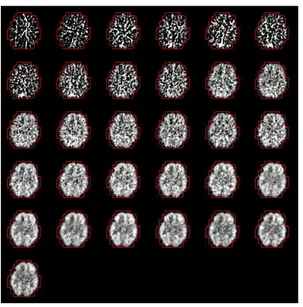
j boundary itself (see Figure 3 related fo slice 7 and the figures in
Appendix B related to the other slices). Moreover, we defined
Rk ≡ ∪31h=1Rkh, k = 1, . . . , 15
and we calculated the glucose concentration variation slice by slice using the following formula dGk dt (ti) = 1 Area(Rk) X p∈Rk |σp(ti) − σp(ti+1)| ti+1− ti (9)
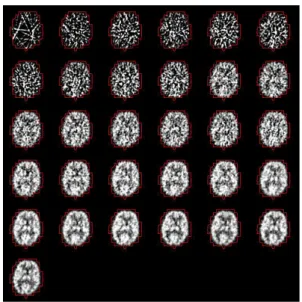
Figure 3: The red boundary encloses the regions Rk
j for j = 1, . . . 31 and k
= 7. The value on the grey level scale are measured in Bq/cc.
Two kinds of analyses has been carried out pixel by pixel to reveal a possible partitioning of the brain slice in activation areas:
• For each slice Ik
j of an image Ij we defined a frequency map M of pixel
activation in the following way
M : Rk−→ N
M [p] =
½
0 if p /∈ Rk
m otherwise
where m is the number of intensity’s changes occurred in pixel p. This analysis showed that almost all the pixels exhibit the same fre-quency of intensity’s change.
• We also computed pixel by pixel for each slice of each scan the average
glucose variation to detect possible clusters of pixels characterized by different levels of changes in glucose concentration variation. Also this kind of analysis showed that the time changes in glucose contrition are homogeneously distributed.
The set of figures in Appendix B shows a homogeneous distribution of pixels of any intensity.
The only spatial partitioning detectable in our data set consists in two set of images: set 1 consisting of the 31 scans of the brain slice 1 and 2, and
set 2 containing the 31 scans of the reaming 14 slices (from 3 to 15). The
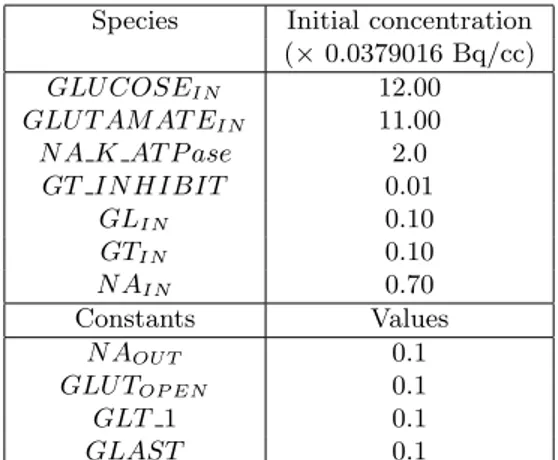
numeration of the slices refer to the one given in Figure 2. This partitioning is pointed out by the different rate, with which the glucose concentration changes over time. Figures 4 a. and b. show the time behavior of glucose concentration for the slices of set 1 and set 2, respectively. In table 1 the values of the initial concentrations of the reactants and the kinetic rates constants are shown. Figure 5 shows the model simulation of time-dependent glucose concentration for the slices of set 1.
Species Initial concentration
(× 0.0379016 Bq/cc) GLU COSEIN 12.00 GLU T AM AT EIN 11.00 N A K AT P ase 2.0 GT IN HIBIT 0.01 GLIN 0.10 GTIN 0.10 N AIN 0.70 Constants Values N AOU T 0.1 GLU TOP EN 0.1 GLT 1 0.1 GLAST 0.1
Rate Value (sec−1) Value (sec−1)
Set 1 Set 2 k1 0.0003 0.0100 k2 0.0003 0.0500 k3 0.0100 0.1000 k4 0.0100 0.3000 k5 0.1000 0.2000 k6 0.0800 0.0800 k7 0.1000 0.0300 k8 0.0100 0.0500 k9 0.1000 0.1000 k10 0.1000 0.2000 k11 0.1000 10.000 k12 0.1000 0.1000
a. 0 2 4 6 8 10 12 14 16 0 50 100 150 200 250 300 glucose variation
time intervals [sec] Glucose Variation in Slices 1 and 2
b. 0 2 4 6 8 10 12 14 16 0 50 100 150 200 250 300 glucose variation
time intervals [sec] Glucose Variation in Slices from 3 to 15
Figure 4: a. Time behavior of glucose concentration in brain slice 1 and slice 2. The values on y-axis express are measured in 0.0379016 × Bq/cc. b. Time behavior of glucose concentration for slices 3-15. The values on
y-axis express are measured in 0.0379016 × Bq/cc.
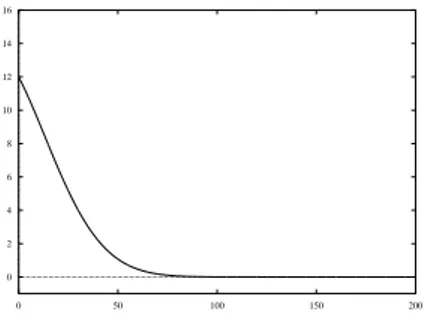
0 2 4 6 8 10 12 14 16 0 50 100 150 200
Figure 5: Numerical solution of the model for the kinetic parameters of set 1. On y-axis the glucose concentration is plotted, whereas the x-axis reports the time in seconds.
4
Conclusions and future directions
Functional neuroimaging techniques such as PET have provided valuable insights into the working brain. However, fundamental questions related to the cellular and molecular aspects of neurometabolic coupling are un-resolved. Moreover different PET studies provide discordant results about glycolytic metabolism, that in general are related to methodological issues and different simulation protocols. Our computational model describes the molecular origin of the neurometabolic coupling and provides also a theo-retical framework to understand and experiment the glucose metabolism by tuning the initial conditions and rate parameters. The model simulations, performed with the kinetic parameters derived from the PET images, are consistent with the blood activity curves observed in the PET studies on normal subjects [14]. The data used in this work to derive the kinetic rate constants do not reveal an evident spatial partitioning of the brain slice in specific activation areas, as in the studies in [14]. The difference, we
de-tected, between the values of the kinetic rates of the two sets of slices may suggest different explanatory hypotheses, such as differences in astrocytic spatial distribution and metabolism in different slices in the brain of the subject considered in this studies. Future advances in our work will consist in the development of methods to model the noise in the PET image in order to obtain less noisy blood activity curves and consequently more accurate estimates of the rate parameters. Moreover the study will be extended to a data set of subjects engaged in specific activities. In this case, by fitting our molecular model to these kind of data it may be possible to individu-ate regional sets of kinetic rindividu-ates accurindividu-ately correponding to brain activation areas.
Acknowledgements
The authors thank Claus Svarer of Neurobiology Research Unit, Copenhagen University Hospital Rigshospitalet. Claus kindly provided the PET data used in this work.
References
[1] D. E. Bergles and C. E. Jahr, Glials contribution to glutamate up-take at Schaffer collateral-commissural synapses in the hippocampus. J. Neurosci, vol. 18, pp. 7709-7716, 1998.
[2] A. Bignami, Glial cells in the central nervous system. Discussions in neuroscience, vol. 8, no. 1, pp. 1-45, 1991.
[3] L. Hertz, L. Peng and G. A. Dienel, Energy metabolism in astrocytes: high rate of oxidative metabolism and spatiotemporal dependence on glycoslysis/glycogenolysis, J. of Cerebral Blood Flow & metabolism, vol. 27, pp. 219-249, 2007
[4] K. A. Kasiscke, H. D. Vishwasrao, P. J. Fisher, W. R. Zipfel and W. W. Webb, Neuronal activity triggers neuronal oxidative metabolism followed by astrocytic glycolysis, Science, vol.305, no. 5680, pp. 99-103, July 2004.
[5] Y. Kimura, Y. Takabayashi, K, Oda, K, Ishii and K. Ishiwata, Func-tional image on glucose metabolism in brain using PET with short time scan, In Procs of the 25th Annual International Conference of the IEEE EMBS, Cancun, Mexico 2003.
[6] P. J. Magistretti and L. Pellerin, Cellular mechanisms of brain en-ergy metabolism and their relevance to functional brain imaging., Phil. Trans. R. Soc. Lond. B, vol. 354, pp. 1155-1163, 1999.
[7] E. S. Marland and J. E. Keizer, Transporters and Pumps, Chapter 3 of Computational Cell Biology C. P. Fall, E. S. Marland, J. M. Wagner and J. J. Tyson Editors, Springer-Verlag 2000.
[8] L. Pellerin and P. J. Magistretti, Glutamate uptake into astrocytes stimulates aerobic glycolysis: a mechanism coupling neuronal activity to glucose utilization, Proc. Natl. Acad. Sci., vol. 91, pp. 10625-10628, 1994.
[9] L. Pellerin and P. J. Magistretti, Glutamate uptake stimulates
Na+/K+-ATPase activity in astrocytes via an activation of the
Na+/K+-ATPase, J. Neurochem. vol69, pp. 2132-2137.
[10] R. G. Shulman, Functional imaging studies: linking mind and basic
neuroscience, Am. J. of Psychiatry, 2001.
[11] L. Sokoloff, M. Reivich, C. Kennedy, M. H: des Rosiers, C. S. Patlak,
K. D. Pettigrew, O. Sakurada and M. Shinoara, The [14C]deoxyglucose
method for the measurement of local cerebral glucose utilization: theory, procedure, and normal values in the conscious and anesthetized albino rat., J. of Neurochem., vol. 26, pp. 897-916, 1977.
[12] L. Sokoloff, Relationship between functional activity and energy metabolism in the nervous system: whether, where and why? In Brain work and mental activity (ed. N. A. Lassen, D. H. Ingvar, M. E. Raichle and L. Friberg), pp. 52-64 Copenhagen: Munskgaard, 1991.
[13] L. Sokoloff, Energetics of functional activation in neural tissues. Neu-rochem. Res. vol. 24, pp. 321-329, 1999.
[14] C. Svarer, I. Iaw, S. Holm, N. Mørch and O. Paulson, Estimation of the glucose metabolism from dynamic PET-scan using neural networks (available at citeseer.ist.psu.edu/227145.html), 1995.
[15] T. Takano, G. F. Tian, W. Peng, N. Lou, W. Libionka, X. Han and M. Nedergaard, astrocytes mediated control of cerebral blood flow, Nat. Neurosci. vol. 9, p. 260-267, 2006.
[16] A. Volterra and J. Meldolesi, Astrocytes, from brain glue to communi-cation: the revolution continues, Nat. rev. Neurosci, no.6 pp. 626-640, 2005.
A
Appendix
Figure 6: Sets of scans of slice 1. The red boundary encloses the regions Rk
j for j = 1, . . . 31 and k = 1. The value on the grey level scale are measured in Bq/cc.
Figure 7: Sets of scans of slice 2. The red boundary encloses the regions Rk
j for j = 1, . . . 31 and k = 2. The value on the grey level scale are measured in Bq/cc.
Figure 8: Sets of scans of slice 3. The red boundary encloses the regions Rk j for j = 1, . . . 31 and k = 3. The value on the grey level scale are measured in Bq/cc.
Figure 9: Sets of scans of slice 4. The red boundary encloses the regions Rk
j for j = 1, . . . 31 and k = 4. The value on the grey level scale are measured in Bq/cc.
Figure 10: Sets of scans of slice 5. The red boundary encloses the regions Rk j for j = 1, . . . 31 and k = 5. The value on the grey level scale are measured in Bq/cc.
Figure 11: Sets of scans of slice 6. The red boundary encloses the regions Rk
j for j = 1, . . . 31 and k = 6. The value on the grey level scale are measured in Bq/cc.
Figure 12: Sets of scans of slice 7. The red boundary encloses the regions Rk j for j = 1, . . . 31 and k = 7. The value on the grey level scale are measured in Bq/cc.
Figure 13: Sets of scans of slice 8. The red boundary encloses the regions Rk
j for j = 1, . . . 31 and k = 8. The value on the grey level scale are measured in Bq/cc.
Figure 14: Sets of scans of slice 9. The red boundary encloses the regions Rk j for j = 1, . . . 31 and k = 9. The value on the grey level scale are measured in Bq/cc.
Figure 15: Sets of scans of slice 10. The red boundary encloses the regions
Rk
j for j = 1, . . . 31 and k = 10. The value on the grey level scale are
Figure 16: Sets of scans of slice 11. The red boundary encloses the regions
Rkj for j = 1, . . . 31 and k = 11. The value on the grey level scale are
measured in Bq/cc.
Figure 17: Sets of scans of slice 12. The red boundary encloses the regions
Rk
j for j = 1, . . . 31 and k = 12. The value on the grey level scale are
Figure 18: Sets of scans of slice 13. The red boundary encloses the regions
Rkj for j = 1, . . . 31 and k = 13. The value on the grey level scale are
measured in Bq/cc.
Figure 19: Sets of scans of slice 14. The red boundary encloses the regions
Rk
j for j = 1, . . . 31 and k = 14. The value on the grey level scale are
Figure 20: Sets of scans of slice 15. The red boundary encloses the regions
Rk
j for j = 1, . . . 31 and k = 15. The value on the grey level scale are

![(1)Bibliography [1] Alex Alcocer, Paulo Oliveira, and Antonio Pascoal](data:image/gif;base64,R0lGODlhAQABAIAAAP///wAAACH5BAEAAAAALAAAAAABAAEAAAICRAEAOw==)