UNIVERSITA' DEGLI STUDI DI TRENTO - DIPARTIMENTO DI ECONOMIA
_____________________________________________________________
UNDER TERTIARISATION AND UNEMPLOYMENT
Maurizio Pugno
_________________________________________________________ Discussion Paper No. 4, 2000
The Discussion Paper series provides a means for circulating preliminary research results by staff of or visitors to the Department. Its purpose is to stimulate discussion prior to the publication of papers.
Requests for copies of Discussion Papers and address changes should be sent to:
dott. Paolo Maggioni Dipartimento di Economia Università degli Studi Via Inama 5
This draft: September 2000
UNDER-TERTIARISATION AND UNEMPLOYMENT
by
Maurizio Pugno*
Associate Professor of Macroeconomics,
Department of Economics, University of Trento, via Inama 5, I-38100 Trento, Italy;
• Acknowledgement: I wish to thank the participants to my seminars held in Trento and Cagliari for their comments and suggestions on a previous draft of this paper. I am particularly indebted to Carlo Borzaga for the stimulating discussion on the topic. The usual disclaimer obviously applies. The financing of my research by the Economics Department of the University of Trento and by M.U.R.S.T. is gratefully acknowledged.
SOTTO-TERZIARIZZAZIONE E DISOCCUPAZIONE
Riassunto
Il tasso di occupazione nei 15 paesi dell'EU negli ultimi due decenni, com'è noto, è molto piu' basso rispetto a quello degli Stati Uniti. Meno noto, forse, è che questa differenza è tutta ascrivibile al tasso di occupazione nei servizi, mentre quello dell'industria (e dell'agricoltura) ci è favorevole. Non solo, ma tra i servizi il tasso di occupazione di quelli finali è rimasto stazionario, mentre soltanto i servizi intermedi hanno mostrato una buona dinamica. Sembrerebbe dunque che buona parte dei servizi non sia stata in grado di interagire con gli altri settori, e in particolare con la manifattura che maggiormente è stata interessata al progresso tecnico, al fine di assorbire occupazione, creare reddito e fornire domanda.
La dimensione di questi fatti è stata messa a fuoco solo di recente, ma lo studio delle cause e dei rimedi è ancora in una fase arretrata.
Proposito di questo paper è quello di fornire un modello in grado di spiegare, in modo interconnesso, i fenomeni della sotto-terziarizzazione e della disoccupazione. Il modello è a due settori, i quali sono diversi per le tecniche adottate, uno con tecniche migliori dell'altro, mentre la loro dimensione relativa è determinata endogenamente. La presenza di rigidità nei salari permette di ottenere una disoccupazione che è influenzata dalla composizione settoriale. Inoltre, le imprese sono ipotizzate come eterogenee, e questo permette di studiare come la dimensione di ciascun settore sia dovuta al numero delle imprese piuttosto che alla loro dimensione. E' così possibile studiare anche il fenomeno della grande dispersione del settore distributivo italiano.
Tra le cause che deprimono il terziario e l'occupazione sono state prese in considerazione anzitutto un insieme di provvedimenti volti a proteggere il mercato dei servizi, e che sono invece risultati distorsivi. In secondo luogo, è stata studiata una possibile interazione fra tasso di occupazione, domanda e offerta di beni e servizi, tale per cui vengono determinate due posizioni di equilibrio, uno "basso" ed uno "alto". In tal modo potrebbero essere rappresentati i casi dell'Europa e degli Stati Uniti.
0. Introduction
The data on employment in Europe stand in sharp contrast with those in the US, not only, as is well-known, because the employment rate is lower, but also because employment in the service sector is relatively very much lower. This suggests that the problem of unemployment in Europe necessarily involves the problem of under-tertiarisation. In particular, employment in consumer services are expected to be still very sluggish in Europe, if the past trend is considered, while producer services exhibit a more dynamic and promising performance.
These facts have been recently recognised by the literature (Anxo and Storrie 2000; European Commission 1999a; McKinsey Global Institution 1994; Freeman and Schettkat 2000; Elfring 1989; Borzaga, Demozzi and Povinelli 1999). However, under-tertiarisation in Europe is not studied very much, if compared to unemployment in Europe generally, maybe because the rigidities in the labour market have focused the attention of the debate. By contrast, when the tertiary sector is studied, the rigidities in the product market, and especially the excessive regulations in the continental European market, are immediately recognised as detrimental for the sector and for the economy as whole (Sapir, Buigues and Jacquemin 1993; OECD 1991; Koefijk and Kremers 1996; Pilat 1996). In some cases, indeed, regulations and public monopolies are designed to protect employment, as if the roles of absorbing unemployment and promoting growth were distinctly assigned to services and to manufacturing respectively (Barca and Visco 1992)1. A
1
Koefijk and Kremers (1996) complain of the scarcity of studies, with respect to the US, regarding the economic costs of regulation in Europe. Even scarcer, however, are the studies on consumer services which are highly regulated: retail trade and particular
second reason behind under-tertiarisation in Europe, though excluding the Scandinavian countries, has been identified: the low participation of women in the labour market which induces a low externalisation of household services (Bettio e Villa 1998; Esping-Andersen 1999). Unfortunately, both in the case of rigidities in the market of services and in this case the analysis has been mainly remained at the empirical level2.
This paper thus proposes a model to explain under-tertiarisation in consumer services and unemployment by focusing on specific rigidities in the market of services. In fact, it intends to capture the following administrative measures: a legal barrier to entry into the service sector, a legal barrier to large service firms, a fixed cost for establishing a new business, a restraint over service product qualities. To this aim the model is somewhat elaborated by assuming heterogeneous ability of the entrepreneurs, which allows us to analyse both the heterogeneous sizes and the numbers of firms of the two sectors, manufacturing and services. Hence, changes in the productive structure of the economy imply changes in the demand for labour, and, since wages are assumed as not flexible, in unemployment. Finally, an attempt at endogenising the propensity to spend into service products is proposed by addressing to the role of women in the markets. This analysis will brings us to the case of two equilibria, one of low employment and a small service sector (under-tertiarisation), which is typical of Europe, and the other at a higher position, which is typical of the US.
classes like pharmacies, professional activities like notaries, road transports like taxis, social services like childcare and elderly care.
2
Brunello and Scaramozzino (1994), who propose a two-sector model with imperfect competition in the product market and with union’s bargaining in the labour market, is an exception.
The paper is organised as follows: section 1 provides some evidence for the relevant facts to be explained; section 2 provides the benchmark model with no rigidities in the product market; section 3 introduces examples of policies protective of services, and studies their consequences; section 4 attempts to capture the role of women in the labour market. The conclusions and the mathematical appendix end the paper.
1. The US-EU gap in tertiarisation and employment
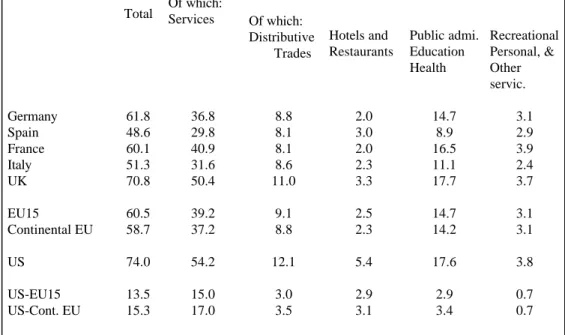
Recent data show that the US economy employs, in proportion, about one fourth more than does the European economy. More precisely, in 1997 the employment rate in the US was 74%, while in Europe it was 60.5% if the 15 EU members are considered, but in the case of continental EU members it was 58.7 (Tab.1)3. More than one third of this last gap was due to the sectors of Distributive trades (D) and Hotels and restaurants (HR), which are largely oriented to final consumption. A further 0.7 point of difference, i.e. almost 1.5 million jobs, is due to Recreational and other personal services (R). As is well-known, the public sector in the US is smaller than in Europe, since several functions are privatised. However, on the whole, Public administration, education, health and social works (P) is a larger sector in the US, by 3.4 points.
================ Tab.1 about here ================ These gaps can hardly be explained by the higher per capita GDP of the US. Citing the Engel law is not sufficient justification, since its prediction is on the composition, rather than on the overall level of employment (see
3
This gap is not a statistical artefact, at least for the Germany-US gap, as Freeman and Schettkat (2000) have shown after a close scrutinity of a special database which make comparable German and US employment data at a very fine level of disaggregation.
also European Commission 1999a). Moreover, under-tertiarisation is expected to widen if the recent trends are considered. In fact, the continental EU members have employed from 1985 to 1997 only 0.1 points more in the D plus HR sector, and 1.6 points more in the R plus P sector, whereas the US has employed 1.1 and 4.7 more respectively. The Finance and business service sector has instead grown at 1.9 and 1.5 points respectively in the two areas (European Commission 1999b:16).
These differences in the employment rates between Europe and the US seem ironic if one bears in mind that in several European countries policy measures were implemented precisely in order to protect employment. The most notable example is the restriction on establishing large stores in various countries, and especially in Italy. In fact, 83.5% of employment in Retail trade and repair services for Italy in 1995 was in micro-enterprises with fewer than 9 employees; followed by 75.3% for Spain, while the average for EU-15 was 54.2%, and the figure for the UK was 27% (Eurostat 1998:46)4.
Participation by women in the labour market is important to raise employment, and to expand the service sector. In fact, in those countries where employment rates are relatively high, the contribution of female employment rates are also relatively high. More precisely, the correlation between the two across EU-15 in 1997 is 0.94. It is interesting to note that for these recent data the correlation also indicates that a 1 point rise in the total employment rate implies an increase of 1.3 points in the female employment rate. This means that the male labour market tends to become
4
Ergas (1995) has found that the density of retail outlets in Italy and in Japan is double that required by population density and distribution across the territory, and by their ability to move, having considered the 4 biggest European countries, the US and Japan as the sample for the regression and for the simulation. Analogous conclusions are in OECD (1992) and Pellegrini (1993).
saturated before the female labour market does. Inspection of individual sectors shows that women are employed most in consumer services: 57.6% of total employment in the R sector for EU-15 in 1995, 52.6% in HR, 76.2 in Health and social works, as against 22.6% in Industry (Eurostat 1998:25).
Female participation in the labour market is also important on the demand side of the services market. Their greater participation implies that more home services are substituted by market services. This fact may justify the positive correlation between the female employment rate and the expenditure share for services by households. This is 0.39 for a sample of 11 EU countries plus the US in 1996-975. This coefficient would be higher if it considered that Denmark and Sweden achieve high female employment rates while many services are provided by the public sector. The outlier position of the US is anyway evident: it achieves 67.5% of the female employment rate and 58.4 of expenditure share in services, while the 11 European countries exhibit, on average, 56.4% and 43.8% respectively6. The trend is not
5
If the expenditure share does not include transport and communication services, the correlation coefficient is 0.49. Consistent results to these findings are obtained by Illeris (1989), who observes a negative relationship between hours of household and hours paid working in Denmark, and by Esping-Andersen (1999), who finds that married women’s employment has a significant effect on employment growth in services in France, Spain and the US.
6
Further evidence of the role of female participation in shaping the service sector is provided by a study on the dispersion of distributive trade in 7 major economies, which has found that the female participation rate in the labour force has a statistically significant negative effect, thus capturing the opportunity cost of time spent shopping (Ergas 1995). Also Freeman and Schettkat (2000) regard the substitution in household production as important in explaining the US-German gap in employment and tertiarisation.
encouraging, since the US-EU gap in the expenditure share for services widened between 1970 and 1995 (Eurostat 1998:14).
2. The benchmark model
The model proposed is essentially short-run, but it is designed to study structural features. It belongs to the category of models of heterogeneous talent (Murphy, Shleifer and Vishny 1991; Rauch 1991), where the role of entrepreneurship is central, while the role of capital is left aside. Various aspects of the model could be elaborated further, but interesting results still emerge from this simple version.
In this section, the model will be free of any rigidity in the product market of services, and with an exogenous propensity to spend on services. This is the benchmark, while the next sections will consider some variants of it.
2.1 The distribution function of ability
Let us begin with the less usual assumptions, i.e. that the individuals in the economy belong to the set of real numbers, that they are endowed with a heterogeneous entrepreneurial ability in production over the relevant period, and that they can be thus ranked smoothly and continuously. Formally this can be represented by a cumulated function as follows:
[1] A = A(E) with 0<E≤N
where N∈R+ indicates the (exogenous) number of individuals in the economy, as ranked in descending order of ability, E is the number of those individuals who have chosen to become entrepreneurs, A is the cumulated ability of the first E individuals, who are thus also the ablest. The properties
of equation [1] are: A
A'(N)=1, A''<0. Hence, A'(E) represents the ability of each individual as a function of the number of the ablest individuals. For the solution of the model with a distribution function of the Paretian type see the Appendix.
2.2 Production functions
The economy produces two goods, a manufacturing good (m) and a service good (s), according to the following microeconomic production functions:
[2] ym = T A' [lm e(wm)]a with 0<b<a<1 [3] ys = Q A' [ls]b with 0<Q<T<+∞
where y indicates output, T and Q are specific exogenous indices of efficiency, l is labour employed. The ability of each entrepreneur (A') characterises the efficiency of his firm (cf. Lucas 1978), and is generic with respect to the sector employed. The efficiency of labour is equal to 1 in the service sector, while it varies with wages in manufacturing according to the usual S-shaped function of the efficiency-wage literature (Solow 1979), and in particular with the property that e>1 at e”=0, so that maximised efficiency will be larger than 1.
Therefore, service firms differ from manufacturing firms because of more decreasing returns, which is crucial for the following analysis, lower production efficiency, and a lower (maximised) labour efficiency7.
7
Detailed empirical studies on these gaps between manufacturing and services are lacking. One of the most interesting is Pellegrini (1993), who concludes that the gap in total factor productivity in the UK is more significant for distribution, hotels and restaurants, than for transport and communications.
2.3 Firms' equilibrium
Let us assume that entrepreneurs can earn all the residual from proceeds after paying the labour cost, so that their profits can be called quasi-rents.
Let us maximise these expected profits (π) for manufacturing firms: [4]
m ml w ,
max πm where πm = ym− lm wm
and where output has unitary prices (pm=1).
From the usual first-order conditions one obtains the equilibrium values for effort and for wages. In fact:
[5] * *) ( ' *) ( m m m m m w w e w e =
which yields the equilibrium values wm* and e*. Firms’ demand for labour can thus be derived:
[6] lm*= a a a − 1 1 * ) ( ' * m w E A Te .
Let us maximise the expected profits of the service firms: [7]
s l
max πs where πs = psys− ls ws
where, note, price (ps) is exogenous to firms. Let us also assume that wages are fixed exogenously at some low level, i.e.:
[8] ws = w < ws m*.
This can be justified by a very abundant supply of labour, so that wages can reach a minimum level of reservation.
Firm’s demand for labour can thus be derived:
[9] ls*= b −b 1 1 ) ( ' s s w E A È p .
Since both lm* and ls* are declining functions in E, i.e. li*'(E)<0, it follows that the less able individuals are, the smaller the size of firms that
they are able to manage. In particular, manufacturing firms have a larger size than service firms if lm*>ls*. This condition can be written from equations [7] and [9] as follows: [10] A'(E) > ≡ − − − − b a b a b a a a b 1 1 * * m s s w Te w È p c.
Hence, the (monotonically) declining curve representing the distribution function A'(E) can be divided by an horizontal line (c) into an upper part, where manufacturing firms are larger than the service firms, and a lower part, where the reverse is the case.
2.4 The equilibrium profits of the two sectors
An individual can choose to become entrepreneur in one of the two sectors according to the maximum of the two expected profits (πm*, πs*), given that:
[11] πm*(E) = T A'(E) [lm*(E) e*]a− wm* lm*(E) [12] πs*(E) = psQ A'(E) [ls*(E)]b− w ls s*(E)
and that the maximum profits are greater than wages, as specified below. Manufacturing firms earn more or equal profits with respect to service firms if πm*≥ πs*. This condition can be written as follows, after substituting equations [7] and [9] into equations [11] and [12] respectively, and by using the definition in [10]: [13] A'(E) > c ≡ − − − − − b a b a a a b b ) 1 )( 1 ( ) 1 ( ) 1 ( * m s w w b.
Let us represent this condition as in Fig.1. The curve of the ability distribution intersects once with the horizontal line b, where the least able individual of the Em* group is indifferent to becoming entrepreneur in one of the two sectors. But for A'>b, the ablest individuals in the Em* group would choose manufacturing, since πm*>πs*, while the individuals who are
immediately less able would choose to become entrepreneurs in the service sector. Hence, all entrepreneurs would have made the best choice once Em* had been identified.
================ Fig.1 about here ================ In order to capture the fact that manufacturing firms are generally larger than service firms, except for some public utilities which more closely resemble manufacturing corporations, the following condition must hold: [14] a a b b ) 1 ( ) 1 ( * − − ≤ s m w w
so that c≤b (see Fig.1). This is not a severe restriction, since a small difference in the technological parameters like a=0.5 and b=0.4 allows manufacturing wages to be no more than 50% higher than service wages, until the other extreme case of equal wages. Therefore, the individuals who are so able as to find it convenient to become entrepreneurs in manufacturing, also run larger firms than they would if they chose to run service firms.
The number of entrepreneurs in manufacturing (Em*) varies with changes in ps. The greater ps, the higher b (and c) from [13] (and [10]), the lower Em*. This is evident from Fig.1, but also from Fig.2, which represents the two equations [11] and [12] of equilibrium profits. The higher ps the higher πs*, the lower Em*(see the Appendix for proof). Hence, we can write: [15] Em*=Em*(ps) with Em*'<0.
This is true, however, for an appropriate range of ps. Intuitively, a too high ps tends to crowd out the manufacturing sector altogether, while a too low ps tends to crowd out the service sector. To be more precise, we must also consider the constraints in the labour market, as analysed in the section 2.5.
================ Fig.2 about here ================ Determining the number of entrepreneurs in the service sector requires the equality condition between expected profits by the least able individual
who would choose entrepreneurship and his opportunity cost of being an employee in manufacturing:
[16] πs*(E) = wm*.
This can be justified by the possibility for manufacturing firms to select workers, and hence to select the ablest individuals. Therefore, condition [16] gives the total number of entrepreneurs who earn equilibrium profits (ET*), as represented in Fig.2, while entrepreneurs in the service sector is thus simply obtained:
[17] Es* = ET* − Em*
for an appropriate range of ps. It is evident from equation [12] and Fig.2 that the higher ps is, the larger the number of entrepreneurs in the service sector (Es*), because this activity becomes more convenient not only w.r.t. manufacturing entrepreneurship (reduction in Em*), but also w.r.t. working as employees (expansion of ET*). Hence, we can write:
[18] ET*=ET*(ps) with ET*'>0.
2.5 The labour market
Labour demand for workers in the two sectors is obtained by aggregating labour demand by individual firms, i.e.:
[19] Lm* =
∫
* ≡ 0 * d m E m (n) n l Lm*(Em*) with Lm1*>0 [20] Ls* =∫
* ≡ * * d T m EE ls (n) n Ls*(Em*,ET*) with Ls1*<0,
Ls2*>0.
Aggregate labour demand depends on the number of active firms with fixed wages. Labour supply (N) is not binding if it is sufficiently great at ongoing wages, i.e.:
[21] N > Em* + Es* + Lm* + Ls*.
By combining equations [15] and [19], and [18] and [20], we can write:
[22] Lm* = Lm(ps) with Lm'<0 [23] Ls* = Ls(ps) with Ls'>0.
A rise in ps makes service activity more convenient both because it improves the service/manufacturing terms of trade, and because the optimum firm’s size grows. This increases the number of service firms on both sides of the spectrum by raising LT* and by reducing Lm*. The latter effect is obviously detrimental to the manufacturing sector. The effect of ps on total employment is positive if the induced change in Em* does not excessively reduce manufacturing with respect to the gain in the service sector. A sufficient condition for this result is that at Em* the two kinds of firms are of equal size, i.e. that the smallest manufacturing firm is equal to the largest service firm. This requires the sign of equality in condition [14]. Otherwise, in the case of wm*=w , the technological difference between the twos sectors must not be too large (see the Appendix). From these observations on the parameters, it is reasonable to expect that a rise in service price will induce a rise in total employment.
We are now in a position to be more precise about the bounds on the size of the two sectors for different prices ps. A rise in ps expands service and total employment and reduces manufacturing employment, until, for a certain level labelled p , Es m* and hence Lm* become zero. This is true if labour supply is not binding, as would be seen in Fig.1 if b were brought up to the a level for a sufficiently high ps. In this case, only the service sector would survive. If labour supply were binding, then it could fix Em* at some level for some appropriate level for ps<p , but this case will no longer bes considered here. Conversely, below a sufficiently low level of ps, labelled as
s
could be seen in the Fig.2 if πs* were sufficiently lowered)8. In this case total employment is at the minimum.
2.6 The relative supply curve of services
Having determined the sizes of the two sectors in terms of the number of firms on the basis of equilibrium profits, we can obtain the sizes in terms of output, and define the relative supply curve of services.
Output in the two sectors is given by aggregating the output of individual firms, i.e.:
[24] Ym* =
∫
* 0 '( )[ * *] d m E m (n)e n l n TA a [25] Ys* =∫
* * '( )[ * ] d T m E E ÈA n ls (n) n b .The relative output of services is thus:
[26] n n A n n A w Te w È p Y Y s m s T s m p E p E p E m s s m s d ) ( ' d ) ( ' * * * * 1 1 ) ( * 0 1 1 ) ( * ) ( * 1 1 1 1 a b a a a b b b a b − − − −
∫
∫
=having substituted equations [7] and [9], and [15] and [18] into [24] and [25]. This can be called the relative supply curve of services, because it relates service price to the relative output of services. As can be easily seen, service price positively affects the supply of services through two channels: by expanding the size of service firms (the first term on the r.h.s.), and by increasing their number drawing on manufacturing entrepreneurs (reduction in Em*) and on workers (increase in ET*). The curve can be depicted as in Fig.3.
8
Note that at this point the level of b in Fig.1 would be anyway greater than or equal to 1.
================ Fig.3 about here ================ By using equations [19] and [20], it can be obtained from [26] that: [27] * * * * * m s s s m m s Y Y p w w L L a b =
so that changes in the relative supply of services imply proportional changes in relative employment in the two sectors, for any given price.
A rising supply curve of services may be surprising, since labour is not a scarce resource by equation [21], and firms can freely enter and leave the markets of goods and services. The scarce resource is, in fact, entrepreneurial ability, and it is, moreover, unevenly distributed and indivisible. A rise in the service price extracts that ability from workers and from manufacturing, so that more service output is available.
2.7 Relative demand and equilibrium in the market of services
In order to find equilibrium prices and quantities in the market of services, thus closing the model, we need the demand side.
A simple utility function for the economy’s individuals can be assumed, since capital is absent and intertemporal preferences are not necessary. A CES function is in fact assumed9:
[28] U =
[
l r l r]
r 1 ) 1 ( − − − + − m s D D with 0≤l≤1 and r>-1.The equilibrium for consumers requires relative prices equal to the marginal rate of substitution, being Ym+Ysps≥Dm+Dsps the budget constraint, i.e.: [29] ps = ) 1 ( 1 ' ' r l l − + − = m s D D D D U U m s . 9
The elasticity of substitution between demand for services (Ds) and demand for manufacturing products (Dm) is, as usual, s=1/(1+r)>0. Since, by definition, the demand elasticities are
−εm= m m m m p p D D d d and −εs= s s s s p p D D d d , then s= s m s m m s m s p p p p D D D D d d = 1 d d d − − m m s s s m m m p p p p p p e e
. Hence, for constant pm, then s=εs. From this condition
and from equation [29] the relative demand for services can be written thus:
[30] s s s m s p D D e e l l − − = 1 .
In Fig.3 this appears as the declining branch of an hyperbole with the axes as asymptotes.
Therefore, the demand curve and the supply curve intersect once, thus yielding, for * * * * m s m s D D Y Y
= , the equilibrium relative price and quantity: ps*,
(Ys/Ym)*. Having determined ps*, equations [7], [9], [11] and [12] can be solved for lm*, ls*, πm* and πs* respectively, and hence all the other unknowns.
Note that by considering equation [27], if the relative supply curve lies at a higher position, relative supply and relative employment are proportionally lower if εs=+∞, thus ps remaining constant, and that relative employment rises proportionally to ps if εs=0, thus (Ys/Ym)* remaining constant. Let us finally observe that a rise in l or in εs increases ps*, as is evident from Fig.3, and hence, from the discussion in the previous section, not only does service employment increase but total employment rises as
well. An attempt to endogenise l will be made in section 4, while the interesting values for εs are around unity or more, as suggested by the literature10.
3. Does protected services protect service employment?
Since service activity is more sheltered from international competition than manufacturing activity, it has been regulated in domestic markets by various measures and to different degrees. Since services include very different kinds of products, due to both market structure and methods of production, very different protecting measures have been applied. The simple model of the previous section obviously cannot consider them in detail. However, it is possible to capture the essence of these measures by four major examples, which can refer to specific parameters of the model. These are: a legal barrier to entry in the service sector, a legal barrier to large service firms, a fixed cost for establishing a new business, a restraint over service product qualities.
3.1 The case of a legal barrier to entry
A simple and widely used method to protect services is to fix an administrative barrier to entry into the market of service products. Restrictive measures of this kind have been implemented in Italy and France for the distributive trade, and in Italy for professional services and for the urban
10
Appelbaum and Schettkat (1999) argue for an elastic price elasticity of services, since it is a less saturated market than manufacturing. Hence, together with a large income elasticity for services, as Engel's Law would predict (Fuchs 1968), they are able to explain Baumol's stylised fact of long run constant share of service output (Baumol et al. 1989). Bollino and Rossi (1987) confirm that service prices are elastic for Italy.
transportation of persons (OECD 1991; 1992). One reason cited for these measures is that their purpose is to guarantee some minimum return for the existing activities, so that the claim is that they protect employment. However, the results from our general equilibrium model sharply contrast with this claim.
In order to capture the barrier to entry into the service market with the model at hand, let us assume the following restriction:
[31] E~s < Es* with E~s>0
where E~sis the number of service firms, which is fixed exogenously by administrative measures. Let us then label as p~ that particular price whichs makes the profit curve for services (equation [12]) exactly define E~s=Es*11. Hence, for any given price greater than p~ the supply of services is smallers and the relative supply curve is at a higher position than that depicted in Fig.3, thus generally raising equilibrium price (ps*) and reducing equilibrium relative supply (Ys/Ym)*. If the ablest service entrepreneurs are also the ablest to be included in the E~s group, then the higher position of the curve will be due to a E~T=Em*+E~s smaller than ET* in the equation [26], as depicted in Fig.4. In the case of a constant ps*, which may be due to a shift in the demand curve, or to εs=+∞, the service sector shrinks, thus reducing service and total employment, manufacturing remaining unchanged12. In the case of higher ps*, or εs<+∞, and hence higher ps*, the E~s group shifts leftward as indicated in Fig.4, so that manufacturing shrinks, and services enlarge firms' size. In particular, if εs=1, then expenditure ps*Ys* remains constant. This
11
This would be clear by substituting equations [15] and [18] into [17].
12
This result is also obtained if E~s conversely included the least able service entrepreneurs, and equality in condition [14] prevails.
implies that, in presence of the barrier, service output, service and total employment must be lower13.
================ Fig.4 about here ================ This case also allows us to briefly discuss the problem of fixing ws. The usual case is to assume that ws is sensitive to the labour market disequilibrium, insofar as it approaches a possible minimum like the reservation wage. However, in this case of a barrier to entry pure rent arises as given by ps*(E~T)−wm∗ for every service firm, and ws can be sensitive to rent sharing by rising, despite excess labour supply. Moreover, if ws is fixed at a higher level than manufacturing wages, these may tend to rise as well, thus reducing manufacturing output and employment. This is an important analytical result since it shows that the distortions in the product market may call for other distortions in the labour market.
Therefore, the macroeconomic effects on output and employment exerted by the barrier to entry are negative, essentially because higher service prices distort the allocation of entrepreneurship away from the most efficient sector.
3.2 The case of a legal barrier to large firms
Another administrative measure – often combined with the previous one – is that of discouraging large firms in the service sector14. This measure has been effectively applied in distributive trades in Italy and in France, with the effect of maintaining a very dispersed structure. One reason for this
13
Service employment must be lower because, from equation [27], ps*Ys* is constant, while Lm*/Ym* is lower.
14
This result also arises if the most recent information technologies, which effectively counteract decreasing returns, are not encouraged to be implemented into the service sector.
restraint is that large firms and improved efficiency would destroy employment because, the argument runs, the higher productivity would push the smallest firms out of the market. This reasoning can be properly checked by the model.
Let us capture the measures against large firms in the service sector by assuming the following restriction:
[32] ls ≤ls* where ls ≡ls*(Em*+E ) and 0<s E <Es s*.
The profit curve for services thus appears kinked at (Em*+E ) as ins Fig.5. This reduces service output, thus shifting the relative supply curve upwards. In the case of constant ps* (or εs=+∞), the service sector shrinks, but the manufacturing sector expands. If the enterprises that pass to manufacturing do not greatly change in size, i.e. condition [14] is read as being of little or no inequality, then also total employment diminishes. A higher equilibrium price raises the convenience of services, and in particular induces the ablest employees to become entrepreneurs of small size firms. In particular, if εs=1, the rise in ps* is not yet able to enlarge service output to the benchmark level of no barrier, so that manufacturing firms remain more numerous than Em*, but it is able to obtain more employment in the service sector than the benchmark level15. With a larger manufacturing output, equation [27] implies a lower Ls*/Lm*.
================ Fig.5 about here ================ Therefore, the legal barrier to large firms has the effect of expanding service employment by raising prices and by activating small units, although it is not able to raise relative service employment. The higher prices have the role of maintaining more employment by redistributing real resources from
15
In fact, at εs=1 the manufacturing sector includes less efficient firms, thus lowering Ym*/Lm*, while ps*Ys* is constant, so that Ls* is higher, as derived from equation [27].
profits in the manufacturing sector through expenditure on service products to service employment, which are spread over a large number of small units.
If this kind of measure is combined with the previous measure of raising a barrier to entry, then the service price must be even higher, while employment in both services and manufacturing may diminish.
3.3 The case of fixed costs of establishing a new business
Regulations in Europe, and especially in continental Europe, have been recently recognised as significant transaction costs over production. In particular, regulations on establishing new businesses are particularly restrictive in Germany, the Netherlands, Belgium, followed by France, Italy, Denmark and Greece (Koefijk and Kremers 1996). These measures, and all those measures that bear down proportionally more on small rather than large firms can be captured by a fixed cost over production for each firm, so that profits in both sectors must be reduced by a fixed amount. The two profits curves in Fig.2 will thus lie in a downward position, with the effect of reducing ET*, while Em* remains the same. Again, the relative supply curve of services will be in an upward position, thus raising prices and reducing services on equilibrium. More precisely, εs=1 implies a lower Ys* and, since the higher ps* makes ps* more attractive, a lower Ym*, and thus Lm*. For equation [27] Ls* is lower, and thus LT*.
Therefore, a fixed cost for every firm damages service employment or manufacturing employment more depending on the possibility of its transfer onto service prices.
3.4 The case of restraints of new qualities of services
In various European countries, especially in the Netherlands, Germany, Denmark and Italy, shop opening hours and shop locations are administratively restricted, thus hindering a more flexible service to
consumers. The production of other consumer services in continental Europe are discouraged, if not impeded, by restrictive regulations or monopolistic positions of the public sector, like childcare and care of the elderly.
An overall restraint in the quality of services can be captured by the model simply by assuming a lower level of l in the demand function, i.e. a lower propensity to spend on service goods with respect to manufacturing goods. It is evident what the model predicts in this case: a lower service price, which is however paid for a worse quality, lower employment both in services and in the economy as a whole. If this case is combined with one of the previous cases where the relative supply curve lies at a higher position, the overall effect will be the tendency toward low total employment and service employment, and toward low service quality for the same prices.
4. Endogenising the propensity to spend into services
This section will show how the model can be extended by endogenising one key parameter, l, the propensity to spend into service products. The proposal can be considerably refined, but this sketch is already able to capture a well-known fact which plays an important role in under-tertiarisation on the demand side of the product market, and which can be effectively matched with the aspects on the supply side analysed in the previous section. This fact is the low participation of women in the labour market, which is particularly characteristic of Mediterranean Europe.
Let us recall two related stylised facts. First, as briefly shown in section 1, the relationship between the total employment rate and the female employment rate is not simply close and positive, it is also non-linear. Recently, European countries have experienced an acceleration in the female employment rate, while the US displays a small gap between the two rates.
Hence, the labour market for men, for various reasons16, becomes saturated before that for women. The secondly, it is usually recognised that, within the traditional division of labour in the family, women work as the best substitutes for marketed services. Hence, it may be expected that for middle-range rates of employment, the contribution of female rates grow increasingly higher, and consequently also the expenditure on consumer services. It might also be expected that, for high rates of employment, the contribution of female rates slow as they approach unity, and, additionally, that the expenditure share in services tends to stop increasing.
Therefore, these facts can be synthesised into an S-shaped relationship as depicted in Fig.6 and specified as follows:
[31] l = l(L T*/N)
with the following properties: l’>0; l”>0 for l<lflex, and l”<0 for l>lflex, being l(0)<lflex <l(1); l(0)>0 and l(1)<1, thus assuming some amount of both goods in the consumption basket for every employment rate.
================ Fig.6 about here ================ From the relative demand for (equation [26]) and relative supply of services (equation [30]), and from the discussion on the positive effects of service prices on total employment in the previous section, one can derive a monotonic positive relationship which links LT* to l, i.e.:
[32] LT* / N = LT*(l)
16
On the demand side, firm usually prefer to employ men rather than women, on the supply side, women may prefer to postpone work until after maternity (cf. Rubery et al. 1998).
where, for l→0 then LT*→Lm*, and for l→1 then LT*→Ls*17. Fig.6 depicts the possibility of three intersections between the two curves representing equations [31] and [32]. The extreme points of intersection are of stable equilibrium. In fact, a very low starting value of LT*, for example, would mean particularly less employment for women, and thus a reduced demand for services. This is however sufficient to stimulate, though at a decreasing rate, more service output, which particularly employs women. An analogous reasoning applies to the other starting values of LT*.
It is tempting to interpret the “low” equilibrium as representing the case of continental Europe, and the “high” equilibrium the case of the US. The distortions in entrepreneurship analysed in previous sections 3.1 and 3.3 induce the LT*(l) curve in Fig.6 to lie at a higher position, and the restriction in quality of services of section 3.4 induces the l(LT*/N) curve to lie at a lower position. Therefore, not only can adequate liberalisation policies in continental Europe increase employment, and the production of services in particular, but they can also trigger a further expansionary process, if these policies make the two curves intersect only at the high position.
5. Conclusions
The literature on the unemployment gap between Europe and the US is huge; yet little attention is paid to the fact that the gap would be substantially reduced if consumer services in Europe were raised by the US proportion. Two reasons account for this European under-tertiarisation: excessive regulation and low externalisation of household services. The model set out
17
Total working age population may be insufficient, even if completely employed in the service sector, for producing the services required, so that for LT* =Ls*=N then
in this paper studies how these two explanations work, and how they interact.
There are three key assumptions of the model: heterogeneous entrepreneurial ability, inflexible wages, and more decreasing returns in the service sector with respect to manufacturing. The first assumption allows distinct determination of the equilibrium level of the number and size of firms. The second assumption is useful to allow for equilibrium unemployment, the level of which is affected by the proportion of the two sectors, which is determined by the third assumption.
Excessive regulation in the European countries is distinguished into four examples, which refer to specific parameters or variables of the model. First, the legal barriers to entry into the service sector are captured by fixing the number of service enterprises at a lower level than the equilibrium level. Second, the legal barriers to large service firms are raised by fixing a maximum size for service firms. Third, the costs of establishing a new business are captured by a fixed cost per firm. Fourth, the restraint over service product qualities is captured by a lower propensity to spend on service products. Three out of the four measures have the effect of causing a deterioration in the employment performance of both the service sector and the economy as a whole, if a unitary or elastic service price elasticity is considered. Only the barriers to large firms are able to increase employment by establishing new very small businesses, but at the cost of particularly raising prices. The case of the barriers to entry highlights the problem that the rent arising tempts employees to increase wages, thus hindering the possible adjustment of the labour market through flexible wages. Therefore, an explanation of the US-EU gap in employment can be found in the regulatory rigidities in the market of services even if rigidities in the labour market were the same in the two areas. But the mechanism of rent sharing can also explain a different rigidity in wages.
Another and complementary explanation can be found in the role of female participation in the labour market, which is captured by the model by endogenising the propensity to spend on service products. In fact, if this positively depends on the female employment rate, then it also depends on the total employment rate. This relationship can thus be matched with the reverse one already obtained by the model, which has the employment rate positively depending on the propensity to spend on services. One or more points of equilibrium may arise as intersections between the two relationships. The interesting outcome of two stable equilibria is more likely to arise if the propensity to spend on services positively depends on female employment rates until a point of saturation of the service market has been reached, and if female employment rates contribute, first, to a lagging behind of the total employment rate, when the labour market for men is far from saturation, and then to its acceleration. The outcome of two equilibria is interesting because the equilibrium of low employment and under-tertiarisation can effectively represent the European case, while the other “better” equilibrium can represent the US.
A general policy implication to be drawn from this analysis is that closer attention should be paid to the regulations of the product market of consumer services. Some reduction in these regulations seems advisable, but an incentive for new qualities in services could also be interesting. In the case of distributive trades a high dispersion of units should be discouraged in order to reduce the price level. These measures may fuel the virtuous circle from a higher demand for services to higher supply of services, and thus to women and total employment, and back to higher demand (cf. Boitani and Pellegrini 1997).
Mathematical appendix
Let us assume an explicit cumulated distribution function of ability:
[1.A] A = 1 1 1 0 1 g g g − − E with 0<g0<+∞ and 0<g1<1
with derivative as: [2.A] A' = g0 E−g1
which is a distribution function of the Paretian type. This is a handy and familiar distribution, although some caution is needed in interpreting the ability of the ablest individual.
The condition lm*>ls* can thus be written:
[10.A] E < ( ) 1 ) ( 1 1 0 1 1 1 * * g a b a b a g b a g a b g − − − − s s m w È p w Te .
The condition πm*≥ πs* implies:
s m s m m w l A p w l A Te a a *Q ' *b * * ' * − ≥ lm*−ls* m s w w . Being: a a − = 1 * ' m m l w TA , and b Q −b = 1 * ' s s s l w A p
from equations [7] and [9], then:
b a * * s m l l − * m s w w ≥ lm*−ls* * m s w w i.e. a a b b / ) 1 ( / ) 1 ( * * * − − ≥ m s s m w w l l and hence: [13.A] E ≤ ) ( ) 1 )( 1 ( 1 / ) 1 ( / ) 1 ( * b a g b a a a b b − − − − − m s w w ( ) 1 ) ( 1 1 0 1 1 1 * * g a b a b a g b a g a b g − − − − s s m w È p w Te
where for the sign of equality, the equilibrium value Em* is obtained, and for E<Em* manufacturing firms are larger than service firms, while for E>Em* service firms are larger than manufacturing firms, though remaining smaller than both kinds of firms with respect to the previous case of E<Em*. If
a a b b ) 1 ( ) 1 ( * − − < s m w w
, the only different result is that, for E>Em*, condition
[10.A] can be applied, i.e. the ablest entrepreneurs in the service sector run smaller firms than manufacturing sector, though they are preferred because of greater profits.
From [13.A] it can be derived that: [14'.A] s m p E ∂ ∂ * = ) ( 1 1a b g a − − − s m p E * <0.
The equilibrium condition for ET (eq.[15]) implies that:
[15.A] ET* = 1 1 1 1 0 * 1 g b g b b b Q g − − m s s s w w w p
so that it can be derived that: [15'.A] s T p E ∂ ∂ * = 1 1 g − s T p E * >0.
Sectoral labour demand can be obtained in explicit forms:
[19.A] Lm* = −
∫
− − * 0 1 1 1 d * * 1 m E m o n n w Te a a a ga g [20.A] Ls* =∫
− − − * * 1 1 1 d 1 T m E E s s o n n w p b g b b Q gso that, for manufacturing sector, it can be derived that:
[19'.A] * * m m E L ∂ ∂ = a g a a a g − − − 1 * 1 1 1 * * m m o E w Te = lm*(Em*) > 0
and, for the service sector, that:
[20'.A] * * m s E L ∂ ∂ = [ ] b g b b Q g − − − − 1 1 1 0 * 1 m s s E w p = − ls*(Em*) < 0
[20''.A] * * T s E L ∂ ∂ = b g b b Q g − − − 1 1 1 0 1 * T s s E w p = ls*(ET*) > 0.
It is now relevant to study how a change in ps changes LT*, which is the sum of Ls* and Lm*. In fact, a rise in ps displays four effects on LT*. It increases the size of service firms, it increases their number by raising ET* and by reducing Em*, it reduces manufacturing firms by reducing Em*. In formulae: s T p L ∂ ∂ * = b − 1 1 s s p L * + 1 1 g s T p E * ls*(ET*) + ) ( 1 1 a b g a − − s m p E *[ ] *) ( * *) ( * m m m s E l E l − .
The first three effects overcome the fourth, if the difference in the last term, which is negative, is not too large, i.e. if
s m w w * is close to a a b b ) 1 ( ) 1 ( − − .
References
Anxo D and D Storrie (2000) (eds.) The Job Creation Potential of the Service sector in Europe, Centre for European Labour Market Studies, Sweden (mimeo)
Appelbaum E and R Schettkat (1999) Are prices unimportant? The changing structure of the industrialised economies, Journal of Post Keynesian Economics, 21(3), 385-98
Barca F and I Visco (1992) L’economia italiana nella prospettiva europea: terziario protetto e dinamica dei redditi nominali, Temi di discussione, Banca d’Italia, no.175, luglio
Baumol WJ, SAB Blackman, and EN Wolff (1989) Productivity and American Leadership, Cambridge:MIT Press
Bettio F and P Villa (1998) A mediterranean perspective on the breackdown of the relationship between participation and fertility, Cambridge Journal of Economics, 22, 137-171
Boitani A and G Pellegrini (1997) Lo sviluppo di nuove attività produttive: i servizi, in L Ciocca (ed.) Disoccupazione di fine secolo, Boringhieri, Torino, 203-267
Bollino CA and N Rossi (1987) L’analisi della domanda in Italia, Studi e Informazioni, no.4
Borzaga C, M Demozzi and F Povinelli (1999) L’evoluzione settoriale dell’occupazione e le performance occupazionali: un’analisi comparata di lungo periodo, Università di Trento (mimeo)
Brunello G and P Scaramozzino (1992) Mark-ups in the product and in the labour markets: the Baumol model revisited, University of Venice, Discussion Paper, no.92-13
Elfring T (1989) New evidence on the expansion of service emplyment in advanced economies, Review of Income and Wealth, 35(4), 409-440 Ergas H (1995) Structure and change in distribution system: an analysis of
seven OECD member countries, in E Felli, FC Rosati and G Tria (eds) The service sector: productivity and growth, Heidelberg:Springer, pp.177-242
Esping-Andersen G (1999) Social foundations of postindustriual economies, Oxford University Press, Oxford
European Commission (1999a) Employment in Europe, Bruxelles
European Commission (1999b) Employment performance in the member states, Bruxelles
Eurostat (1998) Services in Europe. Data 1995, Luxembourg
Freeman RB and R Schettkat (2000) Differentials in service industry employment growth: Germany and the US in the comparable German American structural database, Report prepared for European Commission (mimeo)
Fuchs V (1968) The service economy, New York:Columbia Univesrity Press Illeris S (1989) Services and regions in Europe, Aldershot:Avebury
Koefijk K and J Kremers (1996) Marketing opening, regulation and growth in Europe, Economic Policy. An European Forum, 0(23), 443-60 Lucas RE (1988) On the mechanics of economic development, Journal of
Monetary Economics, 22, 3-42
Lucas, RE (1978) On the Size Distribution of Business Firms. Bell Journal of Economics, 9, 508-523.
McKinsey Global Institution (1994) Employment performance, Washington D.C.
Murphy KM, A Shleifer and RW Vishny (1991). The Allocation of Talent: Implications for Growth, Quarterly Journal of Economics, 106(May), 503-530.
OECD (1991) Economic survey. Italy, Paris
OECD (1992) Structure and change in distribution system, ECU/CPEWP (92)7, Sept.
Pellegrini (1993) La produttività nei servizi destinabili alla vendita: nuove evidenze per un vecchio problema, Temi di discussione, Banca d’Italia, no.212, nov.
Pilat D (1996) Competition, productivity and efficiency, OECD Studies, 0(27), 108-46
Rauch JE (1991). Modelling the Informal Sector Formally, Journal of Development Economics, 35, 33-47
Rubery J, M Smith, C Fagan and D Grimshaw (1998) Women and European Employment, Routledge, London
Sapir A, P Buigues and A Jacquemin (1993) European competition policy in manufacturing and services: a two-speed approach?, Oxford Review of Economic Policy, 9(2), 113-32
Solow (1979) Another possible source of wage stickiness, Journal of Macroeconomics, vol.1, 79-82
TABLE AND FIGURES
Tab.1 Employment rates in 1997 in Europe and selected EU members, and in the US Employment over working age populaton
Total Of which:Services
Of which: Distributive Trades Hotels and Restaurants Public admi. Education Health Recreational Personal, & Other servic. Germany Spain France Italy UK EU15 Continental EU US US-EU15 US-Cont. EU 61.8 48.6 60.1 51.3 70.8 60.5 58.7 74.0 13.5 15.3 36.8 29.8 40.9 31.6 50.4 39.2 37.2 54.2 15.0 17.0 8.8 8.1 8.1 8.6 11.0 9.1 8.8 12.1 3.0 3.5 2.0 3.0 2.0 2.3 3.3 2.5 2.3 5.4 2.9 3.1 14.7 8.9 16.5 11.1 17.7 14.7 14.2 17.6 2.9 3.4 3.1 2.9 3.9 2.4 3.7 3.1 3.1 3.8 0.7 0.7
Source : European Commission (1999b) Employment performance in the member states, Bruxelles, tabb. 1,2,3
0
E
c
b
a
A'(E)
E*
(ranked)1
mN
Fig. 1.0
E
Tw*
E*
mE*
T π∗ π∗ π∗ m s Fig. 2.0
Y*
p
p
_
_
Y*
smsupply curve
s sp*
sdemand curve
sY *
mY
( )
Fig. 3.0
E
E*
T π∗ π∗ π∗ m sE*
mE*
T Fig. 4.0
E*
E
m π∗ π∗ π∗ m sE*+E
m sE*
T Fig. 5.0 s L */N λ m L */N T L */N 1 1 λ=λ( ) (λ) L */N L */N=L* T T T Fig. 6.
Elenco dei papers del Dipartimento di Economia
1989. 1. Knowledge and Prediction of Economic Behaviour: Towards A Constructivist Approach. by Roberto Tamborini.
1989. 2. Export Stabilization and Optimal Currency Baskets: the Case of Latin AmericanCountries. by Renzo G.Avesani Giampiero M. Gallo and Peter Pauly.
1989. 3. Quali garanzie per i sottoscrittori di titoli di Stato? Una rilettura del rapporto della Commissione Economica dell'Assemblea Costituente di Franco Spinelli e Danilo Vismara. (What Guarantees to the Treasury Bill Holders? The Report of the Assemblea Costituente Economic
Commission Reconsidered by Franco Spinelli and Danilo Vismara.)
1989. 4. L'intervento pubblico nell'economia della "Venezia Tridentina" durante l'immediato dopoguerra
di Angelo Moioli.
(The Public Intervention in "Venezia Tridentina" Economy in the First War Aftermath by Angelo Moioli.)
1989. 5. L'economia lombarda verso la maturità dell'equilibrio agricolo-commerciale durante l'etàdelle riforme di Angelo Moioli.
(The Lombard Economy Towards the Agriculture-Trade Equilibrium in the Reform Age by Angelo Moioli.)
1989. 6. L'identificazione delle allocazioni dei fattori produttivi con il duale. di Quirino Paris e di Luciano Pilati.
(Identification of Factor Allocations Through the Dual Approach by Quirino Paris and Luciano Pilati.)
1990. 1. Le scelte organizzative e localizzative dell'amministrazione postale: un modello intrpretativo.di Gianfranco Cerea.
(The Post Service's Organizational and Locational Choices: An Interpretative Model by Gianfranco Cerea.)
1990. 2. Towards a Consistent Characterization of the Financial Economy. by Roberto Tamborini.
1990. 3. Nuova macroeconomia classica ed equilibrio economico generale: considerazioni sulla pretesa matrice walrasiana della N.M.C. di Giuseppe Chirichiello.
(New Classical Macroeconomics and General Equilibrium: Some Notes on the Alleged Walrasian Matrix of the N.C.M.by Giuseppe Chirichiello.)
1990. 4. Exchange Rate Changes and Price Determination in Polypolistic Markets. by Roberto Tamborini.
1990. 5. Congestione urbana e politiche del traffico. Un'analisi economica di Giuseppe Folloni e Gianluigi Gorla.
(Urban Congestion and Traffic Policy. An Economic Analysis by Giuseppe Folloni and Gianluigi Gorla.)
1990. 6. Il ruolo della qualità nella domanda di servizi pubblici. Un metodo di analisi empirica di Luigi Mittone.
(The Role of Quality in the Demand for Public Services. A Methodology for Empirical Analysis by Luigi Mittone.)
1991. 1. Consumer Behaviour under Conditions of Incomplete Information on Quality: a Note by Pilati Luciano and Giuseppe Ricci.
1991. 2. Current Account and Budget Deficit in an Interdependent World by Luigi Bosco.
(Consumer Choice, Unknown Quality and Bounded Rationality by Luigi Mittone and Roberto Tamborini.)
1991. 4. Jumping in the Band: Undeclared Intervention Thresholds in a Target Zone by Renzo G. Avesani and Giampiero M. Gallo.
1991. 5 The World Tranfer Problem. Capital Flows and the Adjustment of Payments by Roberto Tamborini.
1992.1 Can People Learn Rational Expectations? An Ecological Approach by Pier Luigi Sacco.
1992.2 On Cash Dividends as a Social Institution by Luca Beltrametti.
1992.3 Politica tariffaria e politica informativa nell'offerta di servizi pubblici di Luigi Mittone (Pricing and Information Policy in the Supply of Public Services by Luigi Mittone.)
1992.4 Technological Change, Technological Systems, Factors of Productionby Gilberto Antonelli and Giovanni Pegoretti.
1992.5 Note in tema di progresso tecnico di Geremia Gios e Claudio Miglierina. (Notes on Technical Progress, by Geremia Gios and Claudio Miglierina).
1992.6 Deflation in Input Output Tables by Giuseppe Folloni and Claudio Miglierina.
1992.7 Riduzione della complessità decisionale: politiche normative e produzione di informazione di Luigi Mittone
1992.8 Single Market Emu and Widening. Responses to Three Institutional Shocks in the European Community by Pier Carlo Padoan and Marcello Pericoli
1993.1 La tutela dei soggetti "privi di mezzi": Criteri e procedure per la valutazione della condizione economica di Gianfranco Cerea
(Public policies for the poor: criteria and procedures for a novel means test by Gianfranco Cerea )
1993.2 La tutela dei soggetti "privi di mezzi": un modello matematico per la rappresentazione della condizione economica di Wolfgang J. Irler
(Public policies for the poor: a mathematical model for a novel means test by Wolfgang J.Irler)
1993.3 Quasi-markets and Uncertainty: the Case of General Proctice Service by Luigi Mittone
1993.4 Aggregation of Individual Demand Functions and Convergence to Walrasian Equilibria by Dario Paternoster
1993.5 A Learning Experiment with Classifier System: the Determinants of the Dollar-Mark Exchange Rate by Luca Beltrametti, Luigi Marengo and Roberto Tamborini
1993.6 Alcune considerazioni sui paesi a sviluppo recente di Silvio Goglio (Latecomer Countries: Evidence and Comments by Silvio Goglio)
1993.7 Italia ed Europa: note sulla crisi dello SME di Luigi Bosco ( Italy and Europe: Notes on the Crisis of the EMS by Luigi Bosco)
1993.8 Un contributo all'analisi del mutamento strutturale nei modelli input-output di Gabriella Berloffa (Measuring Structural Change in Input-Output Models: a Contribution by Gabriella Berloffa)