1 Analytical Methods, 2016; 8: 7873-7885
A method for the measurement of lactate, glycerol and fatty acids production from
14C-glucose in primary cultures of rat epididymal adipocytes
Ana Cecilia Ho-Palma1, Floriana Rotondo1,2, María del Mar Romero1,2,3, Serena Memmolo1, Xavier Remesar1,2,3, José Antonio Fernández-López1,2,3 and Marià Alemany1,2,3.4
1 Department of Biochemistry and Molecular Biomedicine, Faculty of Biology University of Barcelona, Barcelona, Spain 2 Institute of Biomedicine, University of Barcelona, Barcelona, Spain
3 CIBER-OBN Research Net, Barcelona, Spain
4 Author for correspondence
Dr. M. Alemany; Department of Biochemistry and Molecular Biomedicine, Faculty of Biology, University of Barcelona. Av. Diagonal, 643; 08028 Barcelona, Spain; Tel. 34934034606; e-mail; [email protected]
ABSTRACT
We developed a method for the analysis of the main metabolic products of utilization of glucose by isolated adipocytes. They were incubated 24 h with 14C-glucose. The final label distribution and cold levels of medium glucose,
lactate and glycerol were estimated. Medium lactate was extracted using ion-exchange resin minicolumns prepared with centrifugation-filtering tubes in which the filter was substituted by the resin. This allowed complete washings using only 0.2 mL. Repeated washings allowed for complete recovery of fractions with low volumes passing through or retained (and eluted), which allowed precise counting and sufficient sample for further analyses. Lactate was separated from glucose and glycerol; glucose was then separated by oxidizing it to gluconate with glucose oxidase, and glycerol was separated in parallel by phosphorylation with ATP and glycerol kinase. Cells' lipid was extracted with ether and saponified. Glycerides-glycerol and fatty acids (from the soaps) were counted separately. The complete analysis of cells incubated with labelled glucose resulted in about half of the glucose metabolized in 24 h, 2/3rds of the incorporated glucose label was found as lactate, 14 % as free glycerol. Their specific activities per carbon were the same as that of glucose. Production of fatty acids took about 5 % of the label incorporated, a similar amount to that of glycerides-glycerol and estimated carbon dioxide. The procedure described is versatile enough to be used under experimental conditions, with a high degree or repeatability and with only about 3 % of the label not accounted for.
Key words: Adipocyte; glycolysis; lactate; glycerol; lipogenesis; micro ion-exchange columns; quantitative label distribution analysis
INTRODUCTION
The application of quantitative factors in the analysis of metabolic pathways allows a better understanding of main substrate partition, energy handling and inter-organ cooperation, both under physiological and pathological conditions 1, 2. Most of
these studies imply the tracing of 14C and 3H-labelled
substrates 3, 4, more recently substituted (in part) by
stable isotopes 5. The concurring availability of new
powerful analytical techniques, largely based on mass spectrometry 6, and the extended, albeit unjustified,
assumption to consider that our knowledge of the main metabolic pathways and their bulk regulation and operation are already well known, has certainly decreased the use of tracer techniques using radioactive labelled compounds. In any case, 14
C-labelled substrates remain the best option for studies of metabolic interconversion in which small amounts of material, and the absence of environmental control or major ethical constraints, allow their specific utilization.
White adipose tissue (WAT) is a disperse organ 7,
distributed in a number of locations in which its basic energy storage activity 8 is complemented by many other
physiological functions 9-11. In any case, its main role is
to contribute to the defense of energy homoeostasis, helping to control glucose 12, lipid 13, and amino acid 14
metabolism overall, sharing a large part of the control of whole body energy availability 15, but acting also as a
platform for immune system protection and regeneration
16, 17. The complex (and varying) mixture of cell types in
WAT sites largely determines and modulates these functions as part of its protean adaptability 16, 18.
Most of WAT volume corresponds to a relatively small number of adipocytes. The rest of cells (stromal) is made up of immune system, stem, blood, endothelial, and other types of cells 19, 20, which often play critical
functions under conditions of inflammation and maintenance of energy homoeostasis 21, 22. Adipocytes,
despite their small numbers but large volumes most of which is fat, have been intensely studied as the most
2
"representative" cells of WAT 23. To clarify their
metabolic abilities, they are often isolated from WAT masses and studied in primary 24 or immortalized 25 cell
cultures. The information obtained is often taken as directly representative of WAT in vivo, in spite of the large number of factors that are known to counter this simplistic approach 26, 27.
Many studies on adipocytes have been done using standard murine cell lines, as we recently did, finding that, under normoxic conditions, 3T3L1 cells converted to lactate enormous amounts of the medium glucose 28
covering most of their energy needs through anaerobic glycolysis. We postulated that this "wasting" of glucose might actually help to diminish hyperglycemia because of the large combined mass of WAT; in ex vivo studies; we also observed the accumulation of lactate in WAT masses 29, in line with the results previously observed in
cultured cells. These results agreed with the low in vivo WAT oxygen consumption observed in humans and rats
30, 31 parallel to its high production of lactate 32, 33.
However, the origin of the circulating lactate could not be fully discerned (other than by bulk mass), leaving open its possible relationship with the utilization of glucose for other purposes, such as lipogenesis 34. Fatty
acid synthesis is a main metabolic pathway in the WAT of rodents fed standard (largely carbohydrate-based) diets 35. In order to help clarify the purpose of the
massive production of lactate, we decided to analyze quantitatively the fate of glucose using primary cultures of rat adipocytes, but first we had to develop the necessary methodology to carry out the study applied to the small volumes used in standard cell culture.
Separation of glucose (uncharged molecules) from (ionized) lactate has been done for a long time using ionic-interchange columns 36, 37. However, the problems
posed by this approach limit the quantitative analyses, since high specific activity substrates are needed, and the large volumes required for effective ion-exchange column separation, washings and the inevitable dilution of label limit the possibility of using a multifaceted quantitative approach. In the present study, we adjusted this concept to the use of small volumes, thus limiting most of the unwanted effects of dilution by using a column centrifugation-based approach. These procedures allowed us to analyze, in the same culture well, both the fate of glucose to form lactate and its incorporation to lipids
EXPERIMENTAL
Rats and housing conditions
All animal handling procedures and the experimental setup were in accordance with the animal handling guidelines of the corresponding European and Catalan Authorities. The Committee on Animal Experimentation of the University of Barcelona specifically authorized the procedures used in the present study.
Male Wistar rats (Harlan Laboratory Models, Sant Feliu de Codines, Spain) were used after a 2-week acclimation period in a controlled environment. When used, the rats were 17-weeks old, and weighed 412±35 g). The animals were kept in two-rat cages with wood shards as bedding material, at 21.5-22.5ºC, and 50-60% relative humidity; lights were on from 08:00 to 20:00. They had unrestricted access to water and standard rat chow (Harlan-Teklad #2014).
Isolation and measurement of the number of adipocytes
The rats were killed under isoflurane anesthesia, at the beginning of a light cycle, by exsanguination, from the exposed aorta, using dry-heparinized syringes. The rats were rapidly dissected, taking samples of epididymal WAT. Tissue pieces were used immediately for adipocyte isolation. This procedure followed, essentially that described by Rodbell 38. In short, tissue
samples were weighed when already immersed in the digestion medium described below, and cut in small pieces with scissors. Samples were incubated, at 37 ºC in a shaking bath for 60 min, with 2.5 volumes of Krebs-Henseleit medium pH 7.4, containing 5 mM glucose, 0.1 µM adenosine (Sigma-Aldrich, St Louis, MO USA) 39,
and 10 g/L delipidated bovine serum albumin (Merck-Millipore, Billerica, MA USA). The medium was complemented with 3.5 µkat/mL collagenase (LS004196, type I, from Worthington Biomedical, Lakewood, NJ USA). At the end of the digestion process, the suspensions were gently "filtered" through a double layer of nylon mesh hose, which retained small vessels and undigested pieces (if any). The smooth crude suspension of isolated cells was left standing for 5 minutes in capped syringes held vertically. The adipocytes floated to form a defined upper layer; then, the lower aqueous fraction was slowly drained off, capping again the syringe. The cells were washed three times with 2.5 volumes of the digestion buffer minus collagenase. The final supernatant layer contained intact adipocytes and a small amount of free fat from broken cells. In all cases, before re-suspending the cells, the buffer alone was subjected to 30 s of strong vortexing, to allow for equilibration with air oxygen. After the final washing, only the cells' fraction remained, from which aliquots were taken for incubation. The samples were extracted from the central part of this layer, trying not to disturb the thin floating fat layer. The whole procedure was carried out at room temperature; the cells were used immediately after the final washing.
A known volume of the adipocyte suspension was introduced in a Neubauer chamber (#717810 Neubauer improved bright line, Brand Gmbh, Wertheim Germany). Using an inverted microscope, four fields (following a pre-established selection pattern) were photographed at low power. Each adipocyte suspension sample was measured four times, obtaining about 16 photographs from each. The numbers and diameters of cells were
3
counted (under the conditions used, all cells adopted a spheroid form) using the ImagingJ software (http://imagej.nih.gov/ij/) 40 for image analyses.
Conditions for the incubation of adipocytes
Incubations were carried out using 12-well plates (#CLS3513 Costar, Sigma-Aldrich) filled with 1.7 ml of DMEM (#11966-DMEM-no glucose; Gibco, Thermo-Fisher Scientific, Waltham MA USA), supplemented with 30 mL/L fetal bovine serum (FBS, Gibco). The medium also contained 25 mM hepes (Sigma-Aldrich), 2 mM glutamine (Lonza Biowhittaker, Radnor, PA USA), 1 mM pyruvate (Gibco), 30 g/L delipidated bovine serum albumin (Millipore Calbiochem, MA USA), 100 U/mL penicillin and 100 mg/L streptomycin (Gibco, Thermo-Fisher Scientific). Adenosine (Sigma-Aldrich) 100 nM was also added to help maintain the integrity of the cells
39. D-glucose was added as substrate, supplemented
with 14C-(U)-D glucose, (#ARC0122B, American
Radiolabeled Chemicals, St Louis MO USA, specific activity 11 GBq/mmol, i.e 1.83 GBq/mmol-C). Final glucose concentration in the wells was, nominally, 7 mM. In all cases, the amount of label added per well was the same: 4.7 kBq (i.e. 430 pmol 14C-glucose) resulting
in specific activities in the range of 385 Bq/µmol. Labelled glucose was purified through a single pass of the product through an ion-exchange column as described below under Estimation of medium label
present in the "glucose" fraction. The removal of ionic
contaminants contributed to diminish the overlapping of label between the different fractions.
Each well received 400 µL of the adipocyte suspension, thus completing a final volume of 2.1 mL. A number of random counts of cells pipetted in wells gave a variation of about 2 % in initial cell numbers, the standard amount of cells used (702±46 x 103 cells per
well) depended on the donor rat. Since the combined volume of the added cells was known, the net volume of incubation medium (i.e. excluding cell volume) was calculated for each single well from the initial volume and that of buffer added with the cells. This was estimated from the total volume of cell suspension added minus the volume of cells, obtained from the mean cell volume and the number of cells counted. Under these conditions, the cells floated freely and tended to accumulate on or near the surface
The cells were incubated at 37°C in an incubation chamber ventilated with air supplemented with 5% CO2,
which gave a theoretical pO2 of 20 kPa (i.e. 0.2 mM of
dissolved O2). These values were in the range of those
measured under the same conditions 28. The calculated
pCO2 was in the range of 5 kPa, corresponding to 1.7
mM of dissolved CO2 41. The cells were incubated for 24
h without any further intervention.
The rate of evaporation of water from the medium was estimated, under the conditions of incubation, using medium-filled wells (i.e. no cells), and measuring the loss of weight with time of incubation in the chamber. Daily evaporation was in the range of 2.5 % of the well water (i.e. about 48 µL/day). This value was included in
the estimation of the volume of medium, used for all calculations of substrate utilization.
Cell harvesting and sample handling
The medium (carefully excluding the floating adipocytes) of the wells was transferred to 2 mL Eppendorf tubes. The cells (and the remaining medium bathing them) were transferred to another tube and left standing. All media extractions were combined in a single tube and its weight was estimated by differential weighing;after thorough mixing, it was kept at -20 ºC until processed. The cells were weighed likewise and re-suspended in 2 volumes of digestion buffer (without collagenase), pH 7.4, and containing 5 mM glucose; then, they were allowed to float again, removing the infranatant washing medium. The cells were then frozen in the same tube with liquid nitrogen and kept at -80 ºC until processed.
The incubation medium was used for the estimation of glucose, using a glucose oxidase-peroxidase kit (#11504, Biosystems, Barcelona Spain) to which we added 740 nkat/mL mutarrotase (porcine kidney, 136A5000, Calzyme, St Louis, MO USA) 42.
Lactate was measured with kit 1001330 (Spinreact, Sant Esteve d'en Bas, Spain), pyruvate was measured with NADH (Calbiochem EMD Millipore Merck, Darmstadt, Germany), and lactate dehydrogenase (rabbit muscle, 427217, Calbiochem EMD-MiIllipore Merck) 43; glycerol
was estimated with kit #F6428 (Sigma-Aldrich). We decided to analyze the chemical concentrations of substrates in samples despite being tainted by radioactive tracers in order to be able to exactly match concentrations and label counts. We used that approach because of the small amounts of radioactivity involved, and the lower ionizing power of 14C. β radiation These
analyses were done under conditions of high radioprotection safety. Debris and contaminated materials was safely disposed of as radioactive waste.
Estimation of label content
Counting of 14C label in the samples was done
using typical 5 mL polyethylene vials. Samples of up to 400 µL were mixed with at least 10 volumes (minimum 3.5 mL) of water-miscible liquid scintillation cocktail (Ecoscint H; #LS-275, National Diagnostics, Atlanta, GA USA). Then, the tubes were shaken to obtain a single clear phase. They were left in the dark (at room temperature) for at least 12 h before being introduced in a scintillation counter (TriCarb 2100-TR, Perkin-Elmer Packard, Boston, MA USA). Automatic correction for counting efficiency was applied, and a number of blanks was introduced in each series to estimate the background, which was routinely discounted. When sufficient sample was available, counting was done in duplicate. Specific radioactivity of the different fractions was expressed (and compared) on a molar (per carbon) basis. Thus total label (i.e. x Bq) in 1 µmol glucose was expressed in (x/6) Bq/µmol-C, because the glucose used was uniformly labelled in its 6 carbon atoms. In the case of lactate and glycerol, the factor used was 3, and for fatty acids, we used oleic acid (C18:1;9) as standard
4
for comparisons because it is the most abundant fatty acid in the rat 44; thus the molar specific activity of fatty
acids was divided by 18 to obtain the molar-C (i.e. per carbon) value.
Preparation of micro ion-exchange columns
The basis for discrimination of the main substrates analyzed was the use of ion-exchange resins in microcolumns. The prepared columns were able to retain quantitatively ionized molecules, such as lactate at a pH in which its ionization will be sufficiently high, but non-ionic (acidic in the present setting) compounds such as glucose and glycerol would pass unaffected through the column. The acid retained in the column was later displaced with a low pH solution, releasing the lactate (and pyruvate) label.
Sieve-filter type centrifugation inserts (Ultrafree-MC, Millipore, Bedford, MA USA) were used as columns. The sieve filter was removed, leaving bare the insert plastic tube (Figure 1). A small amount of analytical quality glass-fiber wool (Panreac, Castellar del Vallès, Spain) was used to cover the bottom of the insert tube, pressed with the help of a glass rod. The bottom of the insert was then filled with 250 mg of 24 h-hydrated and centrifuge spin-dried ion-exchange resin in cationic form (Dowex 1x2 [200-400 mesh], Serva Electrophoresis GmbH, Heidelberg, Germany). The insert was introduced in the holder tube and then 200 µL of pure water (18 MΩ resistivity) was added to the column. The tubes were centrifuged for 2 min at 200xg. The recovered washing fluid was discarded. The column was already prepared for immediate use.
Overview of label distribution analysis after incubation
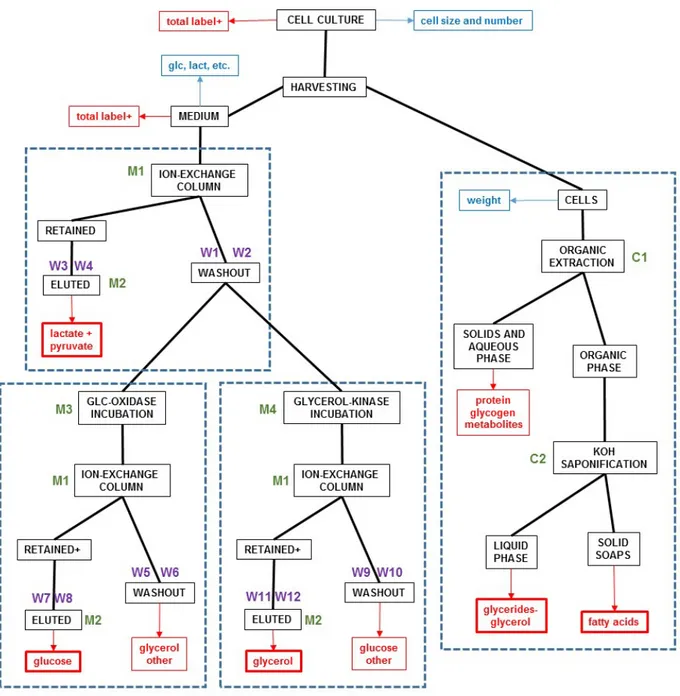
We used a sequential process for the separation and counting of fractions corresponding, essentially, to the main metabolites expected to be formed from glucose. The procedure used is presented in Figure 2. At the end of the incubation of adipocytes in media containing labeled glucose, the cells were separated from the medium and processed as described below. The medium was passed though ion-exchange minicolumns (procedure M1) to retain all ionizable compounds (i.e. lactate), which were later recovered and counted (procedure M2). This process depleted the medium of ionizable (labelled) compounds; but containing all non-ionizable (i.e. glucose, glycerol) ones. These were separated through derivatization to a specific acidic compound (gluconate in the case of glucose, procedure M3; glycerol-3P in the case of glycerol, procedure M4) by means of parallel incubations of the depleted medium. The recovered fractions allowed a fair discrimination of the label present in the medium remaining glucose and that in lactate and glycerol.
Estimation of medium label present in the "lactate" fraction
The basic protocol for column retention of acidic compounds (procedure M1) consisted of the application
of 300 µL of the incubation medium (its pH was already in the range 6.8-7.2) on top of the column. The tubes were capped and left standing for 4 min to allow an even distribution of the liquid wetting the resin. No fluid left the column, since the mobile phase was retained by capillarity. The tubes were then centrifuged 2 min at 200xg (i.e. 20 MPa). The fluid recovered (about 300 µL) was reserved (washout 1, or W1). In order to remove any non-ionic labeled remnants, the column was washed with 200 µL of pure water, quantitatively recovering the washout (W2). The column was then eluted (procedure M2) with the addition (and separation by centrifugation) of four successive 200 µL aliquots of 250 mM HCl, recovering the combined acidic eluates (W3). Finally, the column was washed again with 200 µL of pure water (W4). This procedure extracted all ionic labelled compounds of the medium previously retained by the column; the combined volume of W3+W4 was about 1 mL. Depending on the volume to process and sample dilution, higher volumes of medium were used, or pairs of columns could be used in tandem. The radioactivity of the samples was estimated after neutralization with solid sodium bicarbonate, in order to limit the acid-generated quenching.
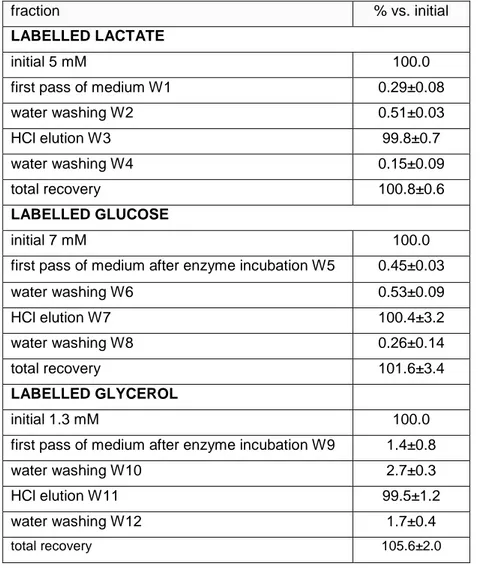
In order to check the effectiveness of the columns, an analysis of lactate label distribution was carried out under otherwise standard conditions (but no cells). We used cold (5 mM) and labeled L-lactate [317 Bq/well] (14C-(U)-L-lactate; #NEC-599, Perkin-Elmer, Boston,
MA USA; specific activity 4.80 MBq/µmol, i.e. 1.60 MBq/µmol-C). Table 1 shows the distribution of total label between the different fractions recovered.
The column completely retained the lactate label; its elution was practically complete with the first 400-600 µL of HCl; the successive washings did not provide further recoveries of lactate label. The final process was established leaving only one additional water washing, which was used, in all the cases, to check for the completeness of column elution. When label was detected in the second washout (it was always less than 5% of that in the first washing), the net Bq were simply added to the corresponding column washout for final calculations.
Estimation of medium label present in the "glucose" fraction
After retention of lactate in the ion-exchange column, the medium (plus the water washing) passing through (W1 + W2) contained the entire non-retained glucose label. We modified enzymatically the glucose to gluconic acid by means of the same glucose-oxidase method used to measure its levels (procedure M3).
Aspergillum glucose oxidase (EC 1.1.3.4) specifically oxidizes C1 of glucose with oxygen to yield gluconic acid and hydrogen peroxide 45:
β-D-glucose+ O2 → D-glucono-β-lactone + H2O2
D-glucono-β-lactone + H2O → D-gluconic acid
5
This same reaction has been used previously to discriminate the presence of radioactive label in glucose
46 using classical minicolumns filled with an
ion-exchange resin (cationic form) adapted to the retention of acidic compounds (as in the case described above for lactate) 37. In order to diminish possible sources of
interference, we used purified enzymes, glucose oxidase (type VII from Aspergillus niger, Sigma-Aldrich); as well as catalase (from bovine liver, Sigma-Aldrich). Catalase (EC 1.11.1.6) was added in excess to drive the reaction to the right, to limit unwanted oxidative damage and to recycle part of the medium oxygen to sustain the glucose oxidase activity, since oxygen availability may be the limiting step of the reaction under the conditions tested.
2H2O2→ 2H2O + O2
The addition of mutarotase (EC 5.1.3.3) to favor the conversion of α to β glucose 47 was considered
unnecessary because of the length of the incubation period (allowing for a complete drainage of α-glucose to the β form, substrate of glucose oxidase). A test including mutarotase showed no effects in glucose oxidation under the experimental conditions described below. The test results, obtained using labelled glucose (initially most of it as the α-isomer), which resulted in its complete oxidation, was a definitive argument for omitting mutarotase in all the ensuing experiments.
An aliquot –100 µL– of combined fractions W1 and W2 (eluted after lactate retention) was used for the measurement of total label. Another 100-µL aliquot was mixed with 1 mL of 50 mM acetate buffer pH 5.2, containing 1 g/L dithiothreitol, 1 g/L defatted bovine serum albumin (all from Sigma-Aldrich), about 400 nkat of glucose oxidase and an excess (350 µkat) of catalase in open Eppendorf tubes. They were incubated overnight at room temperature. The long incubation was not justified by the high enzyme load added, but by the need to maintain an adequate interchange with atmospheric oxygen to allow a prompt oxidation of glucose by glucose-oxidase. The periodic ventilation of samples with small volumes (10 mL) of air using syringes and a capillary tube showed no significant effect on the effectiveness of the reaction, and was cumbersome. Thus additional ventilation was not considered further, using time and passive gas diffusion instead. The incubation was stopped by the addition of 1 mL of 20 mM glycine buffer pH 9.8 containing 0.5 mM MgCl2, changing the medium pH to 8.5. Then, the
sample was divided in two aliquots of the same volume, which were passed through two parallel Dowex 1x2 columns as described previously for the M1 procedure. The washouts W5+W6 from both columns were combined, and were used to determine the label content of the fraction. The label in W5 and W6 did not correspond to glucose but to glycerol, and (possibly) other unknown nonionic compounds, which were not substrates for glucose oxidase.
The label retained in the column was eluted following the same procedure described above for
lactate, which yielded washouts W7 and W8 (total volume of 1 mL), which were counted using several scintillation vials. They contained the eluted gluconic acid which label was that of the original glucose present in the medium.
In order to check the effectiveness of the derivatization procedure, an analysis of glucose label distribution was carried out under otherwise standard conditions. As shown in Table 1, the conversion of glucose to acidic-labeled compounds (essentially gluconate) was quantitative, being retained in the minicolumn. Elution with HCl released, again, quantitatively the glucose label.
Estimation of medium label present in the "glycerol" fraction
As outlined above, after retention of lactate in the ion-exchange column, washouts W1 + W2 contained the entire non-retained nonionic label (i.e. glucose and glycerol, essentially). However, to find out whether the label corresponded to glycerol, we used a specific enzymatic reaction to convert all free (nonionic) glycerol to an ionic form retaining the label (procedure M4).
Glycerol kinase (EC 2.7.1.30) specifically esterifies glycerol with ATP to yield glycerol-3P and ADP 48:
glycerol + ATP → glycerol-3P+ ADP
This same reaction has been used previously to discriminate the presence of radioactive label in glycerol
49, using an ion-exchange resin to retain all acidic
compounds (i.e. remaining ATP, ADP and glycerol-3P). In order to diminish possible sources of interference, we used a purified enzyme, glycerol kinase from
Escherichia coli (#G6278, Sigma-Aldrich).
A 100 µL aliquot of combined fractions W1 and W2 had been already used for the measurement of total label. Another 100-µL aliquot was mixed in an Eppendorf tube with 0.3 mL of 50 mM tris-HCl buffer pH 9.8. The buffer also contained about 100 pkat of the enzyme, as well as disodium-ATP, streptomycin+ penicillin, magnesium acetate, lipid-free bovine serum albumin and dithiothreitol (all from Sigma-Aldrich) at final concentrations, respectively, of 8 mM, 10 mg/L + 10 U/mL, 8 mM, 1 g/L and 1 g/L. The tubes were closed and incubated at room temperature. The incubation was stopped by adding 18 µL of 50 mM HCl to each sample; their pH decreased to about 7. Aliquots of the sample were passed through Dowex 1x2 columns as described previously for the M1 procedure. The washouts W9+W10 were combined, and used to determine their label content, that belonged essentially to glucose and other remaining compounds not susceptible of phosphorylation by glycerol kinase.
The label retained in the column was eluted following the same procedure described above for lactate, which yielded washouts W11 and W12 (total volume of 800 µL), which were counted. They contained the eluted glycerol-P, which label was that of the original glycerol present in the medium.
6
This procedure showed a number of additional problems, not encountered in the case of glucose oxidation to gluconate. The amount of enzyme added was sufficient to convert the substrate in a few minutes, but initially we left the tubes under incubation overnight to make sure that all glycerol was phosphorylayted. However, we observed that the long incubation resulted in yields of label higher than expected in the W9+W10 effluxes. In fact, the label obtained after retention of glycerol-3P in the column was higher than that found in the W5+W6 obtained as washouts of glucose retention. We traced the discordance to the presence of glucose in the glycerol incubation with glycerol-kinase, and to the fact that the M1 procedure removed the antibiotics present in the medium, which prevented the growth of microorganisms. The differences between the fractions indicated above were due to such growths yielding lactate or other acids. The problem was solved reintroducing the antibiotics in the glycerol-kinase incubation medium, as indicated above in the general procedure. The results of this test can be seen in Table 2. This was only part of the problem, since using labelled glucose and no glycerol standards, part of the glucose was retained in the columns. The long incubation, thus, resulted, in a partial ionization (phosphorylation?) of glucose, yielding erroneous label values for glycerol. The problem was finally solved cutting down the incubation time to only 2 hours and increasing the amount of glycerol kinase to the 100 pkat indicated above.
In order to check the effectiveness of the specific derivatization procedure used for glycerol, an analysis of its label distribution was carried out under otherwise standard conditions. We used cold (1.3 mM) and labelled glycerol [242 Bq/well] (14C-(U)-glycerol,
#CFB174 Amersham Pharmacia Biotech, Amersham UK; specific activity 5.25 MBq/µmol, i.e. 1.75 MBq/µmol-C). Table 1 shows the distribution of total label in each case between the different fractions recovered. This experiment was done using an overnight incubation time, which can explain the relative variability of the results obtained when compared with lactate and glucose. The retention of label in the column was not quantitative, but almost, and the eluted fractions of label obtained with HCl allowed us to recover the initial label.
Cell fraction handling
Frozen (i.e. assumedly broken) adipocytes were used for the extraction of lipids (procedure C1, Figure 2), using diethyl-ether (peroxide-free, containing 7 ppm BHT, Sigma-Aldrich), in the proportion of about 1.5 mL of chilled diethyl ether for each sample (i.e. 179±22 mg) of frozen cells. The tubes containing the already freeze-fractured cells were mixed by vortex several times and
cells thawed while subjected to extraction in the cold. Then 500 µL chilled pure water were added and the tubes were briefly centrifuged (5 min at 600xg) and two phases appeared. The lower (aqueous) phase was suctioned off, including the delicate inter-phase film of protein (and membrane fragment) debris. This fraction was used for counting; it contained cell protein, (mainly) glycogen, metabolites, membrane microsomes and non-lipophilic debris. The (upper) organic phase was recovered, left to dry at room temperature and weighed. Then, the lipid residue was dissolved/ mixed with 2 mL of diethyl-ether and 1.5 mL of hydroalcoholic KOH. The latter was prepared immediately before use by mixing 1 volume of 8.4 M potassium hydroxide (in water) with 3 volumes of ethanol. The alkali broke down the acylglycerols through saponification, forming potassium soaps and freeing glycerol. The tubes were the reaction took place were vortexed and allowed to react at room temperature for 10 min (procedure C2). The tubes were then left to stand and two layers were separated, the bottom one contained the glycerides' glycerol. The upper phase promptly solidified and contained, essentially, the potassium soaps, not soluble in ether-ethanol. The phases' weights were estimated, and the whole samples counted.
The cells' fractioning was not checked using standards, as was the case of lactate and glucose, since its total retention of label was small, the procedure could not be repeated from scratch with known labelled compounds in the cells, and, especially, because all the manipulations described are common and have been previously used. Instead, the overall evaluation of the effectiveness of the whole process described was based on a precise accounting of the distribution of all label added to the incubation well.
Additional methodologic considerations
A critical factor in the development of this procedure was to keep track of volumes and incorporate into the calculations all aliquots used for testing (i.e. cold glucose or lactate levels, amount of label in a given fraction). Unless the whole fraction were used for counting, a sizeable part of it was used to determine its label content. All data were introduced in a spreadsheet in which the volumes were justified with a (pipetting) error of ± 3%. A similar error level was estimated for counts, which were routinely repeated and the mean value used. When possible, or when no other avenue was available, volumes were estimated from differential weights and the application of densities, estimated, as described, using the same samples.
Statistical calculations and analyses were done using the Prism 5 package (Graph-Pad Software, La Jolla, CA USA).
RESULTS
Experimental application of the method described.
Analysis of label and substrates/ metabolites in fractions of incubated adipocytes
Cells from four different rats were used. The results obtained are presented in Tables 3-5. Table 3 shows the composition of the media at the beginning of
7
the experiment and after 24 h of incubation. The data were given both in molar units and in well content of each metabolite analyzed.
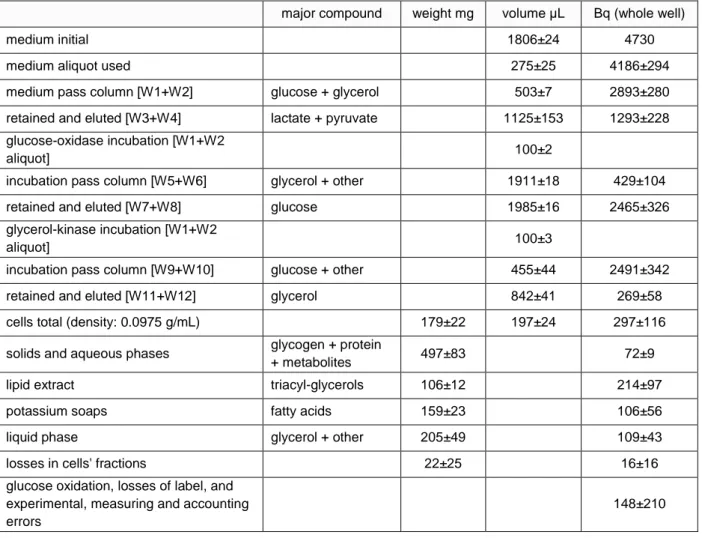
Table 4 presents the weights/volumes of samples, their label content and the extrapolation of the results to the whole incubation well, in spite of the size of the sample analyzed. The presence of label in the different fractions is presented as mean values of the four rats used.
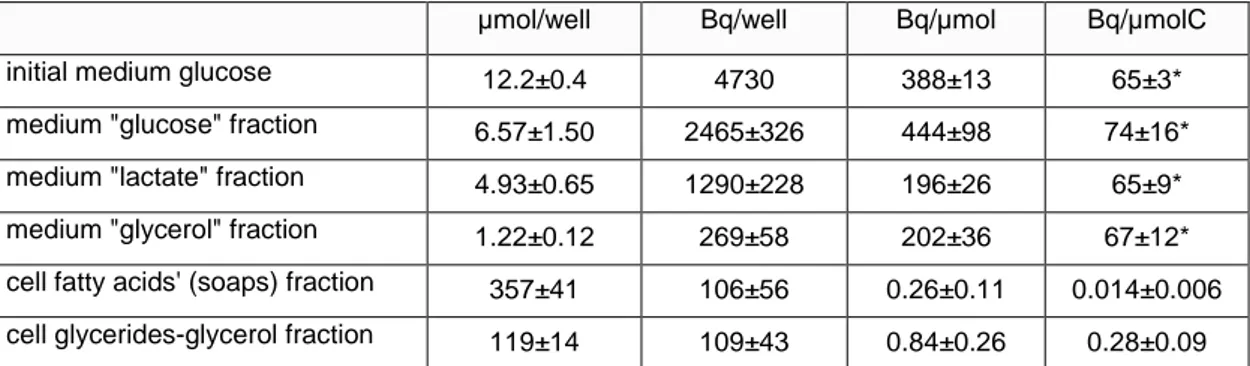
Table 5 presents the specific radioactivity of the different fractions analyzed: both in the initial medium and after incubation and cell harvesting. We did not found sufficiently high levels of non-esterified fatty acids in the media to include them in the calculations. Lactate (plus pyruvate) and the remaining glucose showed values for specific radioactivity very close to those of the initial glucose used, which helps to support the adequacy of the methodology used.
As expected, we found much lower specific radioactivity, in lipids, with roughly half their label incorporated into fatty acids and the rest in the glycerol moiety of triacylglycerols. As expected, the specific radioactivity, expressed in Bq/µmol of C, of the remaining glucose, lactate (plus pyruvate), and medium free glycerol were the same as that of the glucose initially added to the cell cultures, which proved that the origin of the free 3C units was the glucose added to the medium. The specific activity of glycerides-glycerol was more than one order of magnitude higher than that of fatty acids, but much lower than that of the glycerol found in the medium.
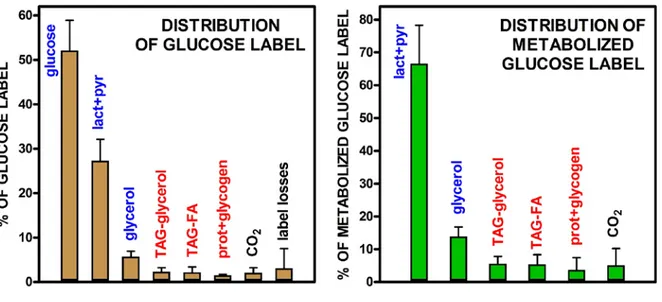
Final distribution of the glucose label
Figure 3 presents the results of the separation of medium and cell label in fractions. The data are a translation of the experimental figures shown in Table 4, and are expressed as percent values of the distribution of the label initially introduced in the incubation medium. Most of the label remained in the medium, about half as unused glucose. Thus, sufficient glucose remained after 24 h to sustain the cells' metabolism. The other major label containing fractions in the medium were lactate (+ pyruvate) and glycerol. Cells incorporated only about 6 % of the label, with a similar distribution of total label between glycerides-glycerol and fatty acids, but containing also a significant proportion of label in hydrophilic compounds (probably glycogen). In all, only
c. 0.3 % of the cell label was not accounted for. This
discrepancy was uncharacteristically small for this type of studies, and helps understand the limited number of molecule types that were marked from the glucose label in the relatively short time of incubation. The global loss of label was, similarly, low (in the range of 3 % overall) given the usual imprecision of separation of labelled compounds, probably because of reasons similar to those of the cells' label.
Figure 3 also shows the fate of label from the glucose actually metabolized. About two thirds corresponded to the lactate fraction, but the sum of free and triacylglycerol-incorporated glycerol accounted for 1/5th of the total, which contrasts with the (low) 5 % of
fatty acids. Since there was a definite, albeit small, net synthesis of fatty acids (they incorporated glucose label), we have necessarily to take into account the coexistence, in a mainly glycolytic environment, of oxidative processes (at least the pentose-phosphate
pathway –or malic enzyme— and pyruvate
dehydrogenase). The oxidative metabolism was necessary to provide NADPH and 2C units to build acyl-CoA. The production of CO2 from glucose in the
pentose-phosphate pathway yields 6 carbon-units as CO2 (i.e. equivalent to a whole glucose) for each 12
NADPH produced; and pyruvate dehydrogenase produces another CO2 for each acetyl-CoA formed. To
synthesize an 18C fatty acid we need 9 acetyl-CoA units and 2x8=16 NADPH; this results, necessarily, in the production of 9+8= 17 CO2, which is liberated for each
fatty acid produced, i.e. roughly 1 CO2 per carbon in the
fatty acid. The minimum oxidative needs for the metabolic picture depicted is the equivalent, in glucose units of the label in fatty acids of about 1/3rd of the label
found in fatty acids. This is a minimum value, which does not preclude other oxidative pathways. It may be also lower than this figure depending on the activity of the malic enzyme as provider of cytoplasmic reducing power for lipogenesis. Thus, it is only an approximation to the actual oxidative capabilities of the adipocytes. In any case, the proportion of oxidative activities of adipocytes on the medium glucose could not go beyond a 4 % of metabolized glucose, which represents a maximum figure for measuring errors not corrected, including the variability of 14C counting, and the probable
loss of cells and medium during the harvesting process.
DISCUSSION
We have developed a complex, but doable, procedure for analysis of the fate of a substrate, as is glucose, using a primary cell culture of adipocytes just extracted from WAT. There are a considerable number of procedures similar to this one, which have been used to follow up the uptake of labelled substrates 4, 50, or their
(usually one-step) transformation, or oxidation 51. The
problem, shared by all similar procedures, being largely the small volumes of media and cells used in cell culture, which strongly limits the actual amount of label that can
be incorporated and, especially, the later analysis of the metabolites, intact substrate and distribution along different pathways. Studies using tissue pieces, sections or isolated cells have been used in the past for experiments such as those described here, but the critical step of quantitative separation of substrates requires a careful balance between the amount of tissue, medium (and labelled compounds) used, and the effects of dilution on label distribution. The measurement of labelled CO252, and up to a degree, its
8
incorporation in cells 53 or removal from the medium 54
have been used often with success. However, the studies using perfused 55 or perifused 56 organs and
incubations with pieces of tissue 57, now seldom used,
have been the main methods available for analyses of the utilization of glucose and release of 3C units by live tissues.
The objective of this study was to design a flexible system for the study of the metabolism of WAT cells (or tissue pieces) under well-controlled conditions, which can provide coherent results from a single incubation plate well. We have found, recently, that adipocytes glycolyze huge amounts of glucose to lactate and glycerol 28, acting, essentially, as an anaerobic tissue
under normoxic conditions, such as those used in the present study, and this mechanism extends to the in vivo conditions 29. We have also found that WAT contains a
full urea cycle 58 and a potentially active amino acid
metabolism 14. The results obtained, and a growing list
of unique capabilities of WAT 59-64 has decided us to
focus on the quantitative analysis of WAT metabolism. Thus, we checked these parameters against the known functional and morphologic differences of WAT sites 65-67, and their modulation by sex and diet 14, 68, as well as,
especially, the effects of metabolic syndrome 69, 70. In our
opinion, there is yet much to learn from WAT from the "basic" biochemical-metabolic point of view. We know much about its metabolic modulation by cytokines 71 and
hormones 72-75, and even its responses to oxidative
stress 76 and hypoxia 77, 78, however, we know very little
on the quantitative importance of Randall's glucose-fatty acid cycle, the classical Cori cycle and the interchange of glutamine and ornithine-arginine with the splanchnic bed. Consequently, we developed a tool, which can be used for that purpose, adapted, modified, and, we hope, improved to fulfill its function. In the present study, we did a full experiment of label distribution on rat adipocytes, but our focus was not on the spectacular results (we plan to extend further these studies, in adequate depth), but on obtaining a proven tool to carry out these type of investigations. A test in toto seems the most adequate way to check the defects (and correct them) of such complex approach. The results may need further development for specific experiments, but the backbone of quantitative approaches and reduced column efflux may allow these developments further than presented here.
The large volumes involved in the use of ion-exchange columns, and the difficulties posed by the dilution of samples linked to their use makes difficult to discriminate a sufficient number of main metabolites from the same cell culture. This approach is of limited usefulness on modern cell culture (immortalized or primary); consequently, in the last decades, the use of these methods has been largely abandoned, in part because of the limited advantages of using radioactive tracers for the small volumes and live material mass involved in cell culture-based studies. The availability of other analytical tools and the focus set on regulation,
assuming that the main metabolic pathways are already known have compounded the situation.
In decreasing the handling of volumes needed for ion-exchange column separation, we developed a methodology that may be directly applicable to the analysis of metabolic flow of substrates in (at least primarily) adipose tissue cells. The critical points of the adaptation of existing methodology to the problem described have been:
a) The use of micro-columns, which require microliter samples to process, by using centrifugation instead of simple gravity for eluent recovery, eliminating most of the contamination induced by capillary retention of effluents in the columns.
b) The control of volumes and of presence of label in different fractions, including a critical analysis of losses (and possible sources of error) and incorporation of all data in the final computation of the results.
c) To combine these label analyses with those of the main metabolites studied using standard micro-analytical methods in the same well, and thus being able to compare the specific radioactivity of these fractions. This requires special training and care for non-label dependent analyses of labelled compounds, but the homology of the results achieved justifies the additional application of safety measures.
The main problems posed by this type of methodology are already well-known: It is fairly difficult to match the "cold" measurements of concentrations and the analysis of the labelled fractions which, essentially, correspond to the same molecules. In the case of lactate, we were aware that this fraction contained a variable amount of pyruvate, in part because it is a standard component of the media for adipocytes (as is our case), but also for its known secretion by adipose tissue 33. Its formation is also a
consequence of the production of glycerol; since the synthesis of glycerol-3P, redirects NADH from the glycolytic pathway (that generated by glycerol-3P dehydrogenase). This relative deficit of NADH in the main glycolytic pathway results in a relative excess of pyruvate (that cannot be reduced to lactate for lack of enough NADH to maintain the stoichiometry of the process). This "extra" pyruvate, however, was not fully directed to produce the acetyl-CoA later used to synthesize the fatty acids found in cells' triacylglycerols, Lipogenesis was limited, as observed in the difference between the label presence in the fatty acids and glycerol moieties of triacylglycerols, even not taking into account the free glycerol in the medium. However, the specific activity (per carbon unit) of lactate was in the same range than those of glucose and glycerol. The explanation is not simple, since pyruvate was retained, as was lactate in the columns in the first pass, but its "cold" levels were not measured as was the case with the major component, lactate. The specific activity of the "lactate+pyruvate" fraction should be, consequently, somewhat lower than that of glucose, unless we take
9
into account the preferential utilization of pyruvate for fatty acid synthesis. This possibility is supported by the specific activity of this fraction (per C) being similar to that of the other medium metabolites.
It has been found that under hypoxic conditions WAT decreases the synthesis of acyl-CoA, storing less fat 77.
WAT consumed very little oxygen in vivo 78, suggesting
that its anaerobic glycolysis may sustain a sizeable amount of its needs 28 for an unexpectedly active
metabolism 14. In fact, about 98.5 % of the adult large
adipocytes such as those used here is made up of fat, the small active cytosol, however, has enzyme activities (i.e. lactate dehydrogenase, amino acid metabolism enzymes) in the range of most other tissues 14.
The results obtained from the application of the combined study of label fate are in agreement with the known high production of lactate even under normoglycemic conditions. The specific activity of lactate is the same as that of the initial (and remaining) medium glucose. However, in spite of a largely glycolytic environment, there was a small but significant synthesis of fatty acids from glucose, stored in the enormous triacylglycerol stores. The animals used were normal adult males, thus, the glycolysis could not be attributed to hypoxia (the availability of oxygen was high), or metabolic stress/ inflammation.
The data presented support the assumption that glucose is practically the only origin of the medium
glycerol. The high specific activities found were much higher than what could be expected if the medium glycerol were produced via acyl-glycerol lipolysis, even if this were only a minor fraction of the total.
In the adipocyte, the flow of label to glycerol (i.e. via glycerol-3P) was considerable, even when corrected by the number of carbons. We can only assume that a significant part of the glycerol-3P pathway resulted in the patent presence of high specific activity-glycerol in the medium 28. The results observed in the test of the
method are, thus, coincident with those observed using other systems and conditions. The high label content and the absence of labelled fatty acids seems to confirm that glycerol, was not formed by lipolysis as previously postulated 79, 80, but if was formed directly from the direct
conversion of glucose.
In sum, the results we obtained in the samples of epididymal WAT analyzed agree with what we know of WAT, established using other means and techniques, but the results presented here contribute further to show the proportions of glucose carbon going through different pathways to form a combination of glycolytic and oxidative metabolism. The methodology we present may be especially useful to analyze the effects of substrate availability/ concentration, hypoxia, inflammation, regulatory factors on the modulation of these effects.
CONCLUSIONS
We have developed a systematic analysis of the fate of 14C-label from glucose in primary cultures of
adipocytes. Its application to epididymal rat adipocytes, has allowed us to analyze in detail the proportion of label incorporated into medium lactate and glycerol. Cells glycerides' glycerol and fatty acids synthesis were also measured, thus setting the basis for a further confirmatory analysis of what we have found in this phase of methodological development. Specifically the full glucose (i.e. not lipolytic) origin of the glycerol
secreted by adipocytes under conditions of abundant glucose in the medium, the predominance of an active glycolysis in adipocytes (i.e. high production of lactate) parallel to the (oxidative) synthesis of fatty acids, albeit the latter occurring in smaller proportions under the conditions tested. The main advantage of the method described, which warrants its further utilization, is the ability to carry out all determinations quantitatively and using a single cell incubation well.
ACKNOWLEDGEMENTS
This study did not obtain any specific financing. A.C. Ho-Palma was the recipient of a fellowship of the Peruvian Government, F Rotondo obtained also a predoctoral fellowship of the Government of Catalonia.
We would like to acknowledge the generous gift of labelled compounds by Dr. Marçal Pastor, and the late
Dr. Anna Maria Gómez-Foix, which were critical for the development of this paper. We had no opportunity in the end to thank Dr. Gómez Foix for her kindness, friendship, scientific soundness and quality as a person. We miss her.
REFERENCES
1. R. G. P. Denis, A. Joy-Amado, C. Cansell, J. Castel, S. Martinez, A. S. Delbes and S. Luquet,
Diabetes Metab., 2014, 40, 191-197.
2. M. Alemany, RSC Advances, 2013, 3, 1636-1651.
3. B. Kalderon, A. Gopher and A. Lepidot, FEBS Lett., 1987, 213, 209-214.
4. L. Hue and H. G. Hers, Biochem. Biophys. Res.
10
5. E. J. Parks and M. K. Hellerstein, J. Lipid Res., 2006, 47, 1651-1660.
6. C. M. Hasenour, M. L. Wall, D. E. Ridley, C. C. Hughey, F. D. James, D. H. Wasserman and J. D. Young, Am. J. Physiol., 2015, 309, E191-E203. 7. S. Cinti, Prostaglandins Leukotrienes Essential
Fatty Acids, 2005, 73, 9-15.
8. M. d. M. Romero, S. Roy, K. Pouillot, M. Feito, M. Esteve, M. d. M. Grasa, J.-A. Fernández-López, M. Alemany and X. Remesar, PLoS One, 2014, 9, e90995.
9. P. Trayhurn, Acta Physiol. Scand., 2005, 184, 285-293.
10. H. Hauner, Physiol. Behav., 2004, 83, 653-658. 11. M. Alemany and J. A. Fernández-López, Current
Nutrition and Food Science, 2006, 2, 141-150.
12. E. D. Rosen and B. M. Spiegelman, Nature, 2006,
444, 847-853.
13. P. Arner, S. Bernard, M. Salehpour, G. Possnert, J. Liebl, P. Steier, B. A. Buchholz, M. Eriksson, E. Arner, H. Hauner, T. Skurk, M. Ryden, K. N. Frayn and K. L. Spalding, Nature, 2011, 478, 110-113. 14. S. Arriarán, S. Agnelli, X. Remesar, J. A.
Fernández-López and M. Alemany, PeerJ, 2015,
3, e1399.
15. S. I. Anghel, E. Bedu, C. D. Vivier, P. Descombes, B. Desvergne and W. Wahli, J. Biol. Chem., 2007,
282, 29946-29957.
16. S. Winer and D. A. Winer, Immunol. Cell Biol., 2012, 90, 755-762.
17. H. Mizuno, Y. Itoi, S. Kawahara, R. Ogawa, S. Akaishi and H. Hyakusoku, Cells Tiss, Org,, 2008,
187, 177-185.
18. S. Cinti, Am. J. Physiol., 2009, 297, E977-E986. 19. I. Kheterpal, G. Ku, L. Coleman, G. Yu, A. A.
Ptitsyn, Z. E. Floyd and J. M. Gimble, J. Proteome
Res., 2011, 10, 1519-1527.
20. S. N. O'Brien, K. A. Mantzke, M. W. Kilgore and T. M. Price, Anal. Quant. Cytol. Histol., 1996, 18, 137-143.
21. A. Sorisky, A. S. D. Molgat and A. Gagnon, Adv.
Nut., 2013, 4, 67-75.
22. J. H. Kim, S. H. Kim, S. Y. Song, W. S. Kim, S. U. Song, T. Yi, M. S. Jeon, H. M. Chung, Y. Xia and J. H. Sung, Cell Biol. Int., 2014, 38, 32-40. 23. W. Leonhardt, M. Hanefeld and H. Haller, Int. J.
Obesity, 1978, 2, 33-45.
24. M. E. Fernyhough, J. L. Vierck, G. J. Hausman, P. S. Mir, E. K. Okine and M. V. Dodson,
Cytotechnology, 2004, 46, 163-172.
25. V. P. Knutson and Y. Balba, In Vitro Cell. Dev. Biol.
Anim., 1997, 33, 77-81.
26. S. Gesta, K. Lolmède, D. Daviaud, M. Berlan, A. Bouloumié, M. Lafontan, P. Valet and J. S. Saulnier-Blanche, Horm. Metab. Res., 2003, 35, 158-163.
27. Y. H. Yu and H. N. Ginsberg, Circul. Res., 2005,
96, 1042-1052.
28. D. Sabater, S. Arriarán, M. M. Romero, S. Agnelli, X. Remesar, J. A. Fernández-López and M. Alemany, Sci. Rep., 2014, 4, 3663.
29. S. Arriarán, S. Agnelli, D. Sabater, X. Remesar, J. A. Fernández-López and M. Alemany, PLoS One, 2015, 10, e0119572
30. N. Hosogai, A. Fukuhara, K. Oshima, Y. Miyata, S. Tanaka, K. Segawa, S. Furukawa, Y. Tochino, R. Komuro, M. Matsuda and I. Shimomura, Diabetes, 2007, 56, 901-911.
31. L. Hodson, M. Neville, M. F. F. Chong, I. Rogers, S. S. Huda, D. J. Freeman, K. N. Frayn and B. A. Fielding, Nutr. Metab. Cardiovasc. Dis., 2013, 23, 1128-1133.
32. E. Hagström, P. Arner, U. Ungerstedt and J. Bolinder, Am. J. Physiol., 1990, 258, E888-E893. 33. M. DiGirolamo, F. D. Newby and J. Lovejoy,
FASEB J., 1992, 6, 2405-2412.
34. S. I. Taylor and R. L. Jungas, Arch. Biochem.
Biophys., 1974, 164, 12-19.
35. J. Flatt, J. Lipid Res., 1970, 11, 131-143.
36. R. H. Hammerstedt, Anal. Biochem., 1980, 109, 443-448.
37. B. Yu, S. Pugazhenthi and R. L. Khandelwal,
Biochem. Pharmacol., 1994, 48, 949-954.
38. M. Rodbell, J. Biol. Chem., 1964, 239, 375-380. 39. R. C. Honnor, G. S. Dhillon and C. Londos, J. Biol.
Chem., 1985, 260, 15122-15129.
40. S. N. Baviskar, Am. Biol. Teach., 2011, 73, 554-556.
41. J. J. Carroll, J. D. Sluosky and A. E. Mather, J. Phy.
Chem. Refer. Data, 1991, 20, 1201-1209.
42. L. Oliva, C. Baron, J.-A. Fernández-López, X. Remesar and M. Alemany, PeerJ, 2015, 3. 43. F. Noll, Meth. Enzymatic Anal., 1983, 6, 682-688. 44. I. Rafecas, M. Esteve, J. A. Fernández-López, X.
Remesar and M. Alemany, Int. J. Obesity, 1992,
16, 775-787.
45. A. S. G. Huggett and D. A. Nixon, Lancet, 1957, ii, 368-370.
46. M. Azain, T. Kasser and C. Baile, J Nutr. Biochem., 1999, 10, 205-209.
47. I. Miwa, K. Maeda, J. Okuda and G. Okuda, Clin.
Chim. Acta, 1972, 37, 538-340.
48. C. Bublitz and O. Wieland, Meth. Enzymol., 1962,
11
49. C. Crespi, G. Gastalver, A. Palou and P. Roca, J.
Biochem. Biophys. Methods, 1995, 30, 179-183.
50. P. R. Bally, G. F. Cahill, B. Leboeuf and A. E. Renold, J. Biol. Chem., 1960, 235, 333-336. 51. R. H. Hammerstedt, Anal. Biochem., 1980, 109,
443-448.
52. N. C. Juhr, J. Hardieck and J. Franke, J. Exp.
Anim. Sci., 1991, 34, 195-197.
53. P. Schadewaldt, M. Rossig and W. Staib, Biol.
Chem. Hoppe Seyler, 1988, 369, 181-192.
54. F. J. Casado, J. A. Fernández-López, J. M. Argilés and M. Alemany, Anal. Biochem., 1988, 172, 509-513.
55. D. Lincová, D. Miseková, E. Kmonícková, N. Canová and H. Farghali, Physiol. Res., 2002, 51, 387-394.
56. J. L. King and M. DiGirolamo, Obesity Res., 2001,
6, 69-75.
57. J. Christophe, J. Dehaye and J. Winand, Biochem.
Soc. Trans., 1974, 2, 1214-1215.
58. S. Arriarán, S. Agnelli, X. Remesar, J.-A. Fernández-López and M. Alemany, RSC
Advances, 2015, 5, 93403-93414.
59. A. Trzeciak-Ryczek, B. Tokarz-Deptula, P. Niedwiedzka-Rystwej and W. Deptula, Central
Eur. J. Immunol., 2011, 36, 95-99.
60. J. Corre, C. Barreau, B. Cousin, J. P. Chavoin, D. Caton, G. Fournial, L. Penicaud, L. Casteilla and P. Laharrague, J. Cell. Physiol., 2006, 208, 282-288.
61. Y. W. Jiang, D. C. Berry, W. Tang and J. M. Graff,
Cell Reports, 2014, 9, 1007-1022.
62. L. E. Kokai, K. Marra and J. P. Rubin, Translational
Research, 2014, 163, 399-408.
63. Y. Shingyochi, H. Orbay and H. Mizunot, Expert
Opin. Biol. Ther., 2015, 15, 1285-1292.
64. C. Lu, L. Y. Su, R. M. K. W. Lee and Y. J. Gao, Eur.
J. Pharmacol., 2010, 634, 107-112.
65. A. Galinier, A. Carrière, Y. Fernandez, S. Caspar-Bauguil, B. Periquet, A. Periquet, L. Pénicaud and L. Casteilla, FEBS Lett., 2006, 580, 6391-6398.
66. M. M. Romero, J. A. Fernández-López, E. Esteve and M. Alemany, Cardiovasc. Diabetol., 2009, 8. 67. A. Gil, J. Olza, M. Gil-Campos, C. Gomez-Llorente
and C. M. Aguilera, Int. J. Pediatr. Obes., 2011, 6, 13-20.
68. D. Lemonnier, J. Clin. Invest., 1972, 51, 2907-2915.
69. C. M. Elks and J. Francis, Curr. Hypertens. Rep., 2010, 12, 99-104.
70. C. P. Wang, H. L. Hsu, W. C. Hung, T. H. Yu, Y. H. Chen, C. A. Chiu, L. F. Lu, F. M. Chung, S. J. Shin and Y. J. Lee, Clin. Endocrinol. (Oxf.), 2009, 70, 876-882.
71. A. Rodríguez, S. Ezquerro, L. Méndez-Giménez, S. Becerril and G. Frühbeck, Am. J. Physiol., 2015,
309, E691-E714.
72. M. E. E. Jones, K. J. McInnes, W. C. Boon and E. R. Simpson, J. Steroid Biochem. Mol. Biol., 2007,
106, 3-7.
73. J. Galitzky and A. Bouloumie, Cell Metabol. 2013,
18, 3-5.
74. A. Hirata, N. Maeda, H. Nakatsuji, A. Hiuge-Shimizu, T. Okada, T. Funahashi and I. Shimomura, Biochem. Biophys. Res. Commun., 2012, 419, 182-187.
75. Feldman.D., Am. J. Physiol., 1977, 2, E147-E151. 76. F. Boyer, J. B. Vidot, A. G. Dubourg, P. Rondeau, M. F. Essop and E. Bourdon, Oxid. Med. Cell.
Longev., 2015, 2015, 534873.
77. E. García Fuentes, C. Santiago-Fernández, C. Gutiérrez-Repiso, M. D. Mayas, W. Oliva-Olivera, L. Coin-Aragüez, J. Alcaide, L. Ocaña-Wilhelmi, J. Vendrell, F. J. Tinahones and L. Garrido-Sánchez,
J. Transl. Med., 2015, 13, 373.
78. L. Hodson, S. M. Humphreys, F. Karpe and K. N. Frayn, Diabetes, 2013, 62, 1417-1425.
79. M. Vaughan, Journal of Biological Chemistry, 1962, 237, 3354-3358.
80. P. Jansson, A. Larsson, U. Smith and P. Lönnroth,
12
Table 1 Test distribution of glucose, lactate and glycerol label along the M1 procedure of separation using micro ion-exchange columns and elution by centrifugation
fraction % vs. initial
LABELLED LACTATE
initial 5 mM 100.0
first pass of medium W1 0.29±0.08
water washing W2 0.51±0.03 HCl elution W3 99.8±0.7 water washing W4 0.15±0.09 total recovery 100.8±0.6 LABELLED GLUCOSE initial 7 mM 100.0
first pass of medium after enzyme incubation W5 0.45±0.03
water washing W6 0.53±0.09 HCl elution W7 100.4±3.2 water washing W8 0.26±0.14 total recovery 101.6±3.4 LABELLED GLYCEROL initial 1.3 mM 100.0
first pass of medium after enzyme incubation W9 1.4±0.8
water washing W10 2.7±0.3
HCl elution W11 99.5±1.2
water washing W12 1.7±0.4
total recovery 105.6±2.0
The data correspond to the mean ± sem values of four separate analyses for each label, as explained in the text.
Table 2 Effect of the presence of antibiotics in the yield of labelled "glycerol" in the acid-eluted fractions of the fraction of glycerol kinase-treated medium after its retention in the ion-interchange columns
units
glucose label: "glycerol" fraction glucose label: "other nonionic components fraction" * without added antibiotics with added antibiotics
glycerol label in Bq/well 724±190 524±93 428±104
Bq/µmol of glycerol 591±123 387±64 363±84
Bq/µmol-C of glycerol 197±41 129±21 121±28
Data are the mean ± sem of 4 different analyses using glucose as initial source of label.
There were no statistically significant differences between groups for any of the parameters shown (unpaired Student's
t test)
13
Table 3 Results obtained in the application of the described analytical process to epididymal adipocytes from adult male Wistar rats. Cells and medium parameters before and after 24 h of incubation
mM
% of change
cells or µmol/well ( metabolites)
initial after 24 h initial after 24 h
adipocytes (cells x103) -2 702±47 688±33
glucose 6.78±0.29 3.73±0.87 -45 12.23±0.41 6.57±1.54
lactate 0.14±0.04 2.81±0.38 +2x10³ 0.26±0.08 4.93±0.65
glycerol 0.014±0.006 0.70±0.07 +5x10³ 0.023±0.011 1.22±0.12
Data are the mean ± sem of 4 different complete runs (as described in the text) using glucose as initial source of label.
Table 4 Results obtained in the application of the described analytical process to epididymal adipocytes from adult male Wistar rats. Fraction size and label content
major compound weight mg volume µL Bq (whole well)
medium initial 1806±24 4730
medium aliquot used 275±25 4186±294
medium pass column [W1+W2] glucose + glycerol 503±7 2893±280
retained and eluted [W3+W4] lactate + pyruvate 1125±153 1293±228
glucose-oxidase incubation [W1+W2
aliquot] 100±2
incubation pass column [W5+W6] glycerol + other 1911±18 429±104
retained and eluted [W7+W8] glucose 1985±16 2465±326
glycerol-kinase incubation [W1+W2
aliquot] 100±3
incubation pass column [W9+W10] glucose + other 455±44 2491±342
retained and eluted [W11+W12] glycerol 842±41 269±58
cells total (density: 0.0975 g/mL) 179±22 197±24 297±116
solids and aqueous phases glycogen + protein
+ metabolites 497±83 72±9
lipid extract triacyl-glycerols 106±12 214±97
potassium soaps fatty acids 159±23 106±56
liquid phase glycerol + other 205±49 109±43
losses in cells' fractions 22±25 16±16
glucose oxidation, losses of label, and experimental, measuring and accounting errors
148±210
Data are the mean ± sem of 4 different complete runs (as described in the text) using glucose as initial source of label. For calculations, we used glyceroyl-trioleate [MW 887] for triacylglycerols molar equivalences.
14
Table 5 Results obtained in the application of the described analytical process to epididymal adipocytes from adult male Wistar rats. Specific activities
µmol/well Bq/well Bq/µmol Bq/µmolC
initial medium glucose 12.2±0.4 4730 388±13 65±3*
medium "glucose" fraction 6.57±1.50 2465±326 444±98 74±16*
medium "lactate" fraction 4.93±0.65 1290±228 196±26 65±9*
medium "glycerol" fraction 1.22±0.12 269±58 202±36 67±12*
cell fatty acids' (soaps) fraction 357±41 106±56 0.26±0.11 0.014±0.006
cell glycerides-glycerol fraction 119±14 109±43 0.84±0.26 0.28±0.09
Data are the mean ± sem of 4 different complete runs (as described in the text) using glucose as initial source of label. * These values were not statistically different.
Figure 1 Centrifuge-separation tube with plastic insert used in the preparation and use of ion-interchange columns.
15
Figure 2 Flow diagram of the process of analysis of the fate of 14C-glucose label in the medium and cells of
rat epididymal WAT incubated during 24 hours.
The process is marked in black, red fractions refer to the counting of the fraction radioactivity, and blue is reserved for non-radioactive measurements (metabolites, cell parameters). The specific procedures explained under "Experimental" are marked in green, and the fractions eluted in purple. The four rectangles marked with dashed lines show the specific procedures for lactate, glucose and glycerol label separation, and for the processing of cell's fractions.
16
Figure 3 Percent distribution of labeled glucose (total label and metabolized glucose) after 24 h of incubation by epididymal adipocytes
The results are the mean ± sem of four different rats